This tag relates to the discussions on the development of analytics and business intelligence solutions, visualization, KPI and other business metrics management.
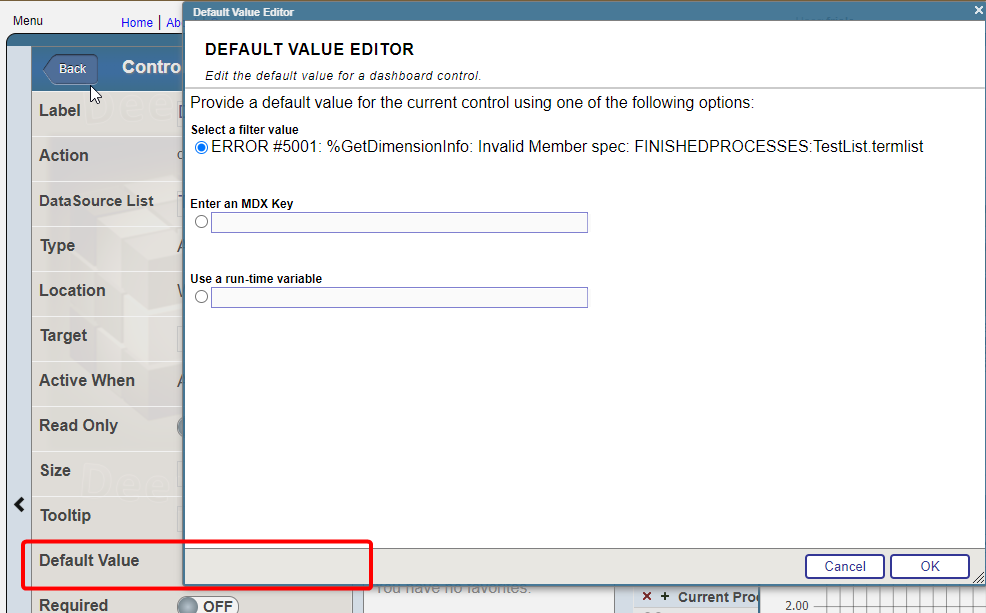
I have a widget that uses "choose Data source" control option. Termlist for the control consist of the two data sources and i want to set one of them by default. For example: I have two data sources, one is grouped by month, the other by year. I need to set the one that is grouped by year by default
https://www.youtube.com/embed/A4qAbMMQMaA [This is an embedded link, but you cannot view embedded content directly on the site because you have declined the cookies necessary to access it. To view embedded content, you would need to accept all cookies in your Cookies Settings]
https://www.youtube.com/embed/BY-l9RLzmFQ [This is an embedded link, but you cannot view embedded content directly on the site because you have declined the cookies necessary to access it. To view embedded content, you would need to accept all cookies in your Cookies Settings]
InterSystems has been at the forefront of database technology since its inception, pioneering innovations that consistently outperform competitors like Oracle, IBM, and Microsoft.
https://www.youtube.com/embed/-OwOAHC5b3s [This is an embedded link, but you cannot view embedded content directly on the site because you have declined the cookies necessary to access it. To view embedded content, you would need to accept all cookies in your Cookies Settings]
The rise of Big Data projects, real-time self-service analytics, online query services, and social networks, among others, have enabled scenarios for massive and high-performance data queries. In response to this challenge, MPP (massively parallel processing database) technology was created, and it quickly established itself. Among the open-source MPP options, Presto (https://prestodb.io/) is the best-known option. It originated in Facebook and was utilized for data analytics, but later became open-sourced.
The goal is to get data (from half a thousand to 3-4 thousands lines) from DB, calculate standart deviation then use it as logical condition in analyzer.
For example IF std > custom_value = show_the_result ELSE null
There is a STDDEV(MDX) method used in Analyzer but it is a measure and it can not be used as logical condition (correct me if i am wrong)
Hi, I'm new to the Analytics world in Intersystems and was attempting to print and/or export selected rows from a detail listing in a pivot on a dashboard. I am able to print and/or export all the rows; but if I select a specific set of rows, it prints out the entire detail listing; not the selected rows. Please advise on the best approach to accomplish this task. Thanks.
I am excited to share that the Learning Services team has recently added new content to our InterSystems Reports Learning Path. These latest videos, created by our partner, insightsoftware, provide instruction for developing reports with InterSystems Report Designer.
 By date
.png)
.png)
.png)
.png)
 Open Exchange app