 By likes
In the MDX Query Tool I can't seem to get the NOW relative syntax to work correctly. If I just use ".&[NOW]" it works, but something like ".&[NOW-1]" or ".&[NOW-1d]" (for dates extracted using DayMonthYear) it throws an error.
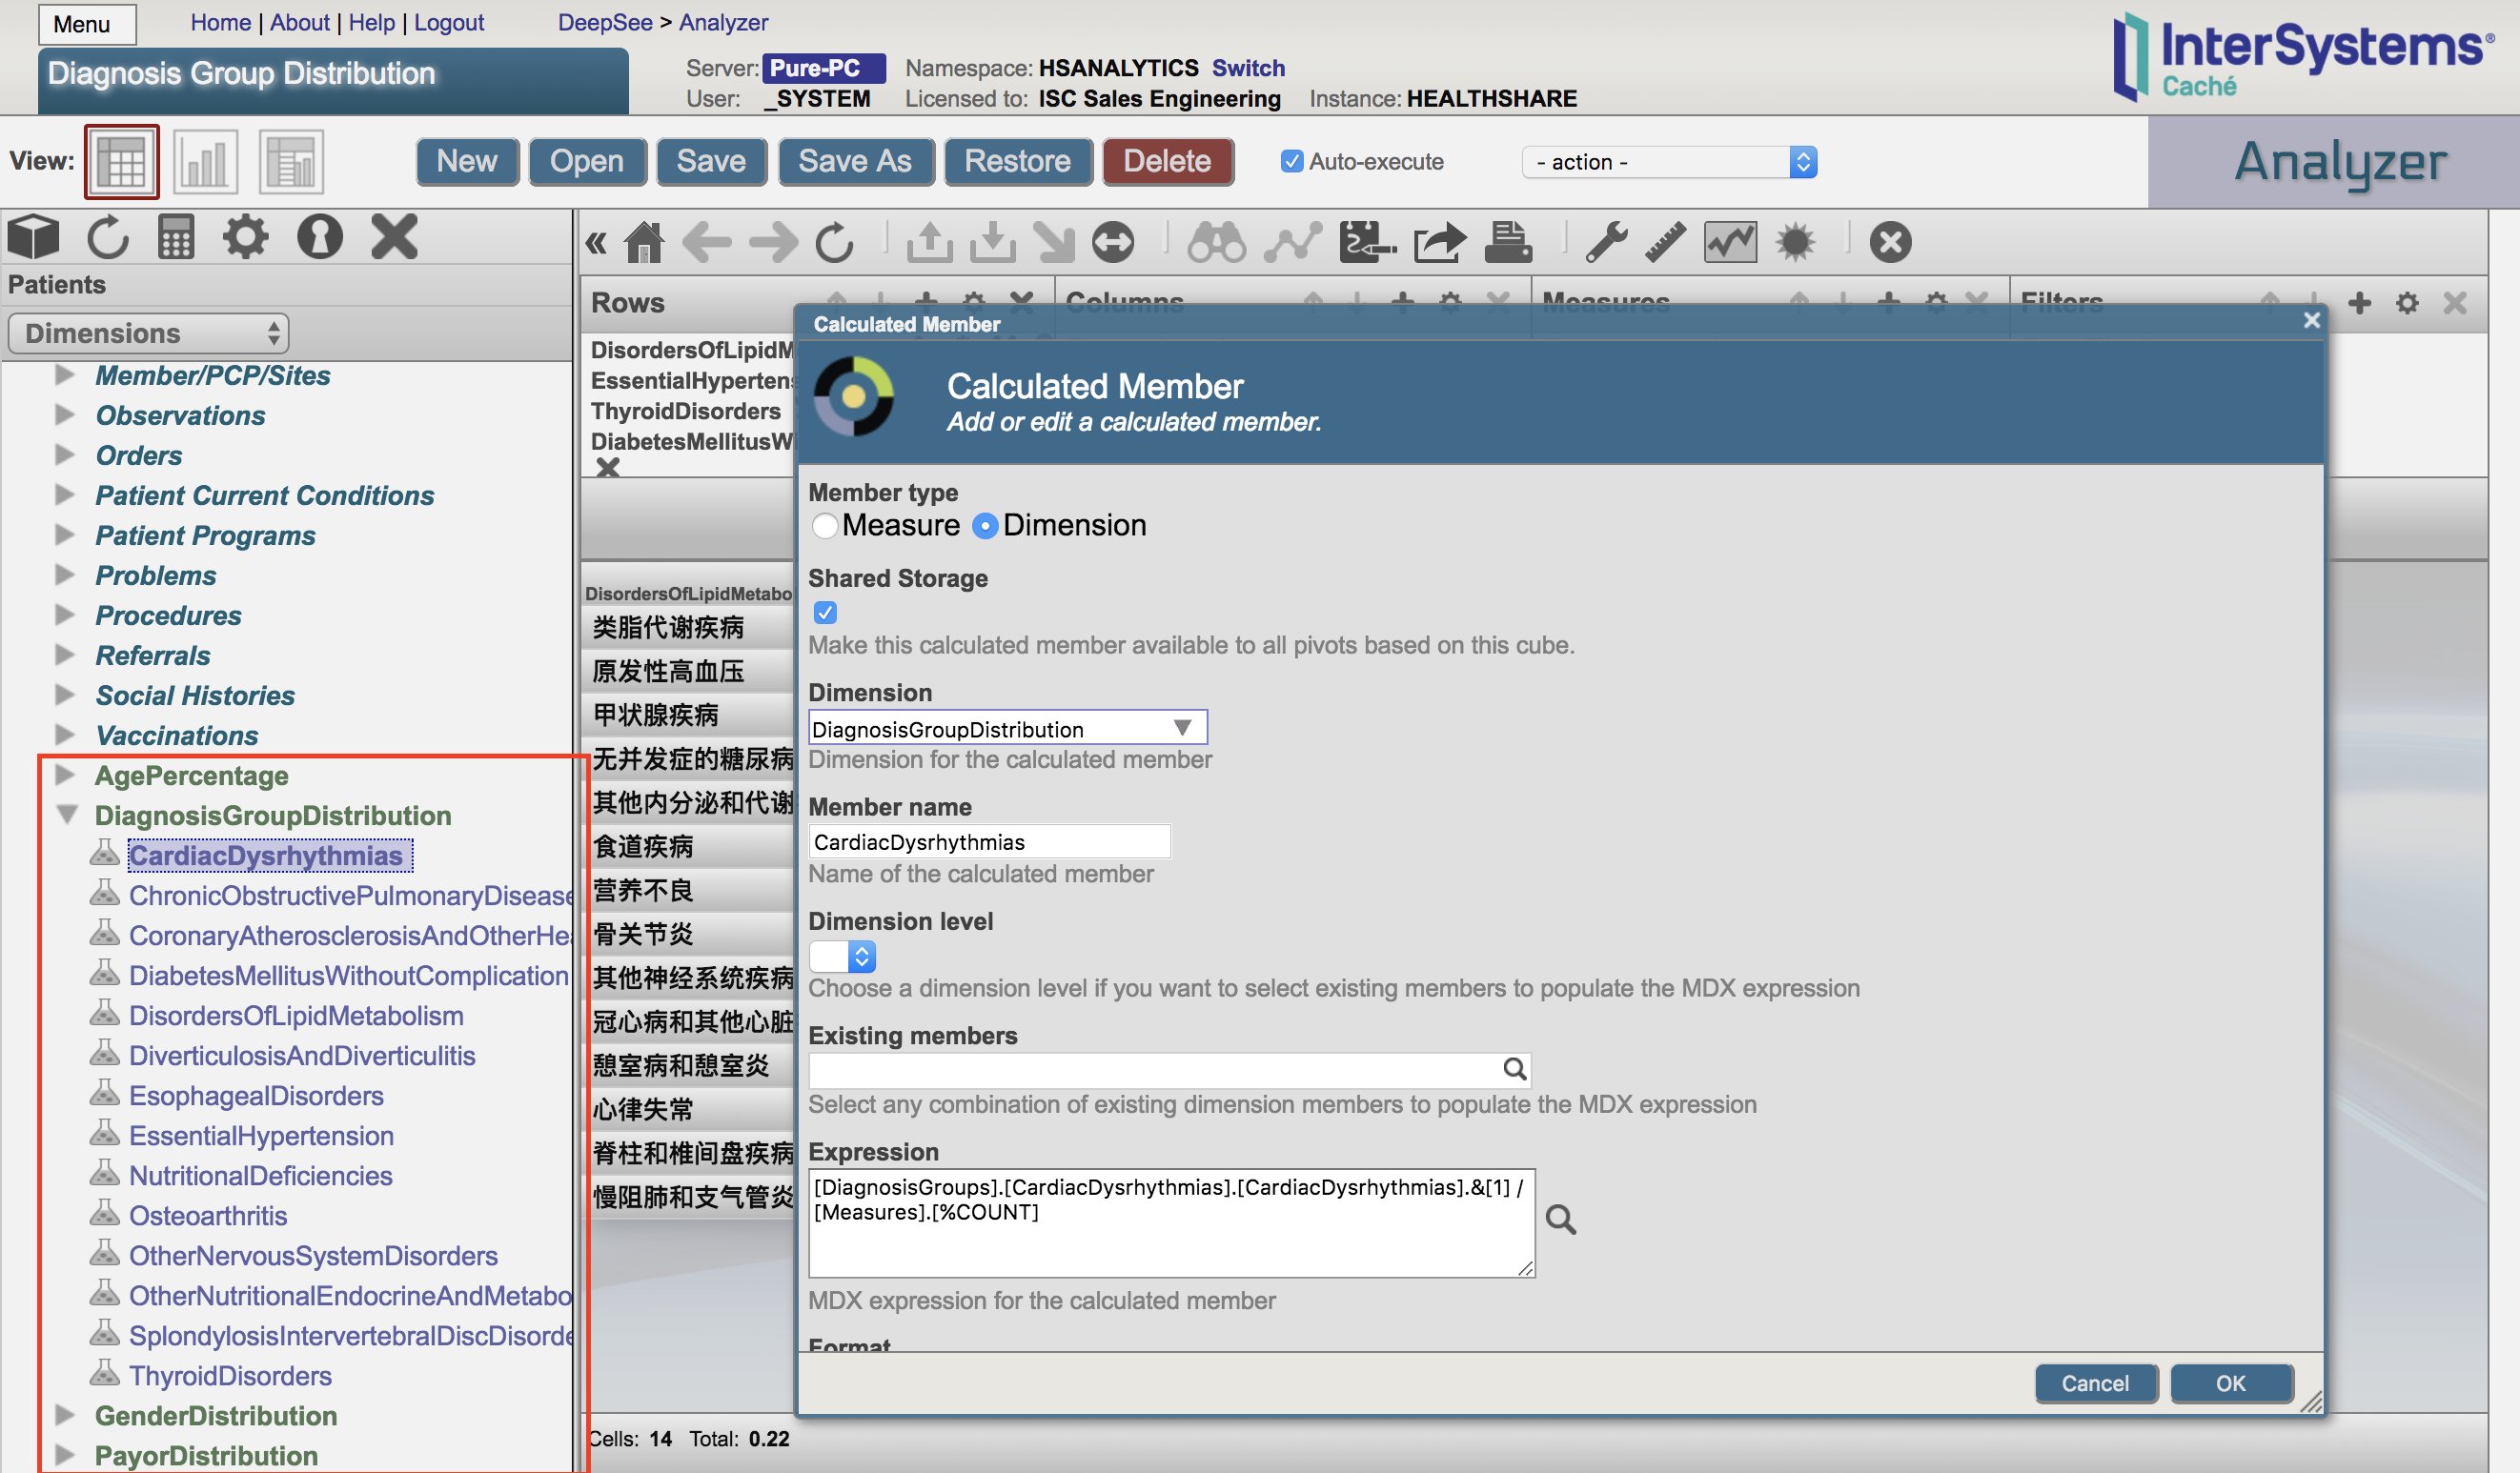
So this works:
.png)
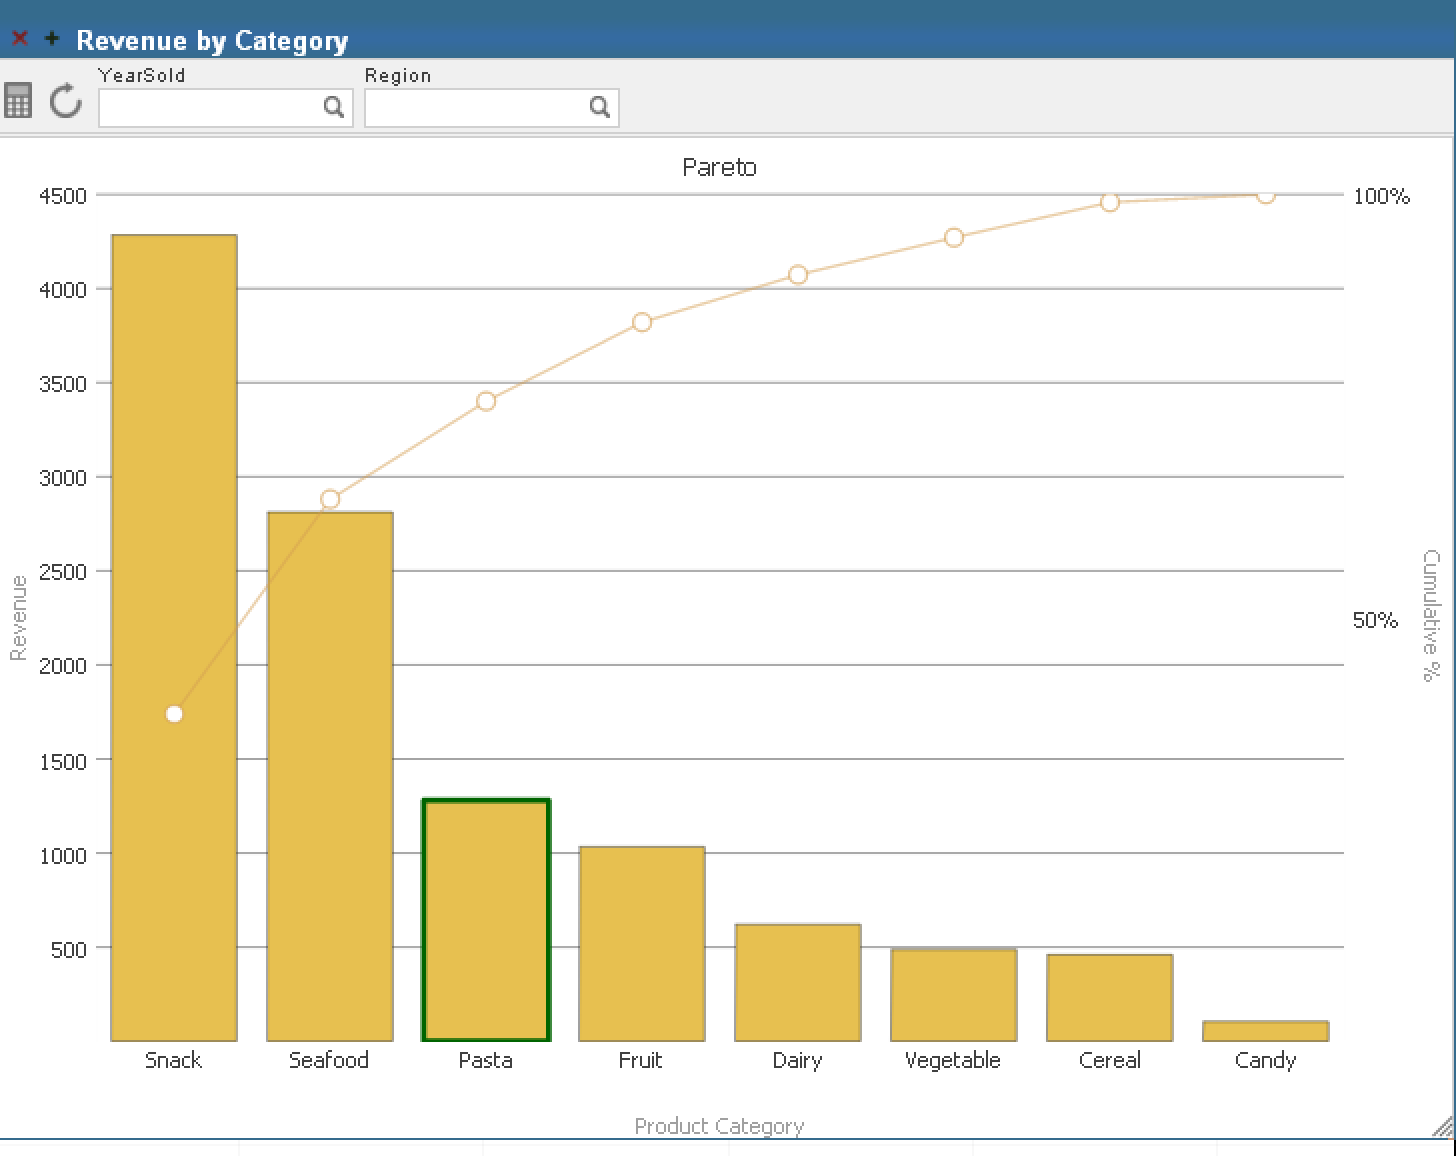
But if I change .&[NOW] to .&[NOW-1] I get this cryptic error message.
.png)
.png)