Multidimensional Expressions (MDX) is a query language for online analytical processing (OLAP) using a database management system. Much like SQL, it is a query language for OLAP cubes.
How are we doing THIS year versus the same period LAST year? This is a common need in Business Intelligence. In fact, many design specifications for reports make use of a comparison between a selected period (year, quarter, etc) up to a certain date (for example November 15th, 2016) and a summary of the same information for the previous year (i.e. up to November 15th, 2015). This post shows how to implement this in DeepSee.
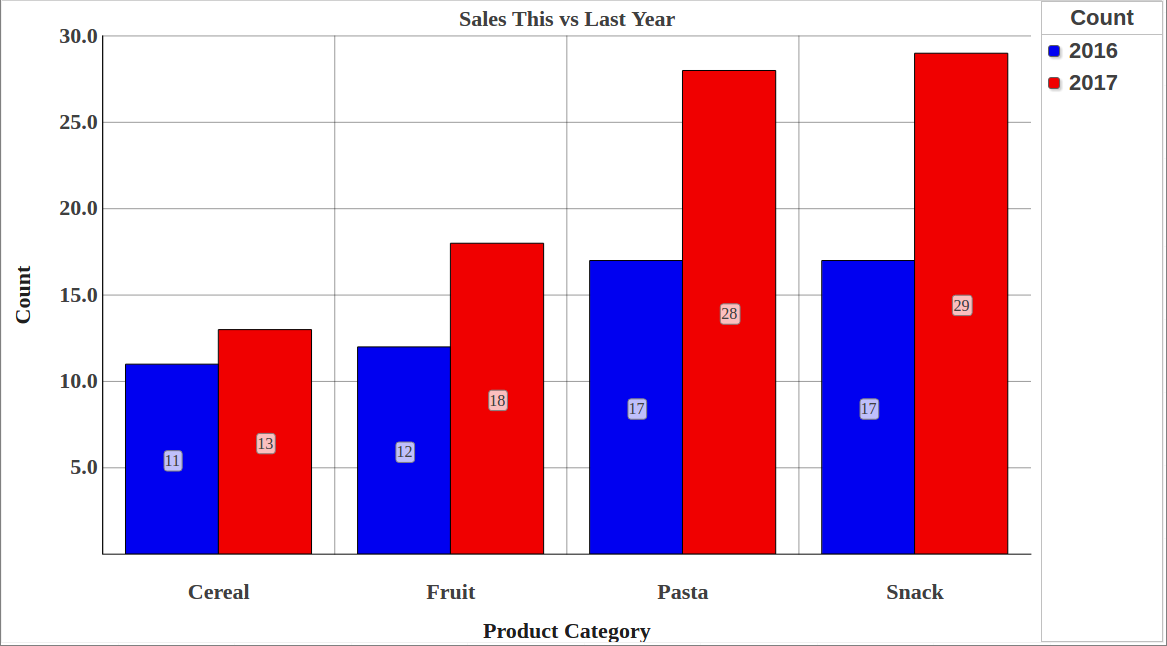
I have a dashboard which shows the growth of the months compared with the month from the last year.
The way I found to develop that, it was with a kpi. So, I overrode the %OnLoadKPI method with two mdx:
SELECT NON EMPTY [DataD].[H1].[MothYear].Members ON ROWS, [Measures].[CountVisits] ON COLUMNS FROM SubjectAtendimento %FILTER [DataD].[H1].[Year].&[2016]
SELECT NON EMPTY [DataD].[H1].[MonthYear].Members ON ROWS, [Measures].[CountVisits] ON COLUMNS FROM SubjectAtendimento %FILTER [DataD].[H1].[Year].&[2015]
Using cube CubeA and cube CubeB that contains calculated measure TotalClients. I would like to use TotalClient calculated measure from a compound cube CubeC (CubeA,CubeB).
I am trying to figure out how to compare two dimension values in a MDX query such that records where two dimension values are the same will be filtered out.
To test this, I have modified the HoleFoods cube in SAMPLES namespace to have a new dimension called RandomRegion
I want to create a MDX query where the [Outlet].[H1].[Region] value is not equal to the [RandomRegion].[H1].[RandomRegion] value.
I need to create a KPI similar to the DeepSee.Model.KPIs.DemoTrendLines kpi in Samples. This kpi supports a scorecard widget with a trend line. It shows patient counts by city with a trend line of the count of patients over a decade. What I want is to show the trend line based on the average allergy score ([Measures].[Avg Test Score]). A pivot table query that shows the data I would want to base the trend line on is:
Let's say I have a persistent class Sales. I need to create a report that shows the amount of sales for each branch. By simply using the class Sales for the source of the cube, I can show what I want with one little exception - the branches that did not have any sales are not shown. Is there a way around that that does not involve creating a whole new table just for this cube or using a Data connector (they have horrible documentation and I am unable to figure out how to use them properly)?
How can I create a calculated member in Analyzer using MDX for the following logic?
WHEN 'F' THEN 'FEMALE' WHEN 'Female' THEN 'FEMALE' WHEN 'M' THEN 'MALE' WHEN 'Male' THEN 'MALE' WHEN 'U' THEN UNDIFFERENTIATED' WHEN 'UN' THEN UNDIFFERENTIATED' WHEN 'Undifferentiated' THEN UNDIFFERENTIATED' ELSE 'OTHER' END
Hi! I am working on a project and I am facing a weird problem. I have created an MDX using Analyzer. This MDX executes very fast. I am trying to automate its execution with %DeepSee.ResultSet and the query never returns:
Set tSC = oMDX.%PrepareMDX(tMDX)
Quit:$System.Status.IsError(tSC)

Set tSC = oMDX.%Execute()
Quit:$System.Status.IsError(tSC)
What could be causing %Execute() to take so long to run while Analyzer is responding fast?
How to setup dollar ranges to get the number of patient accounts. So, I want to capture the number of patient accounts based on the original balance of:
0 to 499
500 to 999
1000 to 2499
5000 to 9999
10000 to 24999
25000 to 49999
50000 to 74000
75000 to 99999
In DeepSee, having a customer account cube. The cube includes a time dimension AccountCreationDate.
How do you create a calculated measure to get the total number of accounts from the beginning to a certain date in abscissa ?
I tried many things including this:
AGGREGATE(%TIMERANGE([AccountCreationDate].[H1].[MonthYear].&[190001],[AccountCreationDate].[H1].[MonthYear].CURRENTMEMBER) ,[Measures].[%Count])
But I don't get the right result because the date in abscissa creates a filter on the first date.
I'm trying to calculate the percentage of the top level with the SUM function. But I don't understand the PARENT behavior. It does not work in any way!
 By replies