Multidimensional Expressions (MDX) is a query language for online analytical processing (OLAP) using a database management system. Much like SQL, it is a query language for OLAP cubes.
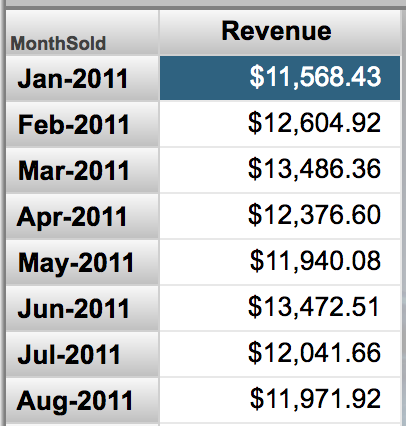
I have a dashboard which shows the growth of the months compared with the month from the last year.
The way I found to develop that, it was with a kpi. So, I overrode the %OnLoadKPI method with two mdx:
SELECT NON EMPTY [DataD].[H1].[MothYear].Members ON ROWS, [Measures].[CountVisits] ON COLUMNS FROM SubjectAtendimento %FILTER [DataD].[H1].[Year].&[2016]
SELECT NON EMPTY [DataD].[H1].[MonthYear].Members ON ROWS, [Measures].[CountVisits] ON COLUMNS FROM SubjectAtendimento %FILTER [DataD].[H1].[Year].&[2015]
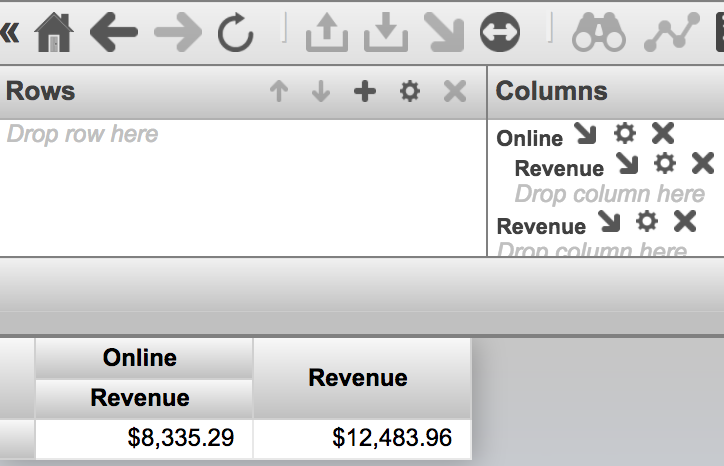
Using cube CubeA and cube CubeB that contains calculated measure TotalClients. I would like to use TotalClient calculated measure from a compound cube CubeC (CubeA,CubeB).
I am trying to figure out how to compare two dimension values in a MDX query such that records where two dimension values are the same will be filtered out.
To test this, I have modified the HoleFoods cube in SAMPLES namespace to have a new dimension called RandomRegion
I want to create a MDX query where the [Outlet].[H1].[Region] value is not equal to the [RandomRegion].[H1].[RandomRegion] value.
Let's say I have a persistent class Sales. I need to create a report that shows the amount of sales for each branch. By simply using the class Sales for the source of the cube, I can show what I want with one little exception - the branches that did not have any sales are not shown. Is there a way around that that does not involve creating a whole new table just for this cube or using a Data connector (they have horrible documentation and I am unable to figure out how to use them properly)?
I need to create a KPI similar to the DeepSee.Model.KPIs.DemoTrendLines kpi in Samples. This kpi supports a scorecard widget with a trend line. It shows patient counts by city with a trend line of the count of patients over a decade. What I want is to show the trend line based on the average allergy score ([Measures].[Avg Test Score]). A pivot table query that shows the data I would want to base the trend line on is:
How to setup dollar ranges to get the number of patient accounts. So, I want to capture the number of patient accounts based on the original balance of:
0 to 499
500 to 999
1000 to 2499
5000 to 9999
10000 to 24999
25000 to 49999
50000 to 74000
75000 to 99999
Hi! I am working on a project and I am facing a weird problem. I have created an MDX using Analyzer. This MDX executes very fast. I am trying to automate its execution with %DeepSee.ResultSet and the query never returns:
Set tSC = oMDX.%PrepareMDX(tMDX)
Quit:$System.Status.IsError(tSC)

Set tSC = oMDX.%Execute()
Quit:$System.Status.IsError(tSC)
What could be causing %Execute() to take so long to run while Analyzer is responding fast?
In DeepSee, having a customer account cube. The cube includes a time dimension AccountCreationDate.
How do you create a calculated measure to get the total number of accounts from the beginning to a certain date in abscissa ?
I tried many things including this:
AGGREGATE(%TIMERANGE([AccountCreationDate].[H1].[MonthYear].&[190001],[AccountCreationDate].[H1].[MonthYear].CURRENTMEMBER) ,[Measures].[%Count])
But I don't get the right result because the date in abscissa creates a filter on the first date.
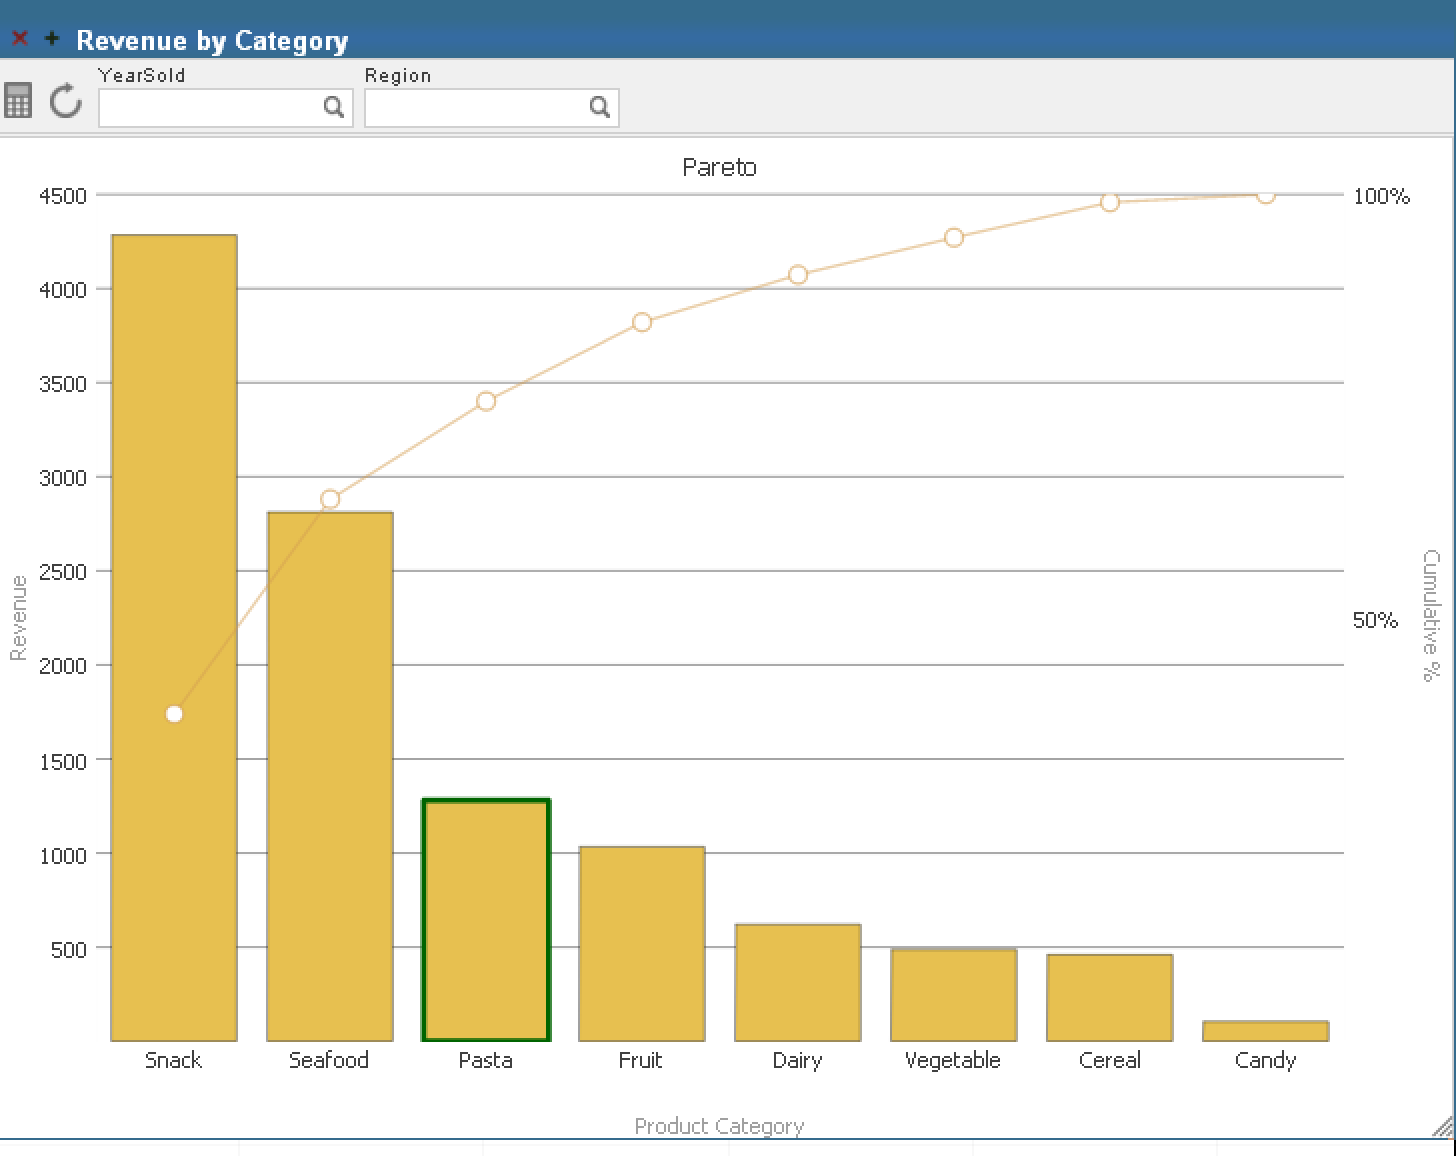
I'm trying to calculate the percentage of the top level with the SUM function. But I don't understand the PARENT behavior. It does not work in any way!
suppose a part of my mdx query is [DIMENSION].[H1].[LEVEL1].CURRENTMEMBER.Property("PROP1").
If the source property of PROP1 is also used as a dimension level somehwere in the cube, this query will return a key to the entry in the coresponding star table.
Does anybody know how I can follow that key and display the real value value?
Sometimes I need to filter the widget on a dashboard from a different cube. And I face the following problem:
Widget A refers to a query from Cube A and I want to filter Widget B from Widget B.
Widget's B pivot refers to Cube B, and which has different dimensions for the same data.
E.g. cube A has the dimension Author and the Cube B has the dimension Member for the same data. So there is no way to filter such a widget B from the widget A.
I want to have a generic PercentOfAll measure that can be used for any dimension of the cube. This PercentOfAll should act like Count, but instead of showing the number of rows in a cell, it will show the percentage (100*number of rows for that member/all rows) .It should not matter what dimension is being viewed. Ex
There are a total of 100 rows in the source class.
 By replies