¡Hola, comunidad!
Aquí está el resumen de la última media jornada del InterSystems Ready 2025. ¡Fue la última oportunidad para ver a todos y despedirse!
Fue un cierre cálido y enérgico, con grandes conversaciones, sonrisas y recuerdos inolvidables.
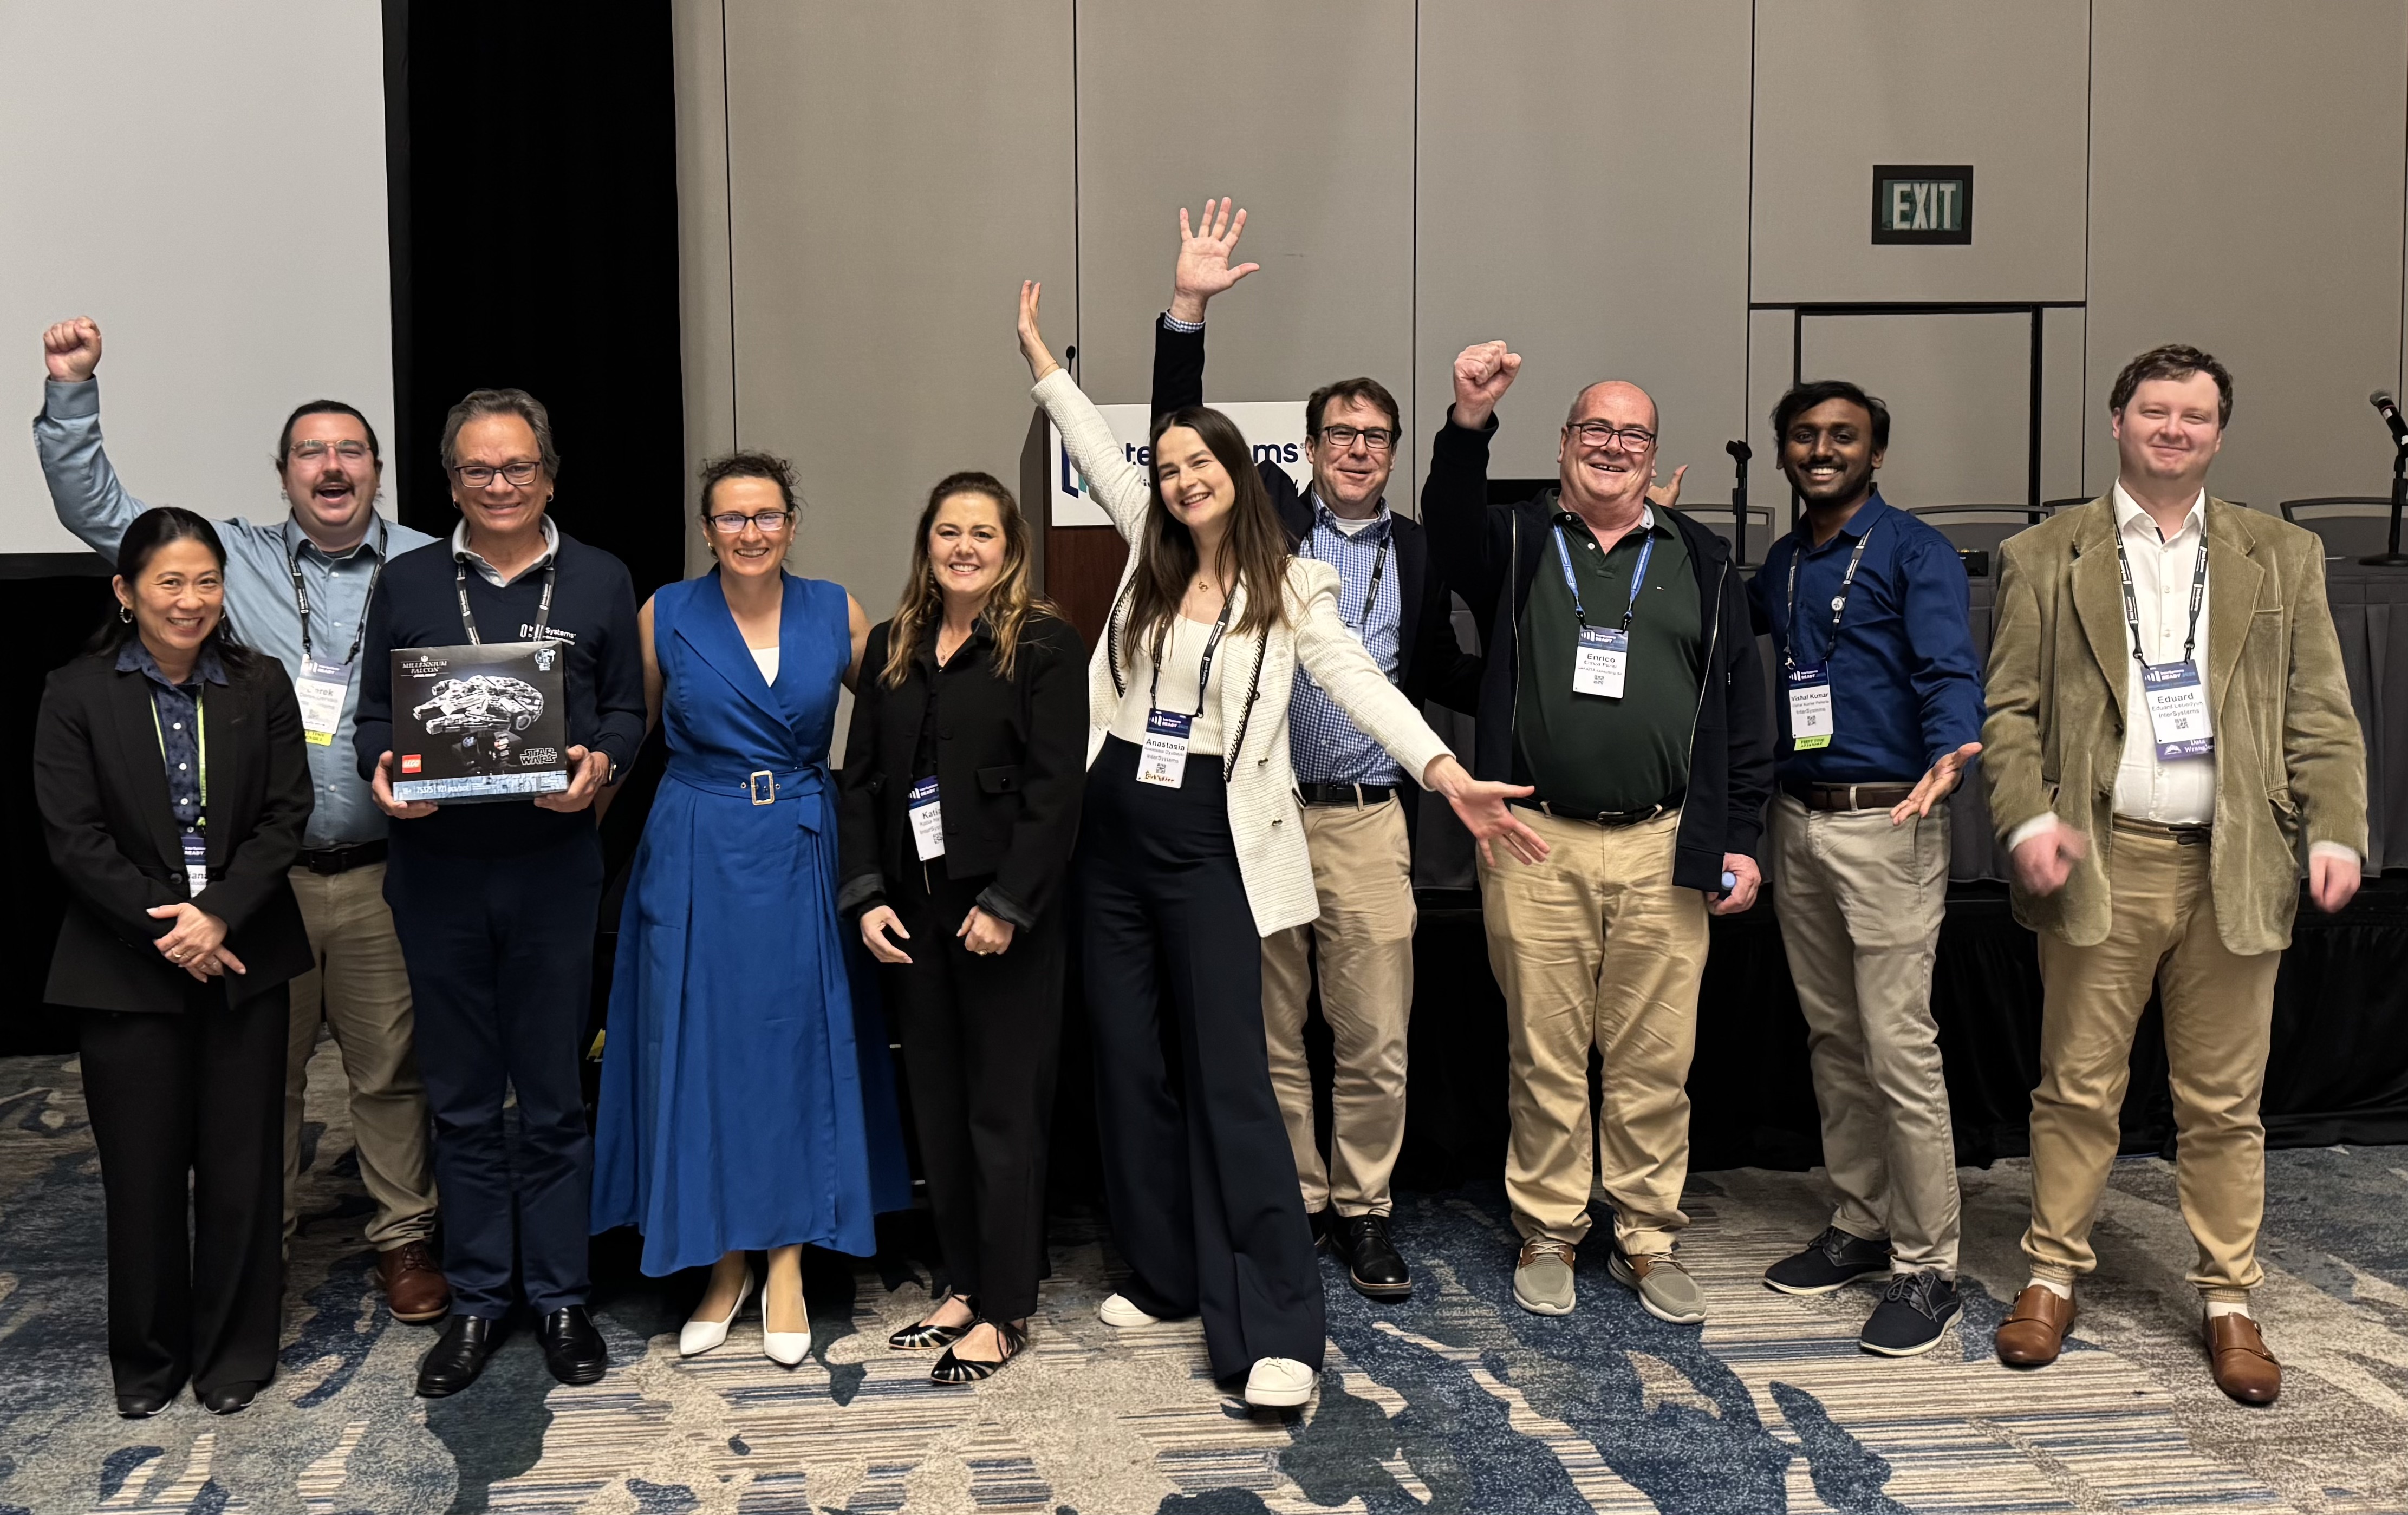
¡El momento final del Ready 2025 con nuestro increíble equipo!
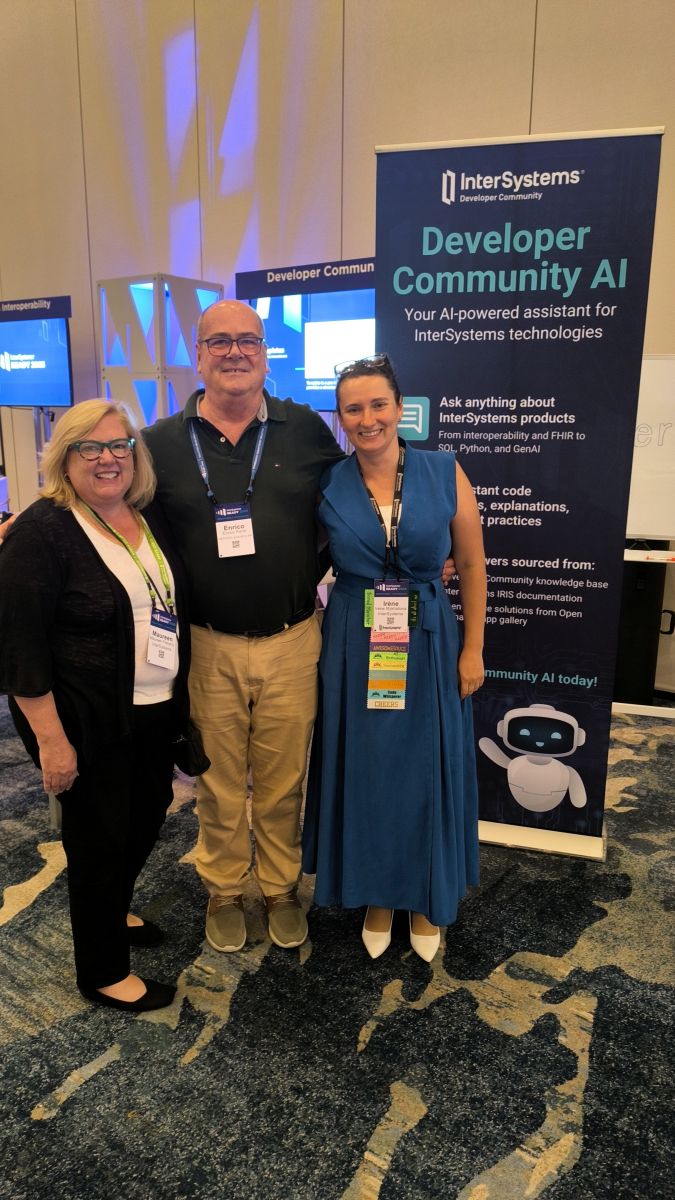
Y, por supuesto, ¡demos un enorme GRACIAS a la madrina del Ready 2025, @Maureen Flaherty! ¡Tú y tu equipo sois los mejores! Aquí estamos junto a @Enrico Parisi.
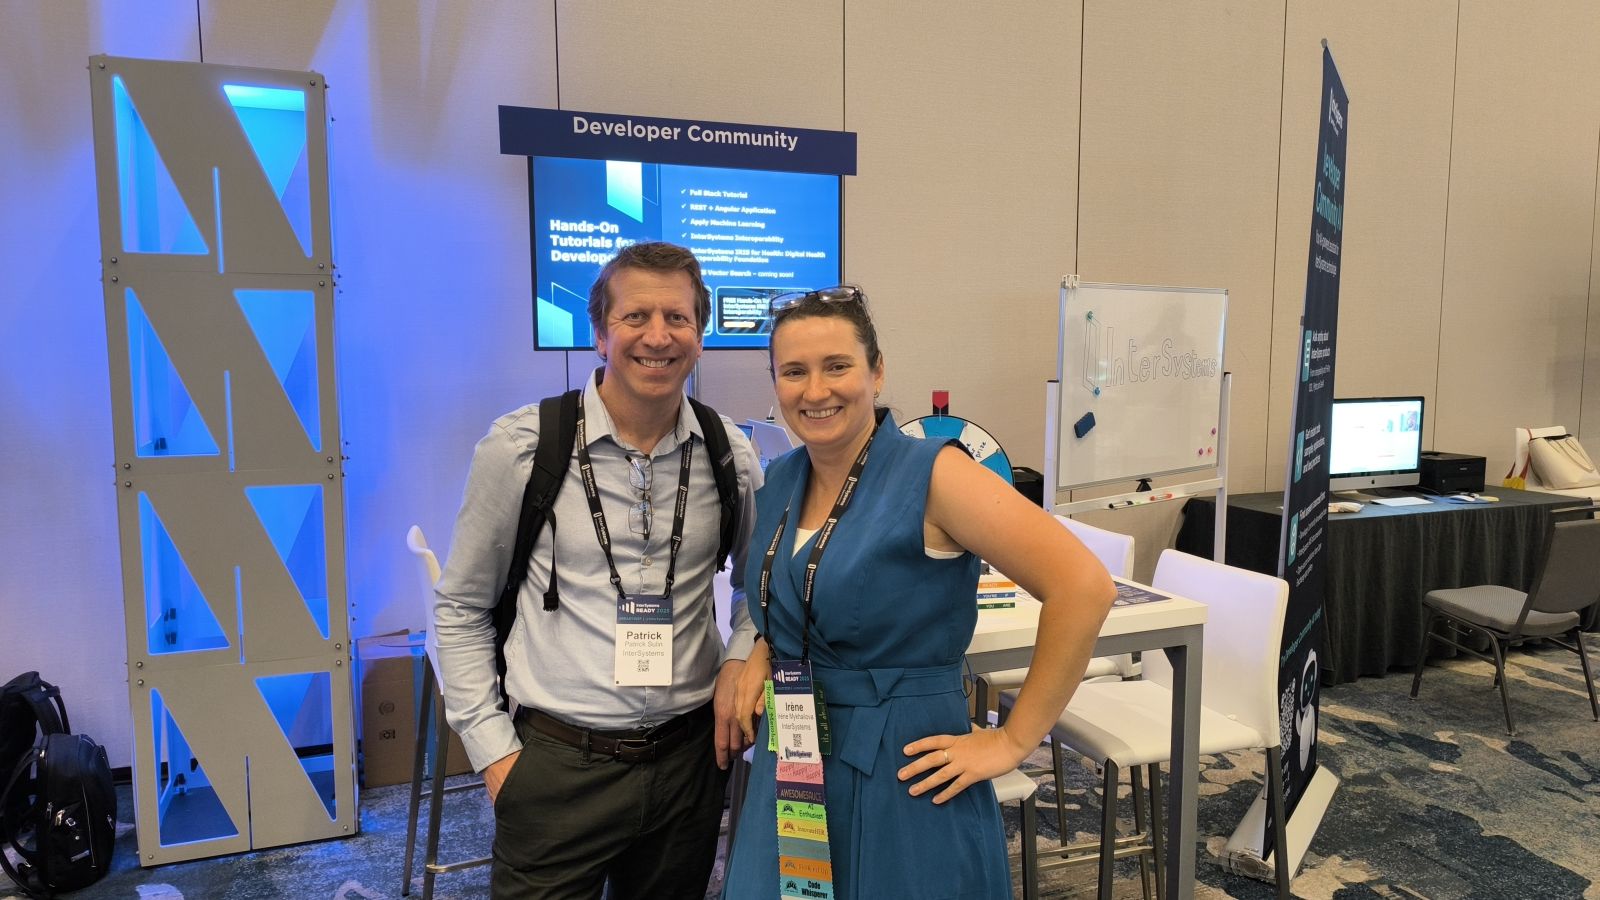
@Patrick Sulin pasó por la mesa de la Developer Community:
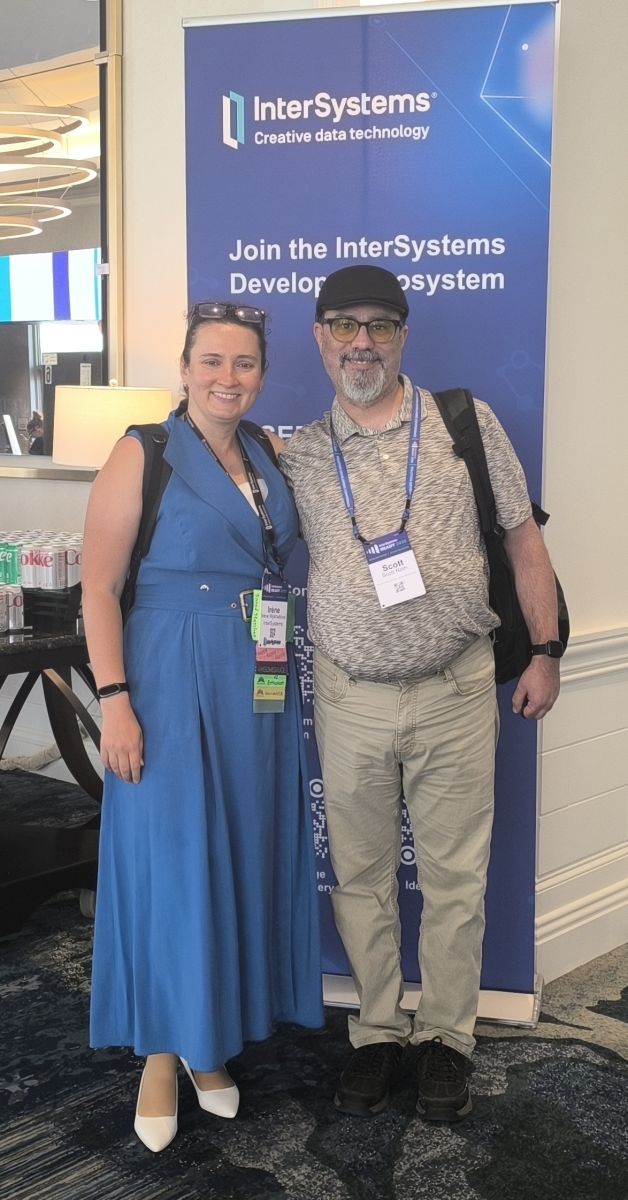
Encontramos a @Scott Roth fuera del Tech Exchange.

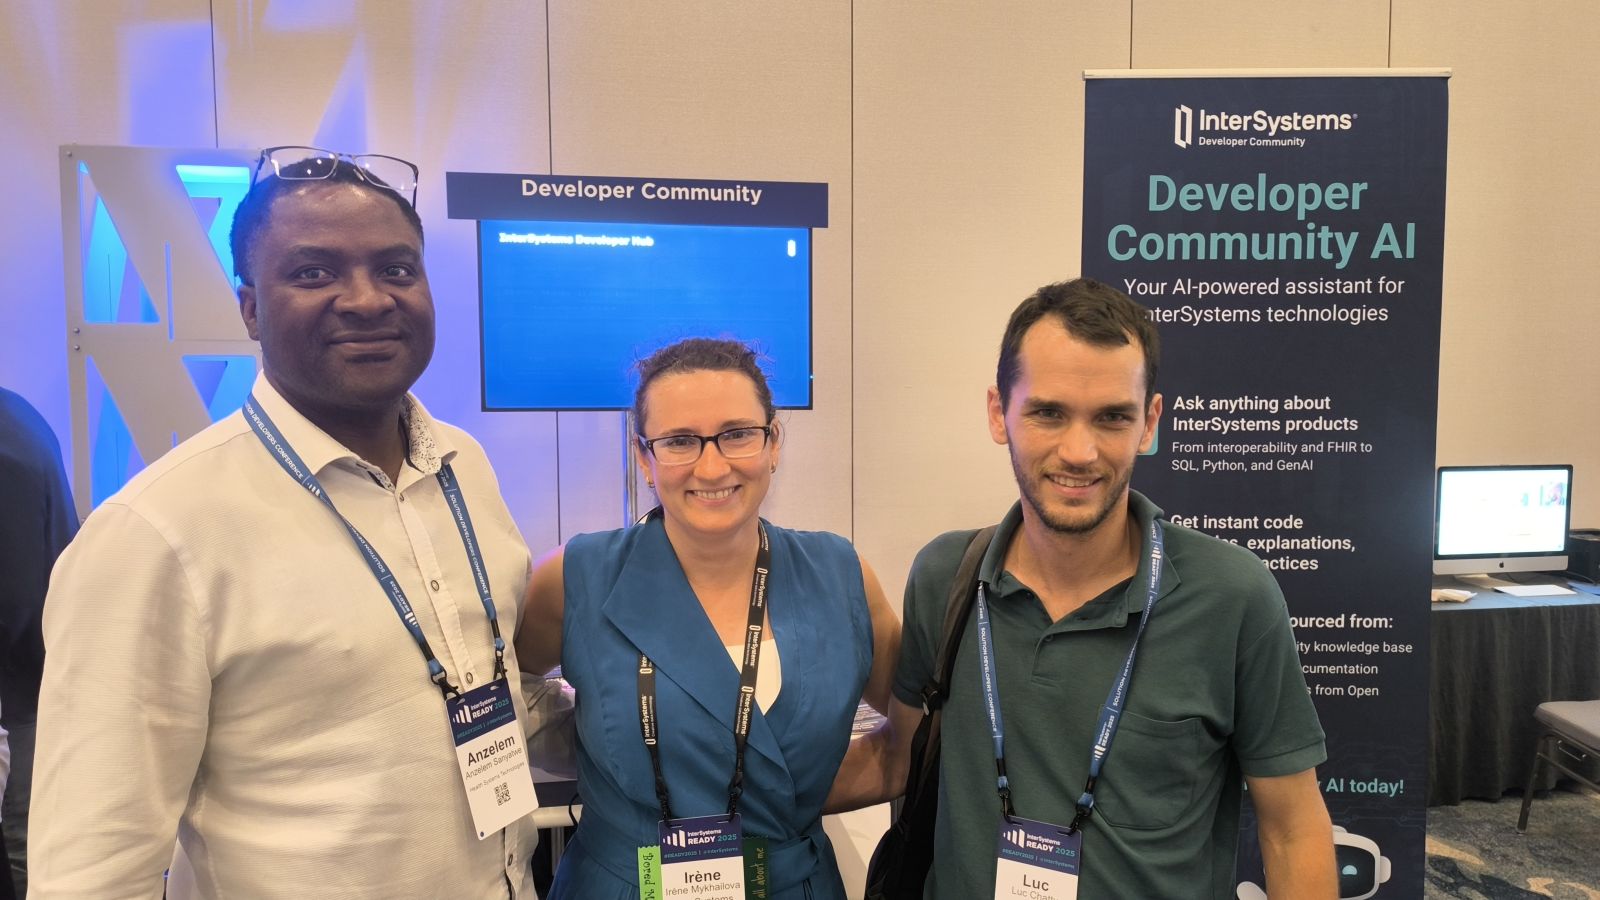
Mi compañero de golf @Anzelem Sanyatwe también vino a hacer girar la ruleta de la fortuna. Y Luc Chatty pasó a saludar.
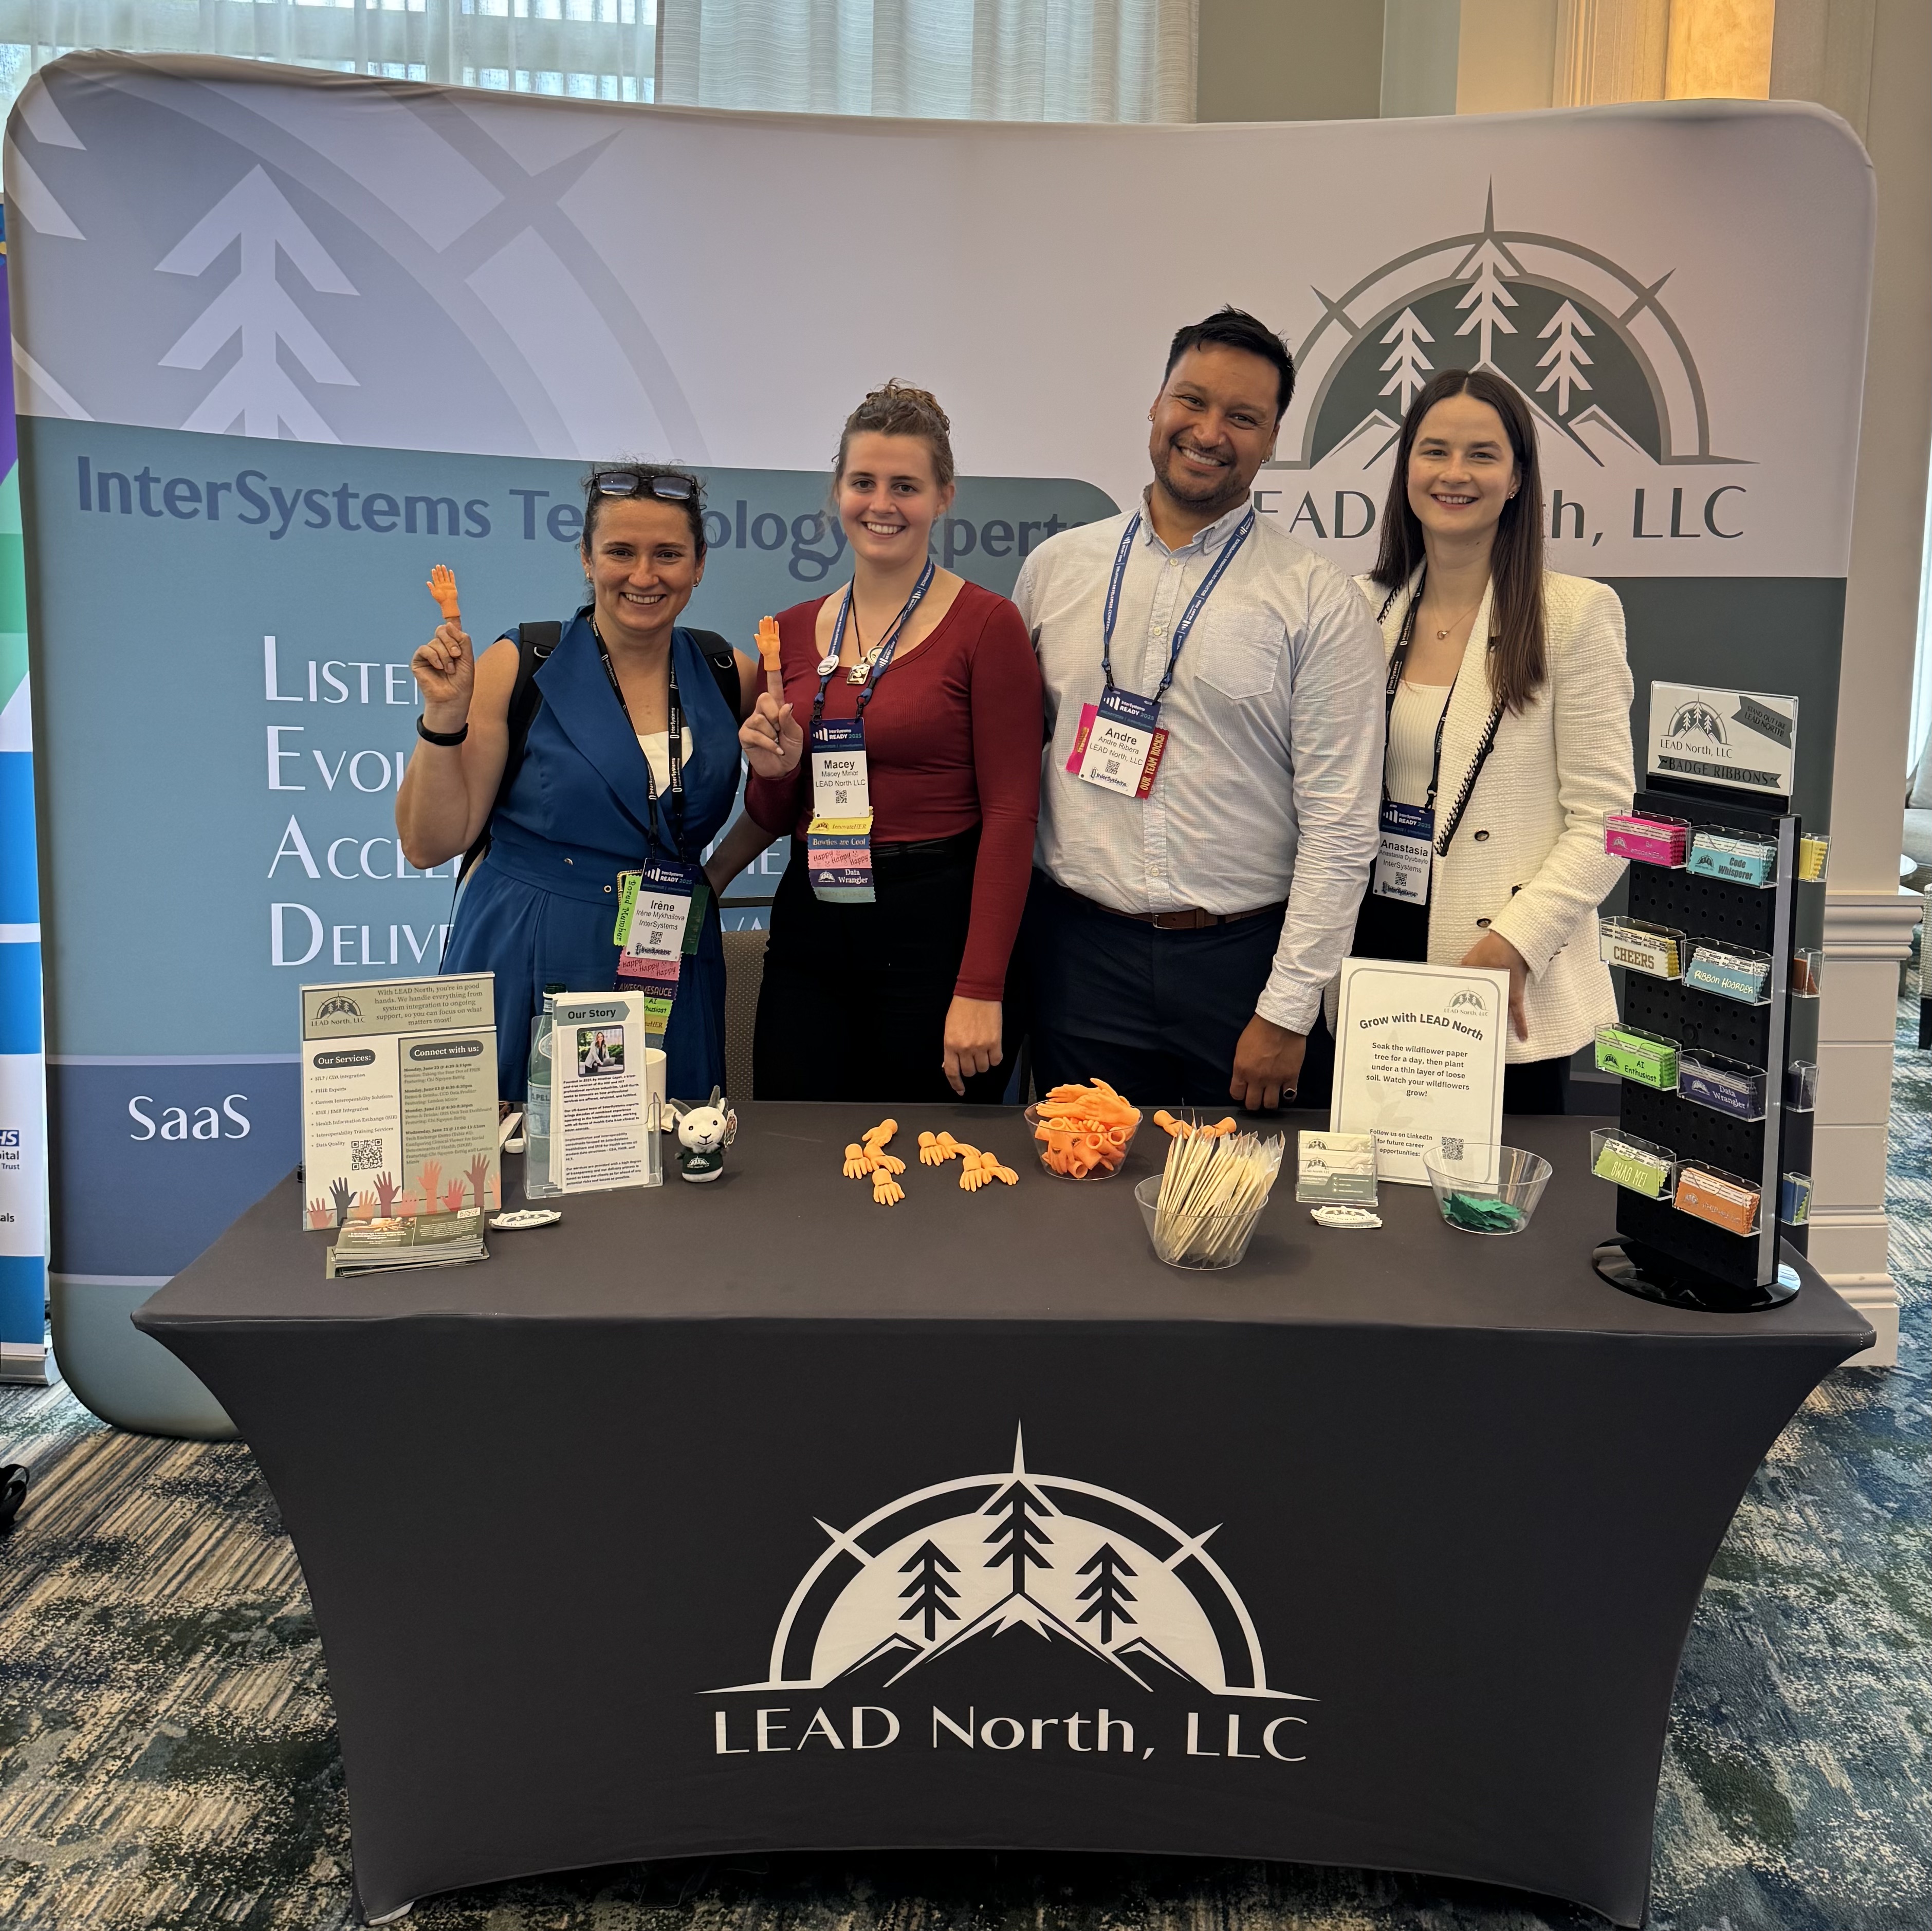
Fuimos a visitar la fuente de las grandes cintas. Aquí están @Iryna Mykhailova, @Macey Minor, @Andre Ribera y @Anastasia Dyubaylo.
También llegó el momento para que los ganadores del Concurso de Programación de IA presentaran sus aplicaciones de agentes de IA.
@Sergei Shutov habló sobre los Agentes de IA como ciudadanos de primera clase en InterSystems IRIS:
@Eric Fortenberry presentó "Una visión minimalista de la IA: Explorando embeddings y búsqueda vectorial con EasyBot":
.png)
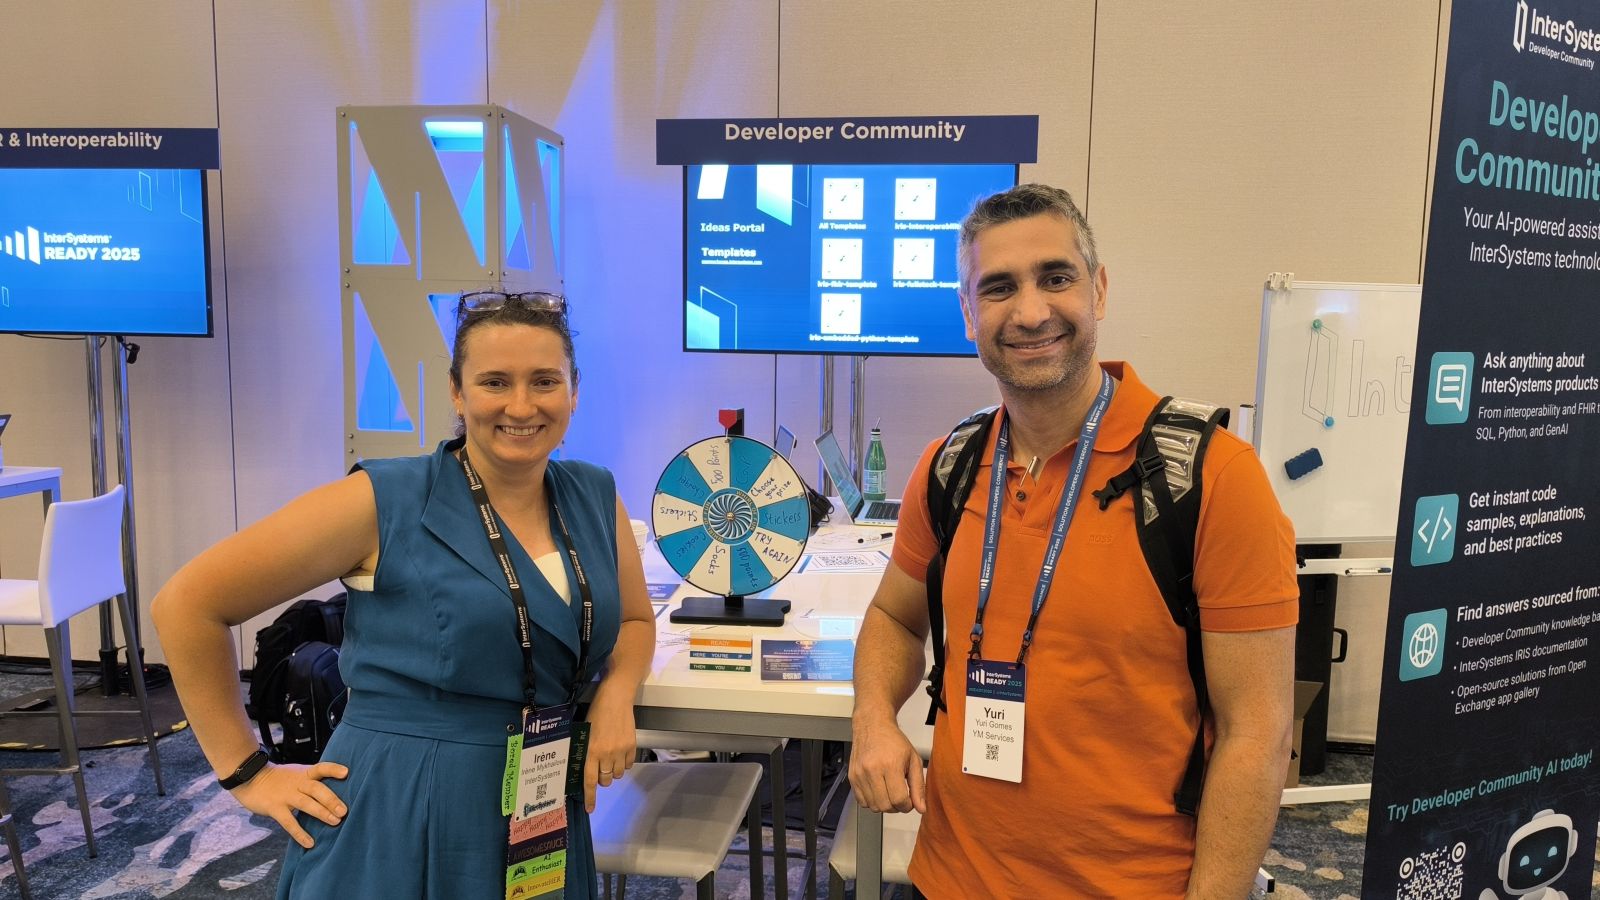
@Yuri Marx habló sobre el control del lenguaje natural en IRIS:
.png)
@Muhammad Waseem habló sobre la próxima generación de aplicaciones autónomas de agentes de IA:
.png)
@Henry Pereira, @Henrique Dias y @José Pereira fueron rodeados por toda la gente que vino a escuchar la presentación "Command the Crew - crea un equipo de IA para automatizar tu trabajo":
@Victor Naroditskiy explicó como funciona la IA de la Comunidad de Desarrolladores:
.png)
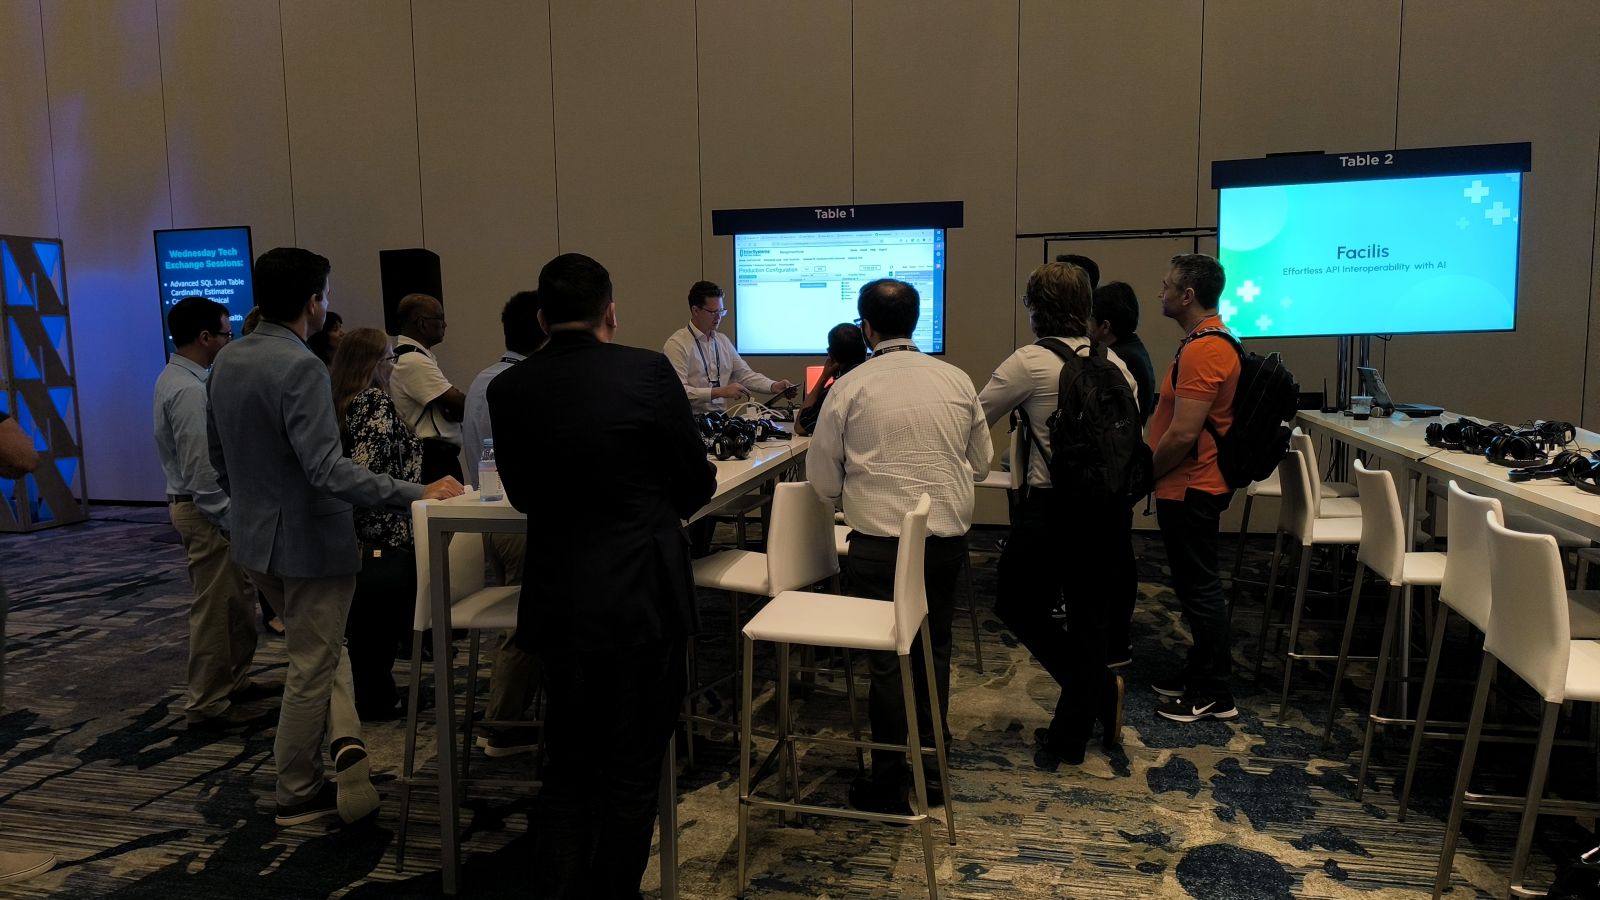
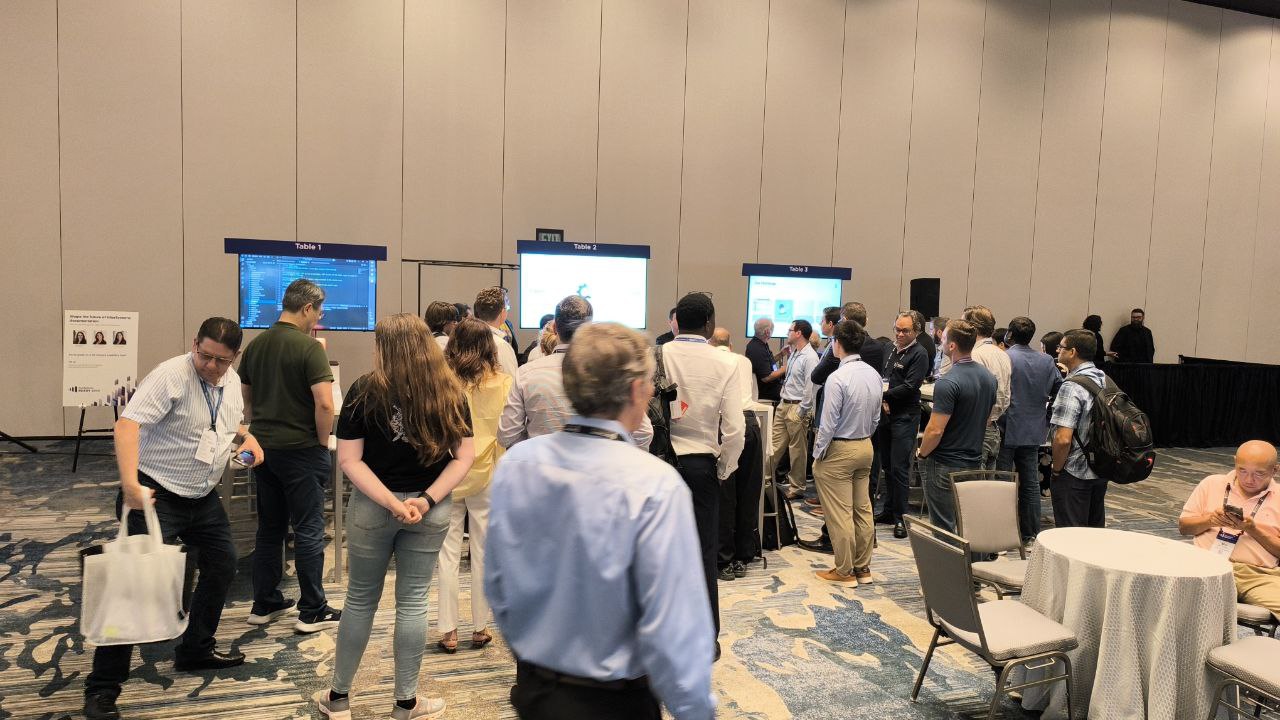
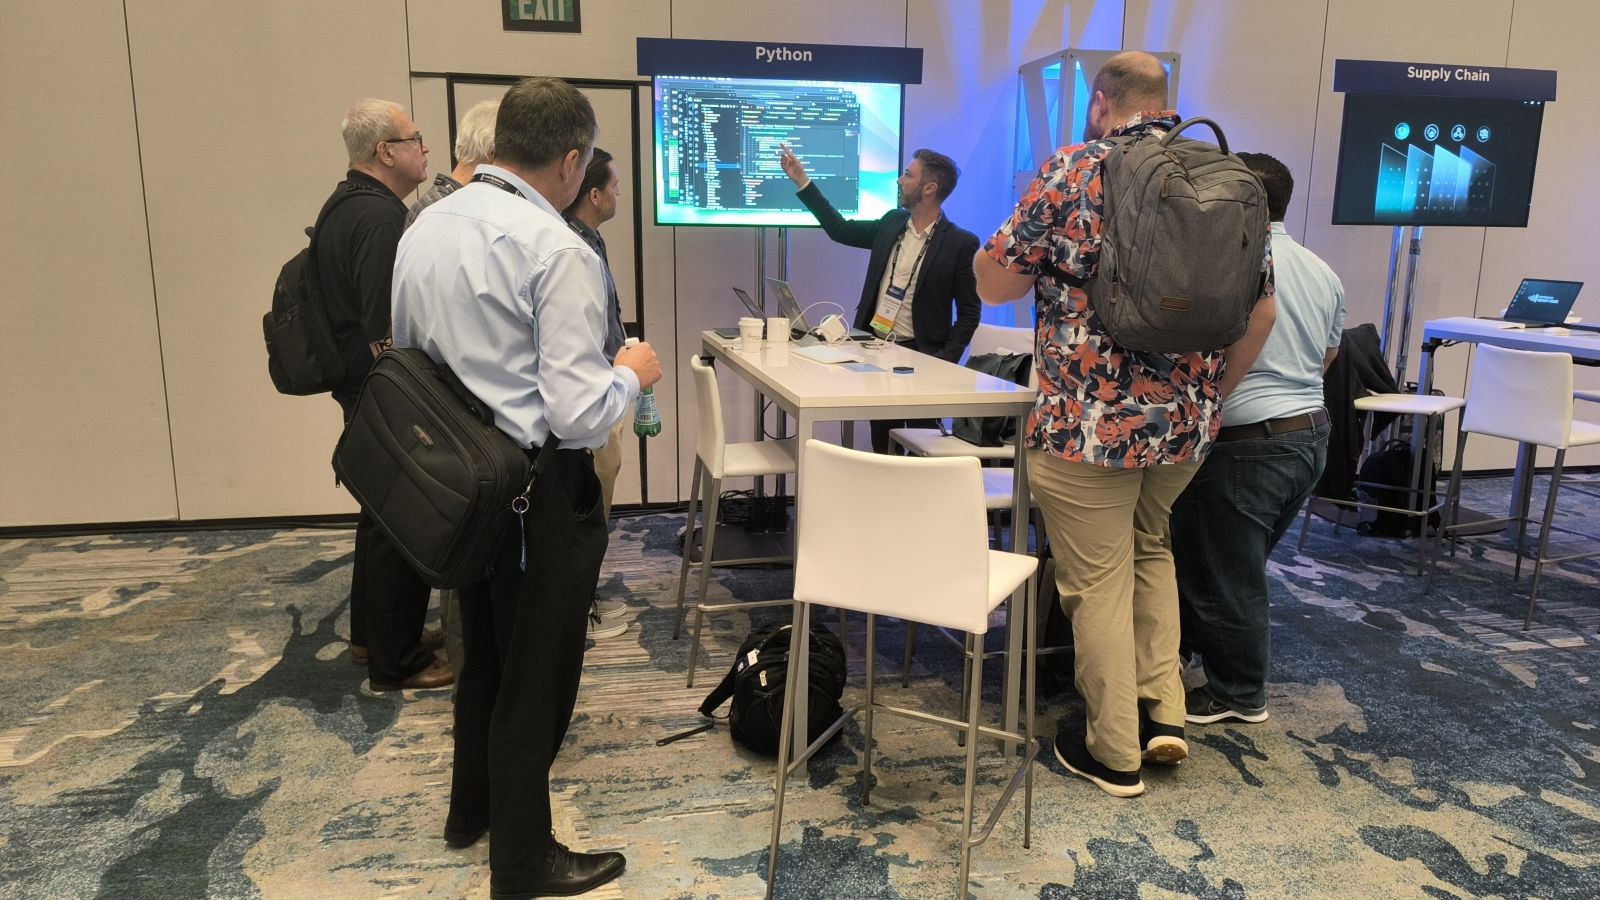
Además, en las otras mesas la gente realizó otras presentaciones. Por ejemplo, @Guillaume Rongier habló sobre Python:
Salgamos del Tech Exchange y veamos qué estaba pasando en las sesiones de DC. @Ben Spead, @Hannah Sullivan, @Victor Naroditskiy y @Dean Andrews hablaron sobre el uso de SerenityGPT para construir middleware de GenAI:
.png)
Y, por supuesto, la sesión principal del Ready 2025: Ecosistema de Desarrolladores de InterSystems: nuevos recursos y herramientas que debéis conocer. @Dean Andrews y @Anastasia Dyubaylo ofrecieron un resumen de todas las novedades del Ecosistema DC:

Después, @David Reche comprobó si el público estaba atento con su juego de Kahoot! Por favor, demos la bienvenida a los ganadores: @Vishal Pallerla, @Rochael Ribeiro y @Jason Morgan. ¡Felicidades! ¡Esperamos que disfrutéis vuestro premio!
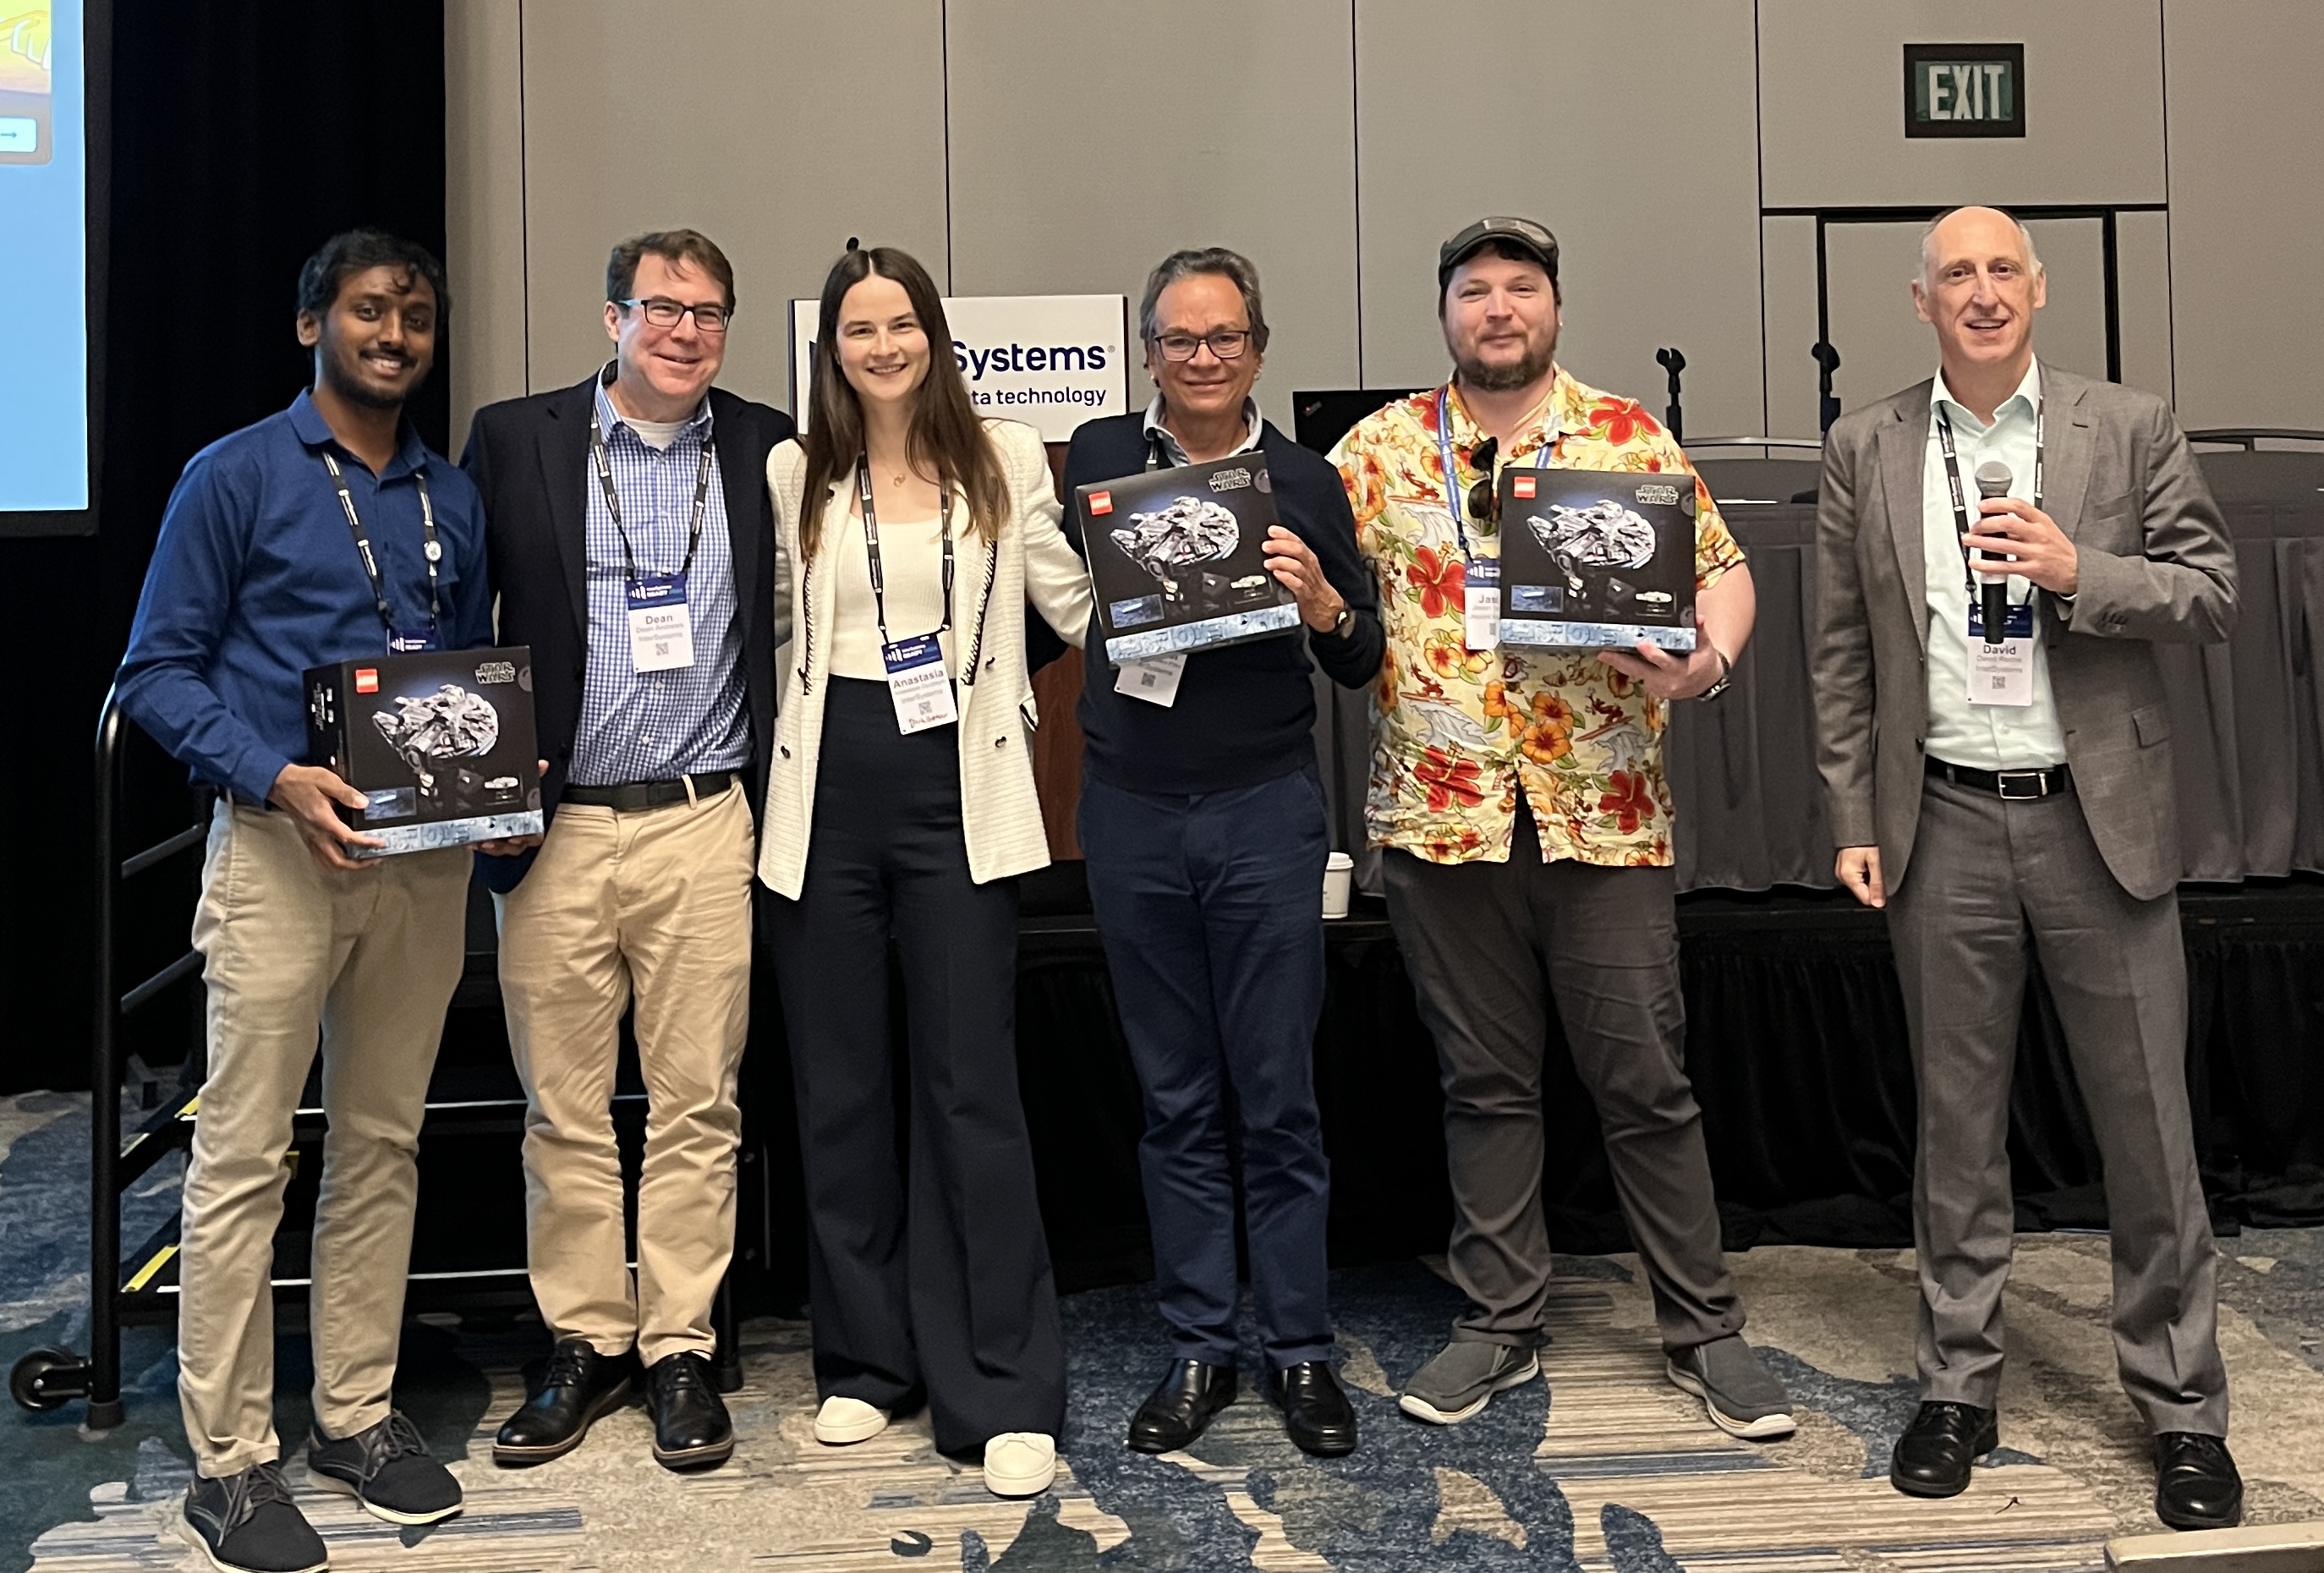
@Juliana Yamao Modesto, @Derek Gervais, @Rochael Ribeiro, @Katia Neves, @Anastasia Dyubaylo, @Dean Andrews, @Enrico Parisi, @Vishal Pallerla, @Eduard Lebedyuk
.png)
Con esta feliz nota, prometí la última vez contarles quién fue la única persona verificada que respondió correctamente todas las preguntas del quiz en la mesa de DC. ¡Y fue @Asaf Sinay! ¡Felicidades! @Olga Zavrazhnova y todo el equipo de Global Masters están felices de que tanta gente haya venido y tratado de superarlo. Si os interesa hacer un quiz, aquí tenéis el enlace. Y si quieres responder más preguntas, podéis encontrarlas en Global Masters.
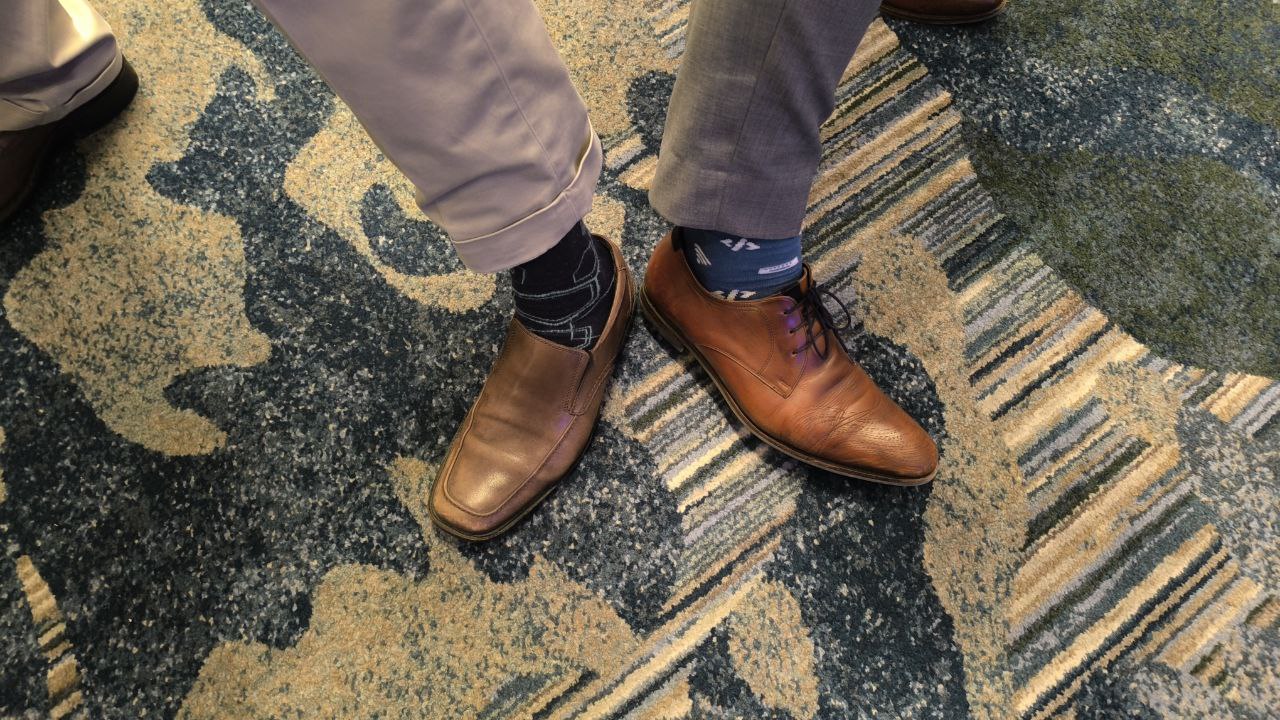
Hablando de Global Masters y quizzes, no podéis dejar pasar la recompensa más popular 😁 Ninguna cumbre pasa sin que alguien me muestre sus calcetines de la Developer Community 🤣
Como podéis ver, el equipo brasileño de DC está muy feliz: @Rochael Ribeiro, @Juliana Yamao Modesto, @Danusa Calixto y @Heloisa Paiva, ¡os extrañamos mucho! Con vosotros, el equipo de la Comunidad de Desarrolladores en portugués habría estado completo.
.png)
Esto fue casi el final del Ready 2025 y es el final esta crónica.
El rumor es que la próxima cumbre será en abril en Washington, D.C. ¡Ponedlo en vuestro calendario para no agendar dos cosas a la vez, sabéis que queréis!
Nos vemos el próximo año.