This tag relates to the discussions on the development of analytics and business intelligence solutions, visualization, KPI and other business metrics management.
I am working with InterSystems IRIS and seeking guidance on how to perform specific tasks related to the FHIR SQL Builder using commands or code, rather than the graphical user interface (GUI). The specific tasks I am trying to accomplish are:
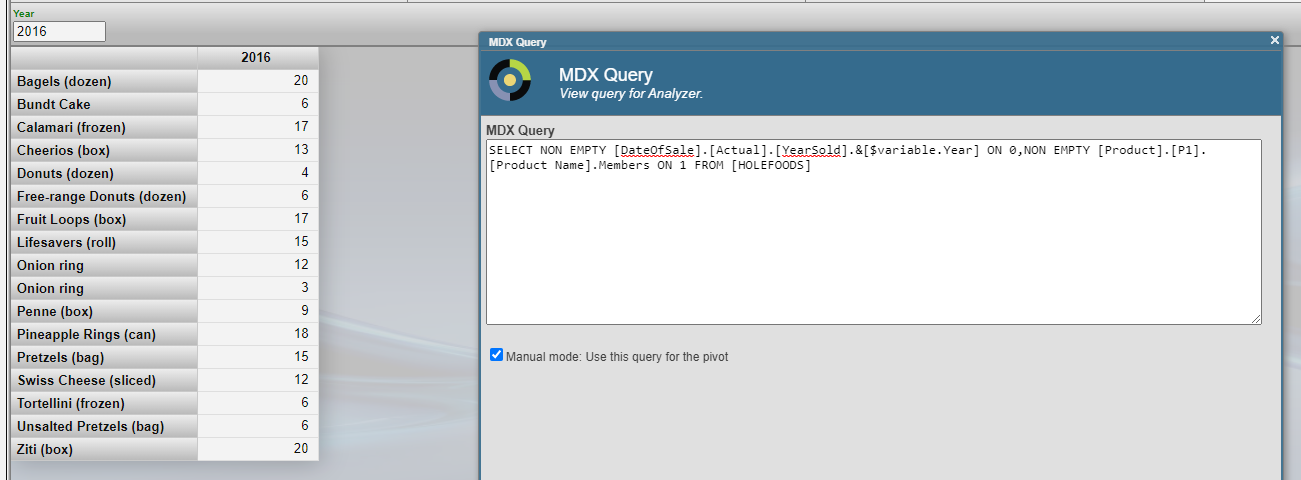
When creating pivots in DeepSee, there is the ability to group date dimensions by Day, Week, Month, Quarter, Year. For some of our reporting the Week option is desired. However the display looks like the image shown below. Notice the "YYYYW##" formatting.
Is there any ability within DeepSee to modify the display of grouped week dates? E.g. instead of 2020W14 it could be 03/30/2020-04/05-2020, or even just the start or end date, etc.
I'm trying to build a cube based on a linked table but seems that IRIS is not able to do it :O
Long story short, I have a linked table in IRIS that sources a Microsoft SQL table (using standard linked feature from the portal). It works fine, I can access it using SQL as many other times. On top of that, I've created in DeepSee (ok, Analytics) a cube that uses this class as source. It compiles correctly, no errors given. When I build it with 100 records, all goes well and using Analyzer I can see results.
I hope this message finds you well. I am reaching out because I have encountered an issue with a new dimension I created, named "Region," and I could use your assistance in resolving it.
The problem is that when I open the cube analyzer, the "Region" dimension does not populate data as expected. Instead, it merely displays the text "sourceRegion," which I specified as an expression in the architect.
Hi, I'm new to the Analytics world in Intersystems and was attempting to print and/or export selected rows from a detail listing in a pivot on a dashboard. I am able to print and/or export all the rows; but if I select a specific set of rows, it prints out the entire detail listing; not the selected rows. Please advise on the best approach to accomplish this task. Thanks.
The goal is to get data (from half a thousand to 3-4 thousands lines) from DB, calculate standart deviation then use it as logical condition in analyzer.
For example IF std > custom_value = show_the_result ELSE null
There is a STDDEV(MDX) method used in Analyzer but it is a measure and it can not be used as logical condition (correct me if i am wrong)
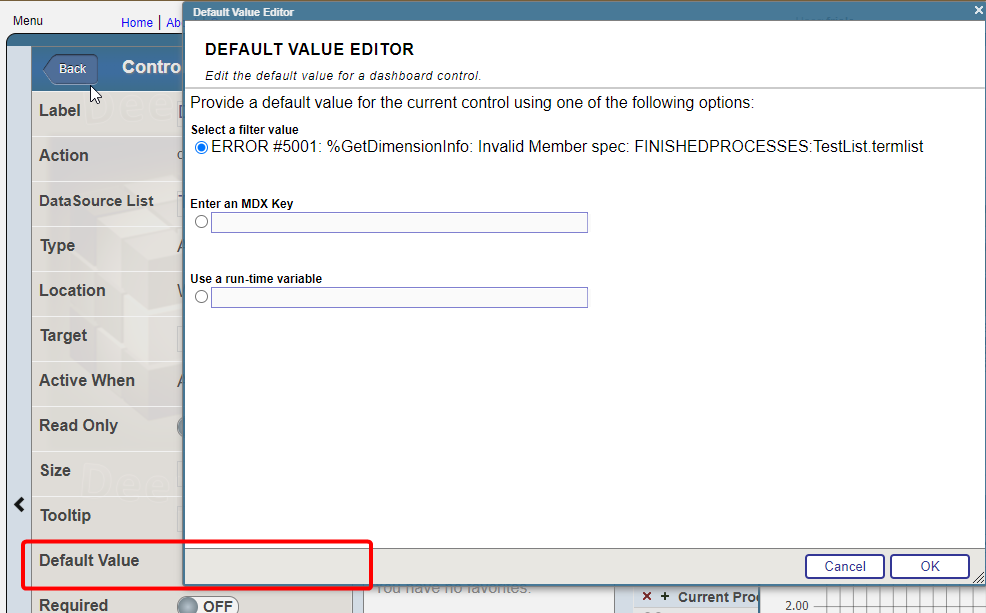
I have a widget that uses "choose Data source" control option. Termlist for the control consist of the two data sources and i want to set one of them by default. For example: I have two data sources, one is grouped by month, the other by year. I need to set the one that is grouped by year by default
 By views
.png)
.png)