Hi colleagues!

Yet another time I figured that there is no super-simple way to display error from %Status variable, but I need it relatively often in a terminal.

Yes, I know about $$$ Macro, but they are not superhelpful in a terminal.

My usual behavior is to try to remember by heart or copy from somewhere the formula:

USER>w $System.Status.DisplayError(st)

3 15
1 186

InterSystems technologies are renowned for their high performing databases, which support the systems and operations of many organisations. However a key ingredient to this success is the quality and maintainability of their code.

The quality of code can impact everything from speed and ease of fixing bugs and making enhancements, to the overall performance of your organization and your ability to get ahead in the marketplace.

By ensuring your code is maintainable, you can reduce approximately 75% of the systems life cycle costs*. This is why, at George James Software, the solutions we build are always straightforward and written in high quality code - because we know that this solid foundation can positively impact the rest of your organization.

With a maintainable system you're able to reduce your overall maintenance as any issues that occur are significantly faster to identify and fix. This means you're free to allocate that time and budget to enhancements, enabling you to get the most value out of your applications and ultimately better support your organization.

Keep an eye out for our next few posts about what a maintainable system looks like and the tools that can help you keep your code maintainable, in order to help you to reduce those maintenance costs.

3 1
1 436

Every developer has made the mistake of accidentally leaving temporary debug code in place when they meant to remove it after debugging is complete. The great thing about writing in ObjectScript is that there is a way to make temporary code be truly temporary and automatically self-destruct! This can also be done in such a way that the code has no change of making it into your source control stream, which can be helpful as well.

3 1
0 445
Article
· Jun 18, 2020 1m read
Debugging Business Operations

Often we need to debug a Business Operation. Tracing and logging work but sometimes you want to work with a BO as with your local terminal session.

Here's how you can do that on any operating system.

Windows has a great tool for debugging Business Operations - Foreground mode. In that mode Windows launches a local terminal with operation job.

2 0
2 578

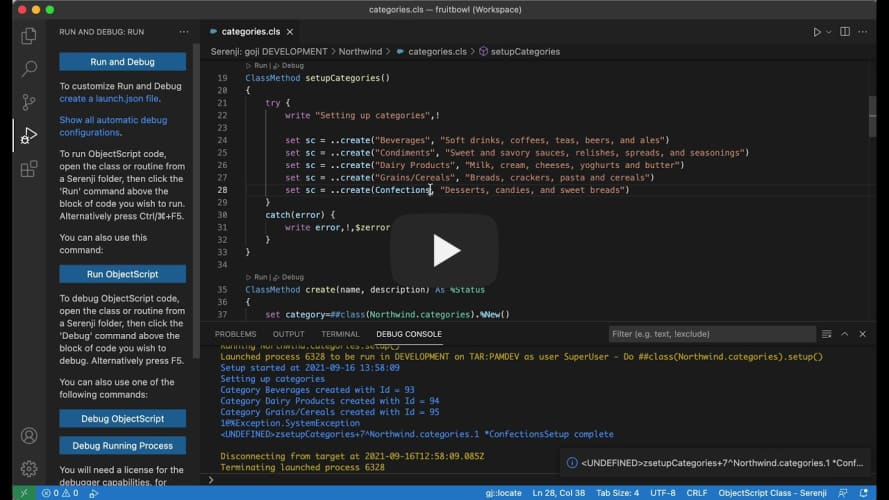
The most recent release of Serenji features our innovative gj::locate technology. It was a standalone tool we originally created for a Developer Community contest earlier this year, but we've incorporated it into our debugger after some great feedback from developers. 

It works by navigating you directly to the source of your server-side errors in just a couple of clicks - enabling you to quickly fix errors without the need to count tedious lines of code... and let's be real, who has got time for that when you're under pressure to fix this bug? 

It's simple and straightforward to use:

1. Click on the gj::locate panel in the status bar

2. Enter the ObjectScript error message or line reference from a class/.mac routine..

3. gj::locate then does the work for you by taking you straight to the corresponding line in your source code.

Easy peasy... and with time to spare to make yourself a coffee before your deadline! 

The video below shows it in action - let us know if you've already given it a go. Or, if you're interested in trying it out we offer a free 30 day trial license, just drop me a message through the Developer Community or email us at info@georgejames.com.

Serenji 3.2.0 utilising gj::locate technology

2 0
0 213

Hi developers, 

Serenji 3.2.0, the latest version from George James Software, was released last week and our current users have been enjoying trying out the new features (which you can find more about here). 

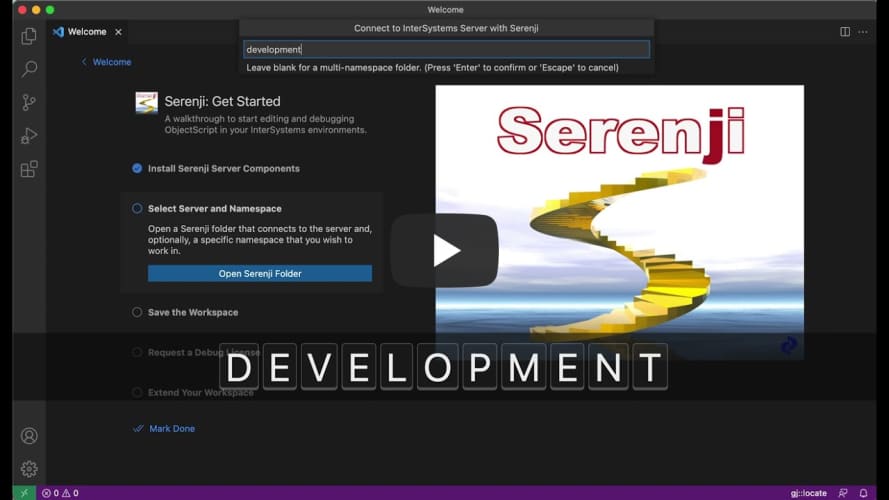
If you're thinking about trying Serenji for the first time, we've made it easier to get set up by adding a walkthrough on the VS Code Welcome page. It takes you through: 

  • Setting up the server components.
  • Selecting a server namespace.
  • Saving and extending your workspace.
  • Requesting a debug license (don't forget we offer a free 30 day trial!) 

We've also added prompts and guidance throughout VS Code to open and add Serenji folders to your workspace and when going to run and debug code. 

This is just one of the ways we've enhanced the Serenji debugger to make straightforward and easy to use - so all you need to do is focus on your code. 

Serenji 3.2.0 Welcome Page Walkthrough

1 0
0 214

The latest release of Serenji focuses on the debug experience. Not only can you now debug on the spot, no matter where you are or what you're doing, but we've also added some smaller features that will make debugging more straightforward. 

  • Run and Debug CodeLenses - clickable links above each class method, procedure, subroutine or extrinsic function.
  • Intuitive prompting for entrypoints and arguments - when debugging a class method, produce, subroutine or extrinsic function. 
  • Shaded read-only background - to clearly differentiate between documents which are editable and those that are read-only. 
  • Program output in debug console - output is shown in the debug console. 
  • Serenji commands on Server Manager's namespace trees - allowing you to launch Serenji through Server Manager. 

Find out more in our release notes here

1 0
1 264
Article
· Jun 13, 2016 1m read
Debug: using locks for breakpoints

Hi, Community!

Want to share with you one debugging approach from the Russian forum.

Suppose I want to debug the application and I want it to stop the execution on a particular line.

I add in code this line:

l +d,-d

When I want to start debugging in this line I block d in terminal

USER> l +d

And execute the app.

The app stops on this line and lets me connect to it with Studio debugger.

0 8
1 681

Hi developers, 

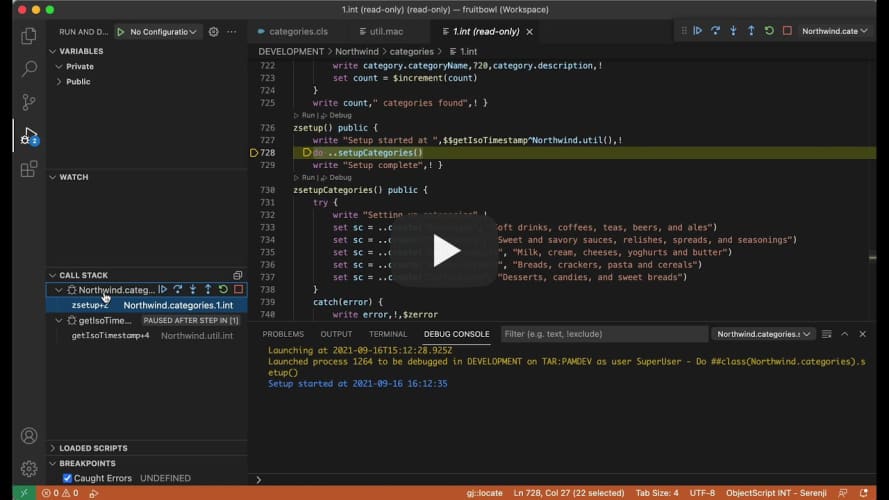
We've incorporated VS Code's support for multiple concurrent debug sessions and consoles into the latest release of Serenji

So if you're working with processes that relate or are dependent on each other, you can now debug them together. Just launch a second Serenji debug session (F5) whilst the first one is still active. 

This short video below shows how it works. We hope you find this feature useful! 

Laurel 

Serenji 3.2 multiple concurrent debug sessions

0 0
0 201

We're hosting our Deltanji and Serenji user group session tomorrow - there's still time to register, if you haven't already.

We'll be showcasing some advanced features of Deltanji and Serenji in VS Code with time for a discussion - so feel free to bring along any problems you need help solving or share your feedback on our tools. We'd love to hear your thoughts. If you're interested in our tools this is a great chance to hear what others have to say, as well as asking your own questions.

Date: Wednesday, November 3rd

Time: 11-12pm EDT / 3-4pm GMT.

Let us know you'll be attending on Eventbrite.

We hope to see you tomorrow, but if you're unable to make it you can email me at laurelj@georgejames.com and I can share a recording of the session.

0 0
0 164