Apache Superset is a modern data exploration and data visualization platform. Superset can replace or augment proprietary business intelligence tools for many teams. Superset integrates well with a variety of data sources.
And now it is possible to use with InterSystems IRIS as well.
An online demo is available and it uses IRIS Cloud SQL as a data source.
.png)
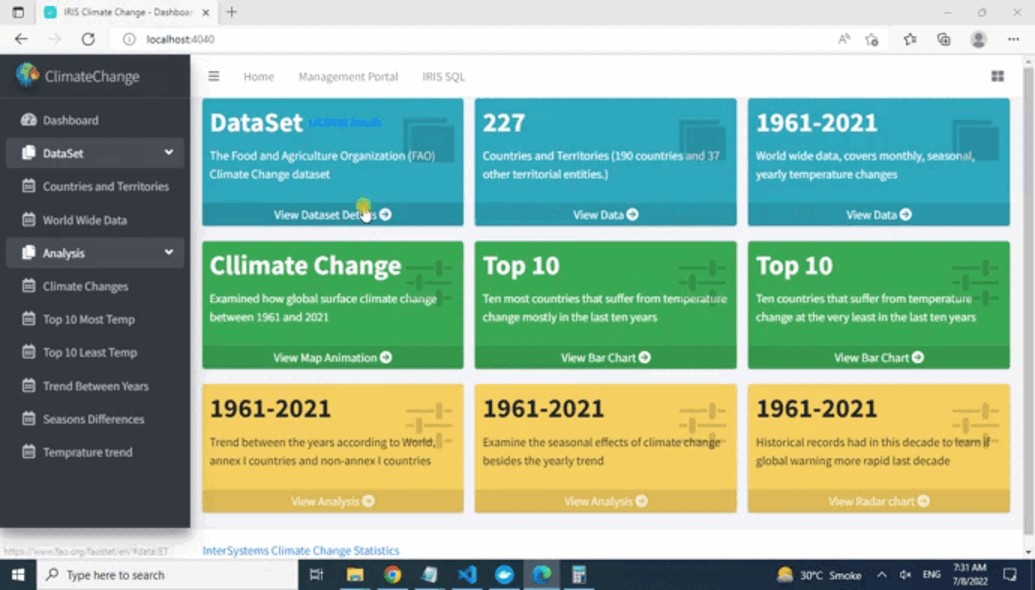
Apache Superset provides a bunch of examples, which were successfully loaded to IRIS without any issues, and displayed on example dashboards.
 Hello!
.png)
.png)

.png)
.png)
