Article Nikita Savchenko · Jan 5, 2019 6m read Explore Text Data with InterSystems iKnow Entity Browser #Analytics #API #Frontend #Graph #Open Source #Visualization #InterSystems Natural Language Processing (NLP, iKnow) #InterSystems IRIS #Open Exchange 8 6 3 1.3K
Article Rob Tweed · Sep 5, 2016 1m read Ranking of Graph Databases and GlobalsDB Interesting to see this latest ranking come to my attention:http://db-engines.com/en/ranking/graph+dbmsLook what's ranked 16th. Shame a decision was made to deprecate it #Graph #Caché 2 5 0 729
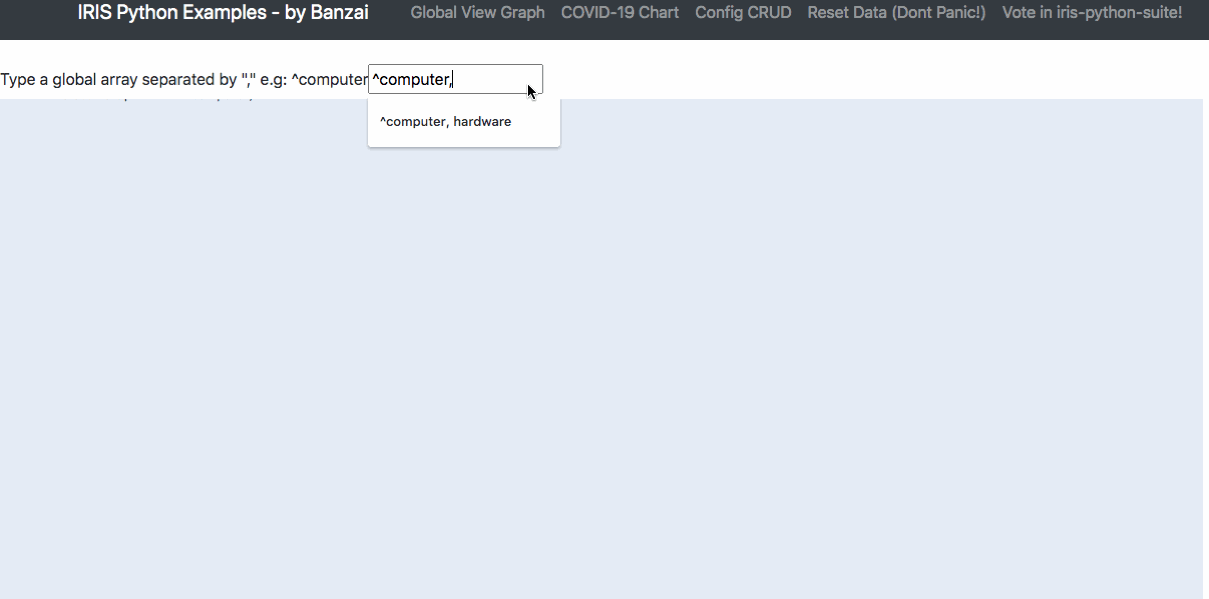
Article Renato Banzai · Jun 2, 2020 4m read Using Python to Represent Globals in a Network Chart Globals as a Graph Data Structure in Python How to use the IRIS Native API + Python to see globals as a Graph Network Chart. Iris Globals Reading the documentation these topics are related to globals: #Globals #Graph #Python #InterSystems IRIS #InterSystems IRIS for Health Open Exchange app 6 4 1 522
Article Dmitry Pavlov · Jan 20, 2017 7m read Ontodia + Caché — ontology visualizer for navigation through stored instances of InterSystems Caché About the Ontodia library #Frontend #Graph #Tools #Visualization #Caché 4 3 0 1K
Article Athanassios Hatzis · Feb 16, 2017 4m read How Intersystems Caché fits in the Graph Database Arena ! Hi, #Databases #Data Model #Graph #JSON #Caché 3 1 1 1.3K
Article Ariel Glikman · Jun 3, 2024 7m read Monitor Database Growth - Part 2: Graphical Interface Graphical Display of Tables Here we will document how you can get the results of your Data Collection to be displayed graphically. The output of your project will look like this: Note that I am working on a local machine. If you are doing this on a server then be aware to use the correct IP address. #Databases #Graph #React #InterSystems IRIS #InterSystems IRIS for Health Open Exchange app 4 0 1 182
 By replies
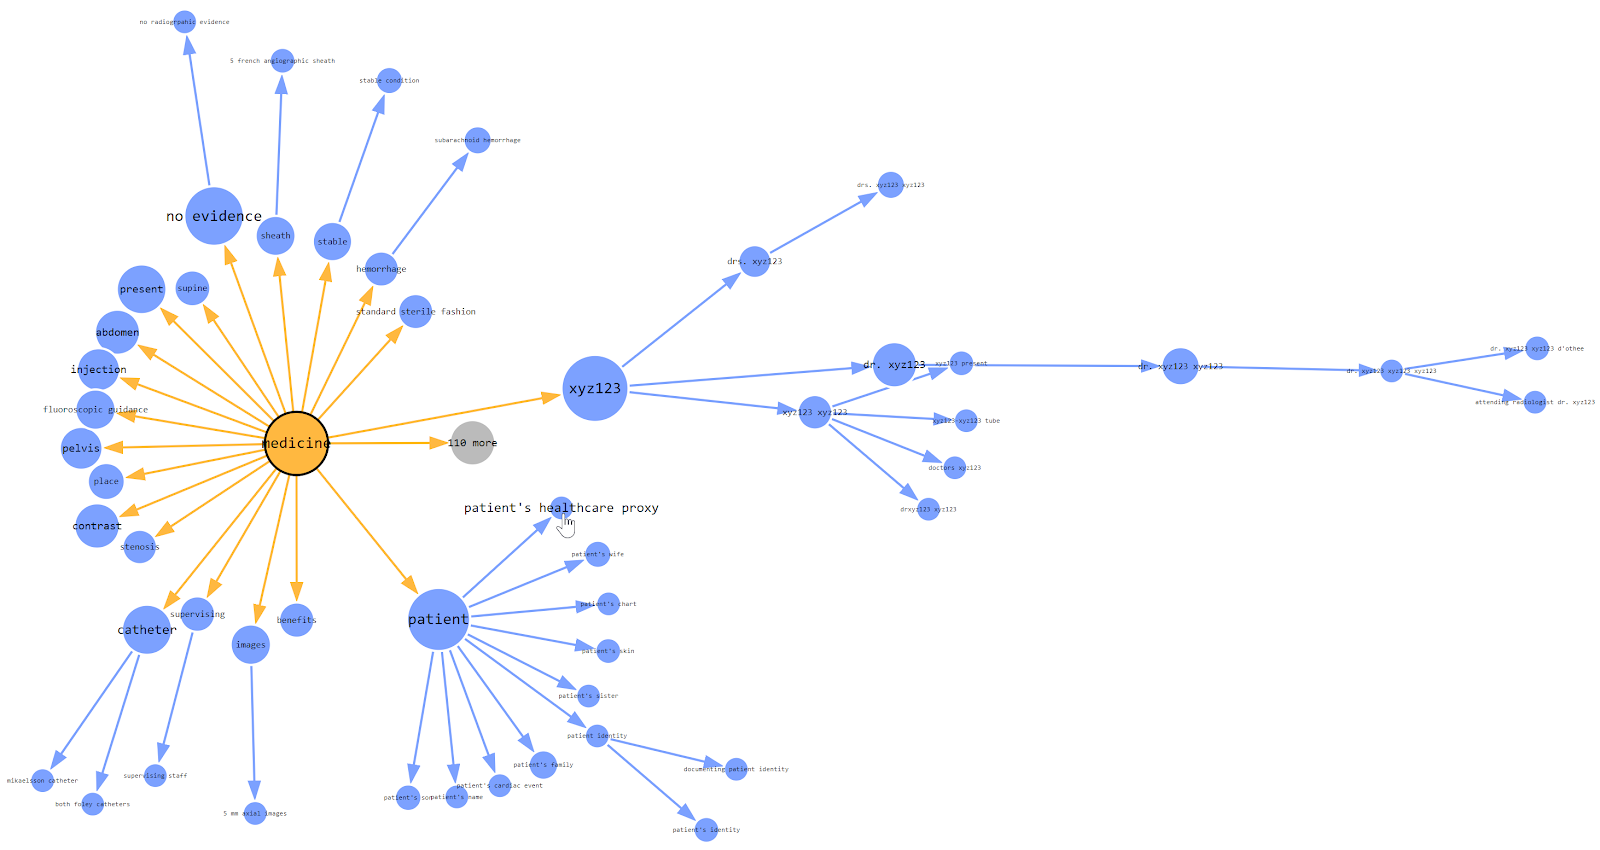

 Open Exchange app