Ontodia + Caché — ontology visualizer for navigation through stored instances of InterSystems Caché
About the Ontodia library
First of all, I think we should provide some background information about Ontodia and Caché DBMS. Let’s start with a less known product, Ontodia. Ontodia is the result of a joint project of the ISST lab of the ITMO University and VISmart, a software development company specializing in the semantic web domain. The Ontodia service was created as a web application for visualizing linked data and ontologies. We created this service because we couldn’t find simple, accessible and efficient tools for convenient visualization of linked data.
A typical use case for Ontodiа could be described as a sequence of 3 steps:
- The user provides a set of data for visualization: RDF or OWL file, or enters access parameters for the data endpoint.
- The user navigates the data and builds the desired diagram.
- The user saves the diagram, shares it with colleagues, publishes it with a permanent link or embeds the diagram into a webpage.

Ontodia is up and running 24/7 at www.ontodia.org.
An overview of its basic capabilities in the screencast format can be found here.
As time went by and we collected some feedback, we came to realize that there was huge demand for graph-based visualization of data stored in relational and object databases. The Russian office of Intersystems company was very prominent in expressing interest in Ontodia.
The service started to grow and gain new features, eventually going beyond semantic data. First and foremost, we added the support of object DBMS’s (Caché DBMS is essentially an object database) via a proprietary REST API used for receiving data.
The next big step was the porting of the Ontodia service into a standalone JavaScript library. The code of the library is currently published on <github>. All server-side functions, such as access control, user management, data storage and such, are now performed by platforms that use Ontodia as a library. In this particular case, InterSystems Caché became such a platform.
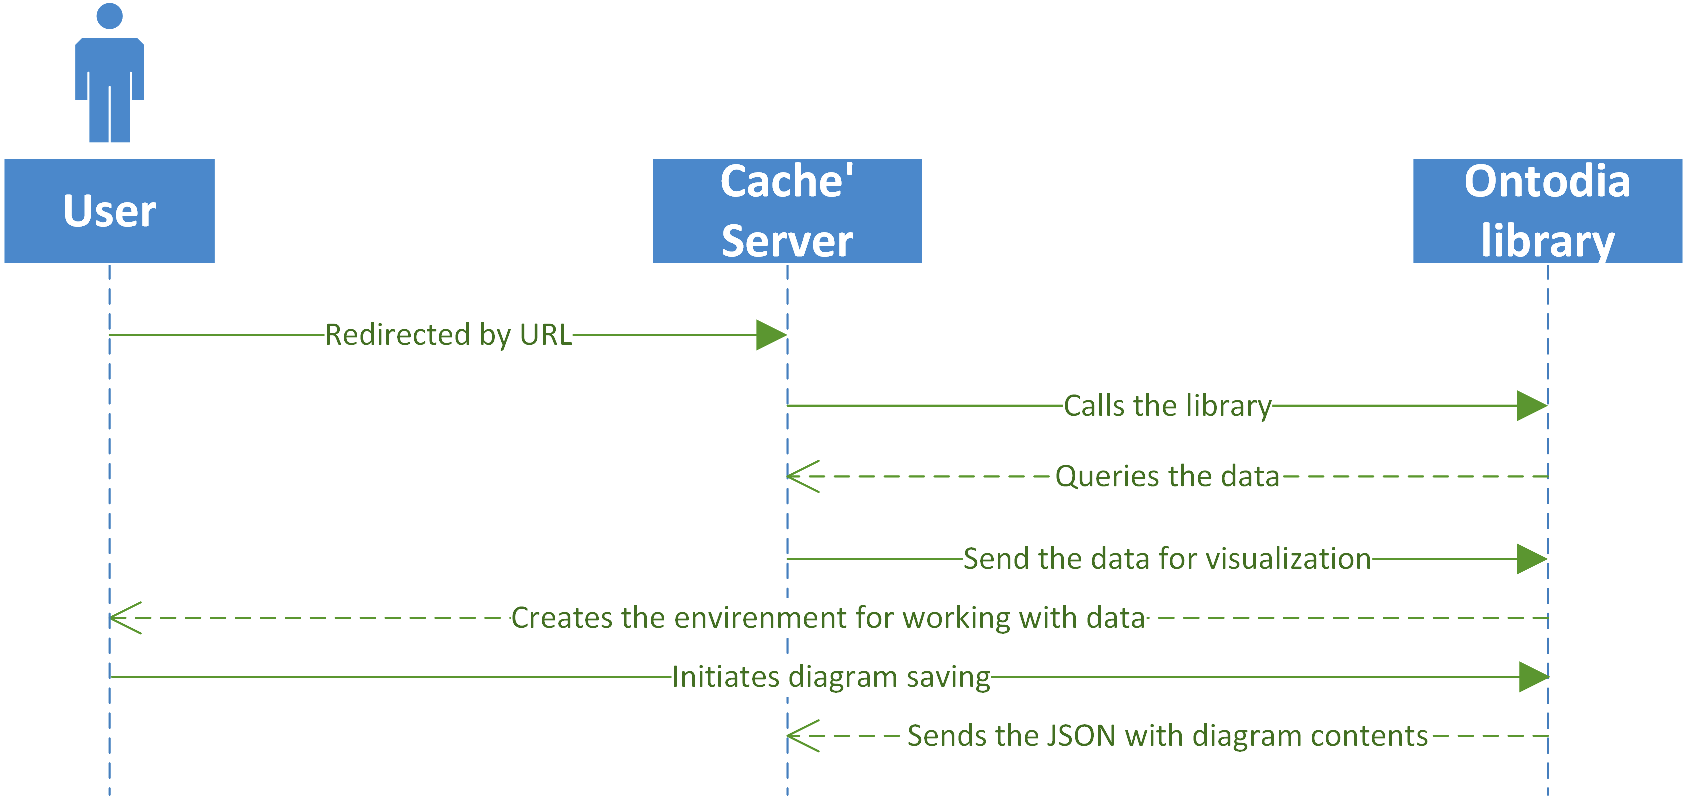
Creation of a standalone library made it possible to implement simplified integration with platforms. The scenario of interaction between a platform, such as Caché DBMS, and the library is now as follows:
- When a user sends a request to a particular URL, the Caché DBMS server invokes the library code
- The library requests the necessary set of data (to be shown on a graph) from Caché DBMS. The server replies with requested data.
- Ontodia restores the data scheme in graph terms (connections, vertices, connection and vertex properties)
- The user initiates graph saving and Ontodia sends a JSON to the server for saving and storing the graph
About InterSystems Caché
We should now say a few words about the system that made Ontodia its standard part. If you look broadly at it, then InterSystems Caché is a database management system, but if you step back and look at it from an even broader angle, you’ll find out that it’s a platform for developing data processing applications. It is also assumed that Caché is a multi-model DBMS, which means that it offers a number of different ways to store, display and provide access to data based on corresponding representations.
In essence, Ontodia is yet another method of representing data in Caché, which allows the user to better understand the structure of data organization in terms of stored classes and connections between them (including ranks and connection semantics), as well as to visualize the properties of stored class instances, their connections with other instances in the database, and, finally, to navigate instances in the database.
Ontodia’s capabilities relevant to Caché
Ontodia can display the following data elements on an interactive graph:
- Classes and their properties;
- Instances and their properties;
- Connections between classes;
- Connections between classes and instances;
- Connections between instances.
Graph rendering features
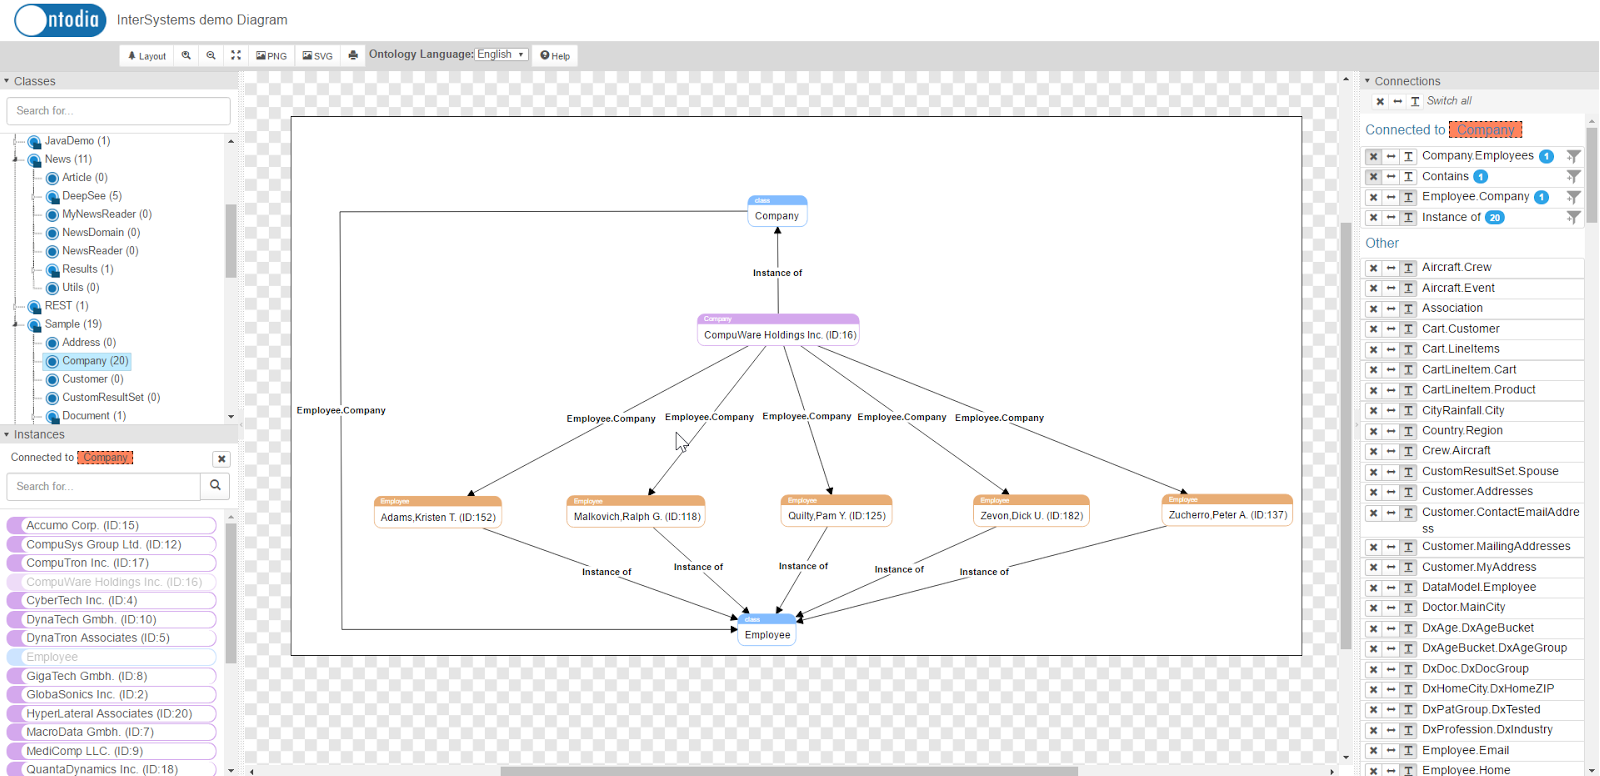
Each vertex of the graph is displayed as a rectangle with rounded corners. Inside each rectangle is a label with the name of the object, and a small text on a colored bar specifying the class of the object. The bar above helps distinguish classes by color.
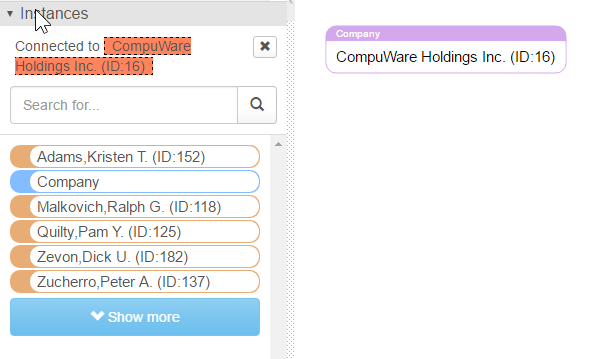
A single click on a graph vertex places the focus on this vertex and displays all related objects on the Instances panel.
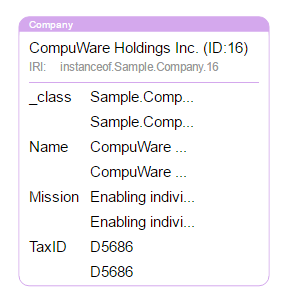
A double-click on a vertex helps unfold a list of object properties.
Connections are rendered as lines with arrows corresponding to their direction and their names shown above.
After this brief familiarization with Ontodia’s visual language, it’s time to show how data from Caché is displayed and how Ontodia helps interact with graphs.
User interaction with graph
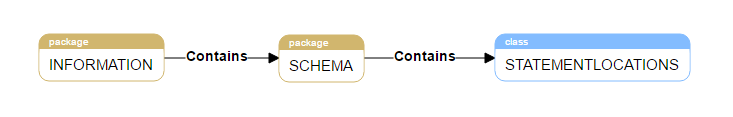
- At the start, Ontodia displays a tree of classes of the received data set on the Class tree panel (see illustration) and allows you to drag classes into the graph’s workspace (in the middle). It allows you to search the class tree and filter results on the go as characters are typed in.
- The user can view all instances of any class. Instances are filtered on the Instances tab by clicking on any class in the tree. If the number of results is too high, you can use simple string search to find what you need.
- The user can also drag one or several instances from the Instances panel to the graph’s workspace.
- Users can manage the display of connections by going to the Connections panel and selecting the types of connections to be shown on the graph. You can also enable or disable connection labels. This feature lets you control the “saturation” of the graph with elements and connections.
- Users can remove any vertices and connections, thus forming the resulting set of data to be displayed.
- The user can move vertices and connections across the work area to achieve the most visually efficient placement of elements.
- The user can zoom in and out from the graph, move the graph within the boundaries of the workspace and fit the graph size to that of the screen.
- Double-clicking any vertex will open a list of object properties.
Below is an example of a graph that took around 30 seconds to create.
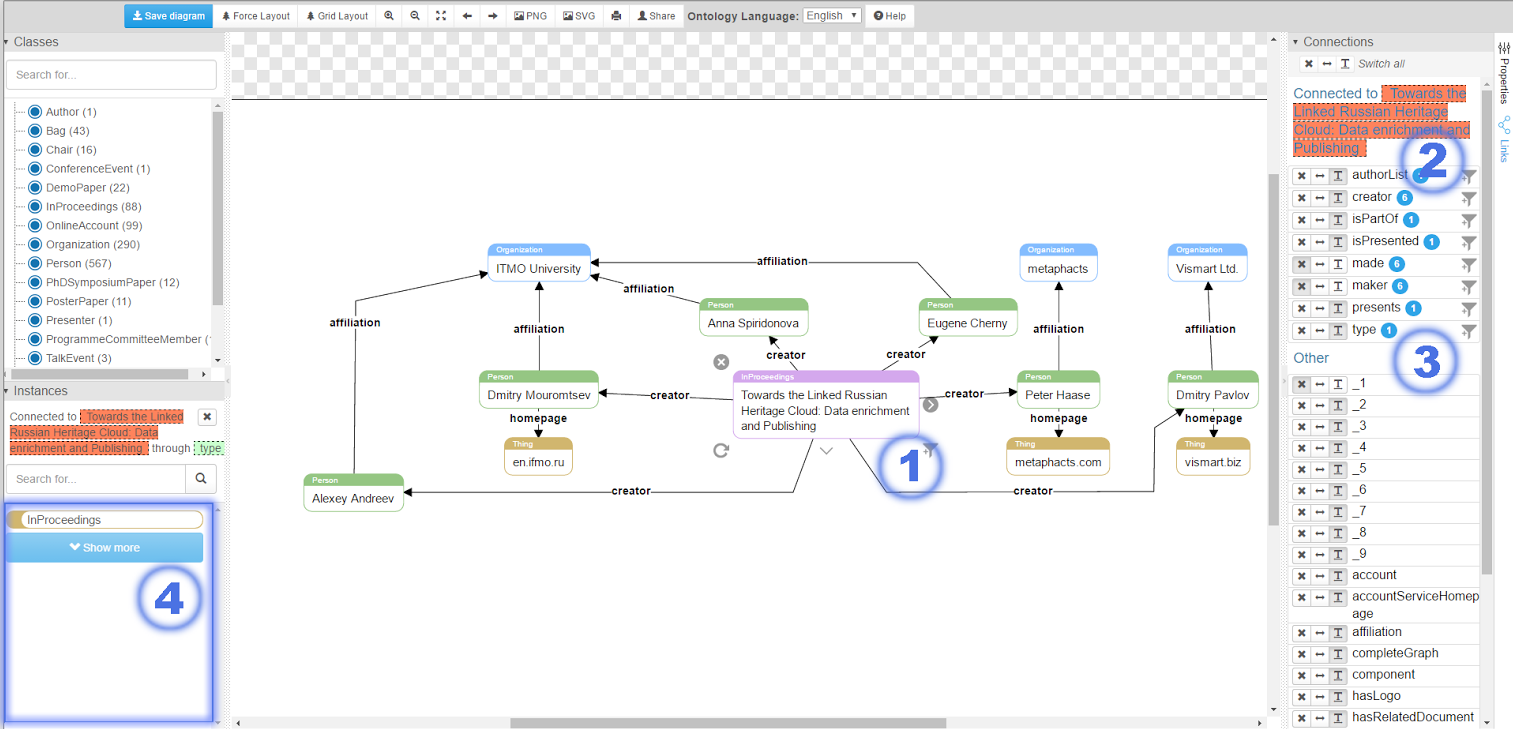
Navigation capabilities
Not only does Ontodia allow you to create any number of data views (diagrams), but also allows you to analyze data by looking at its visual representation:
- Click any graph vertex and get a list of all directly connected objects on the Instances panel. After that, users can drag the objects, thus plotting the trajectory of their navigation through the data.
- Get all connections forming the selected vertex on the graph. Connections will be listed in the top part of the Connections panel. The number of objects on the other side of the connection will be shown to the right of each identified connection on the Connections panel. By clicking the filter icon next to the necessary connection, the user will populate the corresponding area of the Instances panel with objects that are connected to the object selected on the graph.
How to see a demo and get more information:
Link to a demo.
Link to an Ontodia screencast.
The projects repository is publicly accessible here.
How to install
To install the latest version of the library capable of working with Caché via a Rest API, you need to import the OntodiaCache package. To do this, download the archive here, then import the OntodiaCache.xml file (it will be in ontodia-cache-release.zip archive) to Caché Studio (tutorial). As a result, you will get all the necessary resources, and compilation will produce a new web application.
How to start
After installation, go to the Caché server at [server URL]/csp/ontodia-cache/index.html.
In order to specify which particular namespace to use for data visualization, add a “namespace” parameter for the necessary value to the address line.
Example: localhost:57772/csp/ontodia-cache/index.html?namespace=Samples
Building a new version of OntodiaCache.xml
To build a project, you will need NodeJS to be installed. If you have it, clone the source code of the repository and run the npm install command in the root folder of the project. This will install all the necessary modules via NPM.
Once done, you will need to install the old version of the OntodiaCache.xml file — see the “How to install” section above.
Starting from this moment, you will need to execute the npm run webpack command in the root folder to build the project. Running this command will create the necessary source code that must be moved to the InterSystems Caché Studio server folder ({Server folder}\Cache\CSP\{namespace}
Example: C:\InterSystems\Cache\CSP\ontodia-cache) – can be used for developing a new version of the library.
To complete the process, go to InterSystems Caché Studio, click the root element of the Workspace panel and select the “export to xml” command from the context menu, then specify the destination folder for the new version of the .xml file.
What’s next
We plan to extend the functionality of the library, and specifically do the following:
- Create configurable templates for displaying instances of particular classes (we’d like to, for example, allow users to show an instance of the “person” class as a photo with a name, last name and contact details)
- Implement a possibility to edit data right on the graph
- Implement the support of popular notations: UML, IDEF, Archimate, etc.
It is clear that creating a new version with the listed features will take a lot of time. We don’t want to wait for too long and will appreciate any help or contributions that will help make Ontodia better and more functional.
Feedback
The latest news about the project is available in our blog.
Contact us by email.
Comments
I haven't read the article yet but, just to let you know, the first two images are missing.
I've relocated this two images from google drive storage to another one (to the same as for others pictures in this article), hope it helps.
Images are fine for me.
Looks like they are hosted on a google drive, perhaps your behind an http proxy that blocks that domain?