Grafana-based GUI for mgstat, a system monitoring tool for InterSystems Caché, Ensemble or HealthShare
Hello! This article continues the article "Making Prometheus Monitoring for InterSystems Caché". We will take a look at one way of visualizing the results of the work of the ^mgstat tool. This tool provides the statistics of Caché performance, and specifically the number of calls for globals and routines (local and over ECP), the length of the write daemon’s queue, the number of blocks saved to the disk and read from it, amount of ECP traffic and more. ^mgstat can be launched separately (interactively or by a job), and in parallel with another performance measurement tool, ^pButtons.
I’d like to break the narrative into two parts: the first part will graphically demonstrate the statistics collected by ^mgstat, the second one will concentrate on how exactly these stats are collected. In short, we are using $zu-functions. However, there is an object interface for the majority of collected parameters accessible via the classes of the of the SYS.Stats package. Just a fraction of the parameters that you can collect are shown in ^mgstat. Later on, we will try to show all of them on Grafana dashboards. This time, we will only work with the ones provided by ^mgstat. Apart from this, we’ll take a bite of Docker containers to see what they are.
Installing Docker
The first part is about installing Prometheus and Grafana from tarballs. We will now show how to launch a monitoring server using Docker’s capabilities. This is the demo host machine:
4.8.16-200.fc24.x86_64
# cat /etc/fedora-release
Fedora release 24 (Twenty Four)
Two more virtual machines will be used (192.168.42.131 and 192.168.42.132) in the VMWare Workstation Pro 12.0 environment, both with Caché on board. These are the machines we will be monitoring. Versions:
3.10.0-327.el7.x86_64
# cat /etc/redhat-release
Red Hat Enterprise Linux Server release 7.2 (Maipo)
…
USER>write $zversion
Cache for UNIX (Red Hat Enterprise Linux for x86-64) 2016.2 (Build 721U) Wed Aug 17 2016 20:19:48 EDT
Let’s install Docker on the host machine and launch it:
# systemctl start docker
# systemctl status docker
● docker.service — Docker Application Container Engine
Loaded: loaded (/usr/lib/systemd/system/docker.service; disabled; vendor preset: disabled)
Active: active (running) since Wed 2017-06-21 15:08:28 EEST; 3 days ago
...
Launching Prometheus in a Docker container
Let’s load the last Prometheus image:
If we look at the Docker file, we will see that the image reads the configuration from its /etc/prometheus/prometheus.yml file, and collected statistics are saved to the /prometheus folder:
CMD [ "-config.file=/etc/prometheus/prometheus.yml", \
"-storage.local.path=/prometheus", \
...
When starting Prometheus in a Docker container, let’s make it load the configuration file and the metrics database from the host machine. This will help us “survive” the restart of the container. Let’s now create folders for Prometheus on the host machine:
Let’s create a Prometheus configuration file:
global:
scrape_interval: 10s
scrape_configs:
- job_name: 'isc_cache'
metrics_path: '/mgstat/5' # Tail 5 (sec) it's a diff time for ^mgstat. Should be less than scrape interval.
static_configs:
- targets: ['192.168.42.131:57772','192.168.42.132:57772']
basic_auth:
username: 'PromUser'
password: 'Secret'
We can now launch a container with Prometheus:
--hostname prometheus -p 9090:9090 \
-v /opt/prometheus/etc/prometheus.yml:/etc/prometheus/prometheus.yml \
-v /opt/prometheus/data/:/prometheus \
docker.io/prom/prometheus
Check if it launched fine:
d3a1db5dec1a: "/bin/prometheus -con" Up 5 minutes prometheus
Launching Grafana in a Docker container
First, let’s download the most recent image:
We’ll then launch it, specifying that the Grafana database (SQLite by default) will be stored on the host machine. We’ll also make a link to the container with Prometheus, so that we can then link to it from the one containing Grafana:
# docker run -d --name grafana \
--hostname grafana -p 3000:3000 \
--link prometheus \
-v /opt/grafana/db:/var/lib/grafana \
docker.io/grafana/grafana
# docker ps --format "{{.ID}}: {{.Command}} {{.Status}} {{.Names}}"
fe6941ce3d15: "/run.sh" Up 3 seconds grafana
d3a1db5dec1a: "/bin/prometheus -con" Up 14 minutes prometheus
Using Docker-compose
Both our containers are launched separately. A more convenient method of launching several containers at once is the use of Docker-compose. Let’s install it and suspend the current two containers, then reconfigure their restart via Docker-compose and launch them again.
The same in the cli language:
# docker stop $(docker ps -a -q)
# docker rm $(docker ps -a -q)
# mkdir /opt/docker-compose
# cat /opt/docker-compose/docker-compose.yml
version: '2'
services:
prometheus:
image: docker.io/prom/prometheus
container_name: prometheus
hostname: prometheus
ports:
- 9090:9090
volumes:
- /opt/prometheus/etc/prometheus.yml:/etc/prometheus/prometheus.yml
- /opt/prometheus/data/:/prometheus
grafana:
image: docker.io/grafana/grafana
container_name: grafana
hostname: grafana
ports:
- 3000:3000
volumes:
- /opt/grafana/db:/var/lib/grafana
# docker-compose -f /opt/docker-compose/docker-compose.yml up -d
# # Both containers can be disabled and removed with the following command:
# # docker-compose -f /opt/docker-compose/docker-compose.yml down
# docker ps --format "{{.ID}}: {{.Command}} {{.Status}} {{.Names}}"
620e3cb4a5c3: "/run.sh" Up 11 seconds grafana
e63416e6c247: "/bin/prometheus -con" Up 12 seconds prometheus
Post-installation procedures
After starting Grafana for the first time, you need to do two more things: change the admin password for the web interface (by default, the login/password combination is admin/admin) and add Prometheus as a data source. This can be done either from the web interface or by directly editing the Grafana SQLite database (located by default at /opt/grafana/db/grafana.db), or using REST requests.
Let me show the third option:
-H "Content-Type:application/json" \
-d '{"oldPassword":"admin","newPassword":"TopSecret","confirmNew":"TopSecret"}'
If the password has been changed successfully, you will get the following response:
{"message":"User password changed"}
Response of the following type:
curl: (56) Recv failure: Connection reset by peer
means that the Grafana server hasn’t started yet and we just need to wait a little longer before running the previous command again. You can wait like this, for example:
# until curl -sf admin:admin@localhost:3000 > /dev/null; do sleep 1; echo "Grafana is not started yet";done; echo "Grafana is started"
Once you’ve successfully changed the password, add a Prometheus data source:
# curl -XPOST "admin:TopSecret@localhost:3000/api/datasources" \
-H "Content-Type:application/json" \
-d '{"name":"Prometheus","type":"prometheus","url":"http://prometheus:9090","access":"proxy"}'
If the data source has been added successfully, you will get a response:
{"id":1,"message":"Datasource added","name":"Prometheus"}
Creating an equivalent of ^mgstat
^mgstat saves output to a file and the terminal in an interactive mode. We don’t care about output to a file. This is why we are going to use the Studio to create and compile a class called my.Metrics containing some an object-oriented implementation of ^mgstat in the USER space.
/// This class is an object-oriented implementation of ^mgstat routine.
/// Unlike the last the Caché version check is skipped.
/// If you want to monitor seizes you should set parameter ISSEIZEGATHERED = 1.
/// Unlike ^mgstat routine Seizes metrics show as diff (not as percentage).
/// Some of $zutil functions are unknown for me, but they are used in ^mgstat so they're leaved here.
Class my.Metrics Extends %RegisteredObject
{
/// Metrics prefix
Parameter PREFIX = "isc_cache_mgstat_";
/// Metrics for Prometheus must be divided by 'new line'
Parameter NL As COSEXPRESSION = "$c(10)";
/// Unknown parameter -). Used as in ^mgstat.int
Parameter MAXVALUE = 1000000000;
/// 2**64 - 10. Why minus 10? It's a question -) Used as in ^mgstat.int
Parameter MAXVALGLO = 18446744073709551610;
/// Resources that we are interested to monitor. You can change this list
Parameter SEIZENAMES = "Global,ObjClass,Per-BDB";
/// Default value - $zutil(69,74). You can start gather seize statistics it by setting "1"
Parameter ISSEIZEGATHERED = 0;
Parameter MAXECPCONN As COSEXPRESSION = "$system.ECP.MaxClientConnections()";
/// Number of global buffers types (8K, 16K etc.)
Parameter NUMBUFF As COSEXPRESSION = "$zutil(190, 2)";
/// Memory offset (for what? -))
Parameter WDWCHECK As COSEXPRESSION = "$zutil(40, 2, 146)";
/// Memory offset for write daemon phase
Parameter WDPHASEOFFSET As COSEXPRESSION = "$zutil(40, 2, 145)";
/// Memory offset for journals
Parameter JOURNALBASE As COSEXPRESSION = "$zutil(40, 2, 94)";
ClassMethod getSamples(delay As %Integer = 2) As %Status
{
set sc = $$$OK
try {
set sc = ..gather(.oldValues)
hang delay
set sc = ..gather(.newValues)
set sc = ..diff(delay, .oldValues, .newValues, .displayValues)
set sc = ..output(.displayValues)
} catch e {
write "Error: "_e.Name_"_"_e.Location, ..#NL
}
quit sc
}
ClassMethod gather(Output values) As %Status
{
set sc = $$$OK
// Get statistics for globals
set sc = ..getGlobalStat(.values)
// Get write daemon statistics
set sc = ..getWDStat(.values)
// Get journal writes
set values("journal_writes") = ..getJournalWrites()
// Get seizes statistics
set sc = ..getSeizeStat(.values)
// Get ECP statistics
set sc = ..getECPStat(.values)
quit sc
}
ClassMethod diff(delay As %Integer = 2, ByRef oldValues, ByRef newValues, Output displayValues) As %Status
{
set sc = $$$OK
// Process metrics for globals
set sc = ..loopGlobal("global", .oldValues, .newValues, delay, 1, .displayValues)
set displayValues("read_ratio") = $select(
displayValues("physical_reads") = 0: 0,
1: $number(displayValues("logical_block_requests") / displayValues("physical_reads"),2)
)
set displayValues("global_remote_ratio") = $select(
displayValues("remote_global_refs") = 0: 0,
1: $number(displayValues("global_refs") / displayValues("remote_global_refs"),2)
)
// Process metrics for write daemon (not per second)
set sc = ..loopGlobal("wd", .oldValues, .newValues, delay, 0, .displayValues)
// Process journal writes
set displayValues("journal_writes") = ..getDiff(oldValues("journal_writes"), newValues("journal_writes"), delay)
// Process seize metrics
set sc = ..loopGlobal("seize", .oldValues, .newValues, delay, 1, .displayValues)
// Process ECP client metrics
set sc = ..loopGlobal("ecp", .oldValues, .newValues, delay, 1, .displayValues)
set displayValues("act_ecp") = newValues("act_ecp")
quit sc
}
ClassMethod getDiff(oldValue As %Integer, newValue As %Integer, delay As %Integer = 2) As %Integer
{
if (newValue < oldValue) {
set diff = (..#MAXVALGLO - oldValue + newValue) \ delay
if (diff > ..#MAXVALUE) set diff = newValue \ delay
} else {
set diff = (newValue - oldValue) \ delay
}
quit diff
}
ClassMethod loopGlobal(subscript As %String, ByRef oldValues, ByRef newValues, delay As %Integer = 2, perSecond As %Boolean = 1, Output displayValues) As %Status
{
set sc = $$$OK
set i = ""
for {
set i = $order(newValues(subscript, i))
quit:(i = "")
if (perSecond = 1) {
set displayValues(i) = ..getDiff(oldValues(subscript, i), newValues(subscript, i), delay)
} else {
set displayValues(i) = newValues(subscript, i)
}
}
quit sc
}
ClassMethod output(ByRef displayValues) As %Status
{
set sc = $$$OK
set i = ""
for {
set i = $order(displayValues(i))
quit:(i = "")
write ..#PREFIX_i," ", displayValues(i),..#NL
}
write ..#NL
quit sc
}
ClassMethod getGlobalStat(ByRef values) As %Status
{
set sc = $$$OK
set gloStatDesc = "routine_refs,remote_routine_refs,routine_loads_and_saves,"_
"remote_routine_loads_and_saves,global_refs,remote_global_refs,"_
"logical_block_requests,physical_reads,physical_writes,"_
"global_updates,remote_global_updates,routine_commands,"_
"wij_writes,routine_cache_misses,object_cache_hit,"_
"object_cache_miss,object_cache_load,object_references_newed,"_
"object_references_del,process_private_global_refs,process_private_global_updates"
set gloStat = $zutil(190, 6, 1)
for i = 1:1:$length(gloStat, ",") {
set values("global", $piece(gloStatDesc, ",", i)) = $piece(gloStat, ",", i)
}
quit sc
}
ClassMethod getWDStat(ByRef values) As %Status
{
set sc = $$$OK
set tempWdQueue = 0
for b = 1:1:..#NUMBUFF {
set tempWdQueue = tempWdQueue + $piece($zutil(190, 2, b), ",", 10)
}
set wdInfo = $zutil(190, 13)
set wdPass = $piece(wdInfo, ",")
set wdQueueSize = $piece(wdInfo, ",", 2)
set tempWdQueue = tempWdQueue - wdQueueSize
if (tempWdQueue < 0) set tempWdQueue = 0
set misc = $zutil(190, 4)
set ijuLock = $piece(misc, ",", 4)
set ijuCount = $piece(misc, ",", 5)
set wdPhase = 0
if (($view(..#WDWCHECK, -2, 4)) && (..#WDPHASEOFFSET)) {
set wdPhase = $view(..#WDPHASEOFFSET, -2, 4)
}
set wdStatDesc = "write_daemon_queue_size,write_daemon_temp_queue,"_
"write_daemon_pass,write_daemon_phase,iju_lock,iju_count"
set wdStat = wdQueueSize_","_tempWdQueue_","_wdPass_","_wdPhase_","_ijuLock_","_ijuCount
for i = 1:1:$length(wdStat, ",") {
set values("wd", $piece(wdStatDesc, ",", i)) = $piece(wdStat, ",", i)
}
quit sc
}
ClassMethod getJournalWrites() As %String
{
quit $view(..#JOURNALBASE, -2, 4)
}
ClassMethod getSeizeStat(ByRef values) As %Status
{
set sc = $$$OK
set seizeStat = "", seizeStatDescList = ""
set selectedNames = ..#SEIZENAMES
set seizeNumbers = ..getSeizeNumbers(selectedNames) // seize statistics
set isSeizeGatherEnabled = ..#ISSEIZEGATHERED
if (seizeNumbers = "") {
set SeizeCount = 0
} else {
set SeizeCount = isSeizeGatherEnabled * $length(seizeNumbers, ",")
}
for i = 1:1:SeizeCount {
set resource = $piece(seizeNumbers, ",", i)
set resourceName = ..getSeizeLowerCaseName($piece(selectedNames, ",", i))
set resourceStat = $zutil(162, 3, resource)
set seizeStat = seizeStat_$listbuild($piece(resourceStat, ","))
set seizeStat = seizeStat_$listbuild($piece(resourceStat, ",", 2))
set seizeStat = seizeStat_$listbuild($piece(resourceStat, ",", 3))
set seizeStatDescList = seizeStatDescList_$listbuild(
resourceName_"_seizes", resourceName_"_n_seizes", resourceName_"_a_seizes"
)
}
set seizeStatDesc = $listtostring(seizeStatDescList, ",")
set seizeStat = $listtostring(seizeStat, ",")
if (seizeStat '= "") {
for k = 1:1:$length(seizeStat, ",") {
set values("seize", $piece(seizeStatDesc, ",", k)) = $piece(seizeStat, ",", k)
}
}
quit sc
}
ClassMethod getSeizeNumbers(selectedNames As %String) As %String
{
/// USER>write $zu(162,0)
// Pid,Routine,Lock,Global,Dirset,SatMap,Journal,Stat,GfileTab,Misc,LockDev,ObjClass...
set allSeizeNames = $zutil(162,0)_"," //Returns all resources names
set seizeNumbers = ""
for i = 1:1:$length(selectedNames, ",") {
set resourceName = $piece(selectedNames,",",i)
continue:(resourceName = "")||(resourceName = "Unused")
set resourceNumber = $length($extract(allSeizeNames, 1, $find(allSeizeNames, resourceName)), ",") - 1
continue:(resourceNumber = 0)
if (seizeNumbers = "") {
set seizeNumbers = resourceNumber
} else {
set seizeNumbers = seizeNumbers_","_resourceNumber
}
}
quit seizeNumbers
}
ClassMethod getSeizeLowerCaseName(seizeName As %String) As %String
{
quit $tr($zcvt(seizeName, "l"), "-", "_")
}
ClassMethod getECPStat(ByRef values) As %Status
{
set sc = $$$OK
set ecpStat = ""
if (..#MAXECPCONN '= 0) {
set fullECPStat = $piece($system.ECP.GetProperty("ClientStats"), ",", 1, 21)
set activeEcpConn = $system.ECP.NumClientConnections()
set addBlocks = $piece(fullECPStat, ",", 2)
set purgeBuffersByLocal = $piece(fullECPStat, ",", 6)
set purgeBuffersByRemote = $piece(fullECPStat, ",", 7)
set bytesSent = $piece(fullECPStat, ",", 19)
set bytesReceived = $piece(fullECPStat, ",", 20)
}
set ecpStatDesc = "add_blocks,purge_buffers_local,"_
"purge_server_remote,bytes_sent,bytes_received"
set ecpStat = addBlocks_","_purgeBuffersByLocal_","_
purgeBuffersByRemote_","_bytesSent_","_bytesReceived
if (ecpStat '= "") {
for l = 1:1:$length(ecpStat, ",") {
set values("ecp", $piece(ecpStatDesc, ",", l)) = $piece(ecpStat, ",", l)
}
set values("act_ecp") = activeEcpConn
}
quit sc
}
}
In order to call my.Metrics via REST, let’s create a wrapper class for it in the USER space.
Class my.Mgstat Extends %CSP.REST
{
XData UrlMap [ XMLNamespace = "http://www.intersystems.com/urlmap" ]
{
<Routes>
<Route Url="/:delay" Method="GET" Call="getMgstat"/>
</Routes>
}
ClassMethod getMgstat(delay As %Integer = 2) As %Status
{
// By default, we use 2 second interval for averaging
quit ##class(my.Metrics).getSamples(delay)
}
}
Creating a resource, a user and a web application
Now that we have a class feeding us metrics, we can create a RESTful web application. Like in the first article, we’ll allocate a resource to this web application and create a user who will use it and on whose behalf Prometheus will be collecting metrics. Once done, let’s grant the user rights to particular databases. In comparison with the first article, we have added a permission to write to the CACHESYS database (to avoid the <UNDEFINED>loop+1^mymgstat *gmethod" error) and the possibility to use the %Admin_Manage resource (to avoid the <PROTECT>gather+10^mymgstat *GetProperty,%SYSTEM.ECP" error). Let’s repeat these steps on both virtual servers, 192.168.42.131 and 192.168.42.132. Before doing that, we’ll upload our code, the my.Metrics class and the my.Mgstat class to the USER space on both servers (the code is available on github).
That is, we perform the following steps on each virtual server:
# wget https://raw.githubusercontent.com/myardyas/prometheus/master/mgstat/cos/udl/Metrics.cls
# wget https://raw.githubusercontent.com/myardyas/prometheus/master/mgstat/cos/udl/Mgstat.cls
#
# # If servers are not connected to the Internet, copy the program and the class locally, then use scp.
#
# csession <instance_name> -U user
USER>do $system.OBJ.Load("/tmp/Metrics.cls*/tmp/Mgstat.cls","ck")
USER>zn "%sys"
%SYS>write ##class(Security.Resources).Create("PromResource","Resource for Metrics web page","")
1
%SYS>write ##class(Security.Roles).Create("PromRole","Role for PromResource","PromResource:U,%Admin_Manage:U,%DB_USER:RW,%DB_CACHESYS:RW")
1
%SYS>write ##class(Security.Users).Create("PromUser","PromRole","Secret")
1
%SYS>set properties("NameSpace") = "USER"
%SYS>set properties("Description") = "RESTfull web-interface for mgstat"
%SYS>set properties("AutheEnabled") = 32 ; See description
%SYS>set properties("Resource") = "PromResource"
%SYS>set properties("DispatchClass") = "my.Mgstat"
%SYS>write ##class(Security.Applications).Create("/mgstat",.properties)
1
Check the availability of metrics using curl
(Don't forget to open port 57772 in firewall)
isc_cache_mgstat_global_refs 347
isc_cache_mgstat_remote_global_refs 0
isc_cache_mgstat_global_remote_ratio 0
…
# curl --user PromUser:Secret -XGET http://192.168.42.132:57772/mgstat/5
isc_cache_mgstat_global_refs 130
isc_cache_mgstat_remote_global_refs 0
isc_cache_mgstat_global_remote_ratio 0
...
Check the availability of metrics from Prometheus
Prometheus listens to port 9090. Let’s check the status of Targets first:

Then look at a random metric:
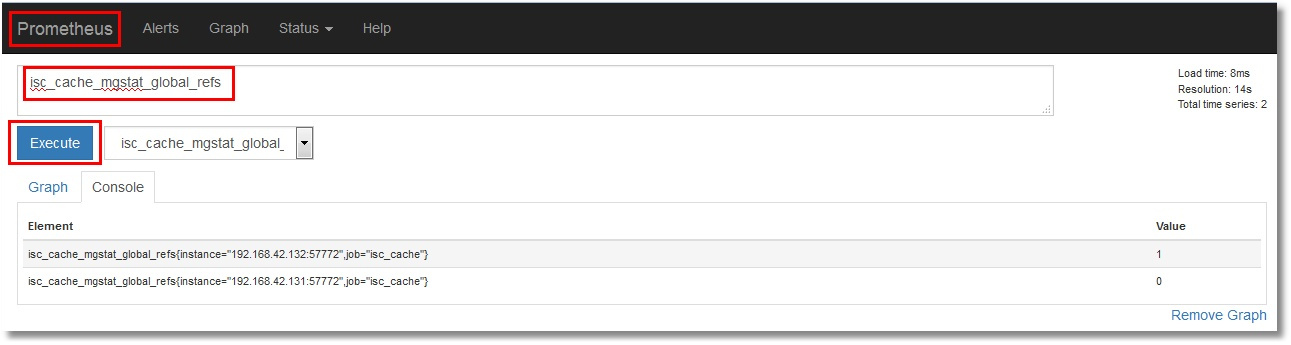
Showing one metric
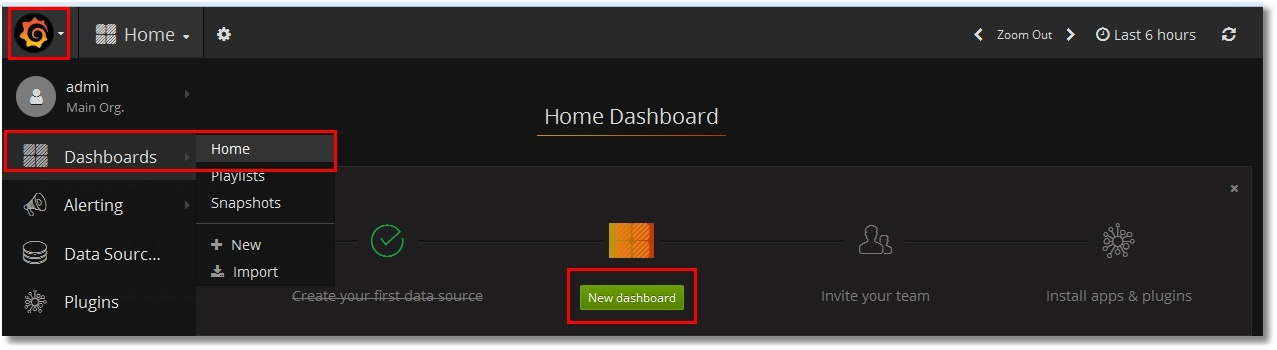
We’ll now show just one metric – for example, isc_cache_mgstat_global_refs, as a graph. We’ll need to update the dashboard and insert the graph there. To do this, we go to Grafana (http://localhost:3000, login/pass — admin/TopSecret) and add a new dashboard:
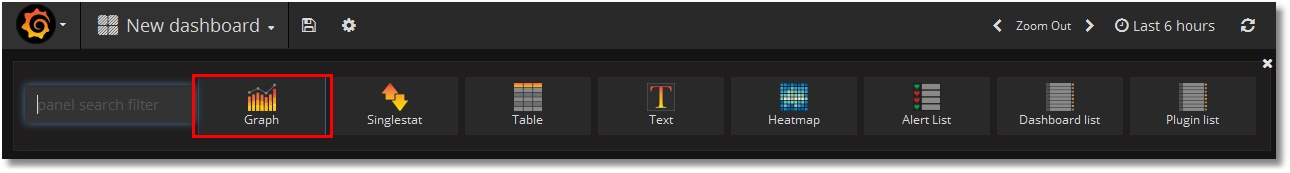
Add a graph:
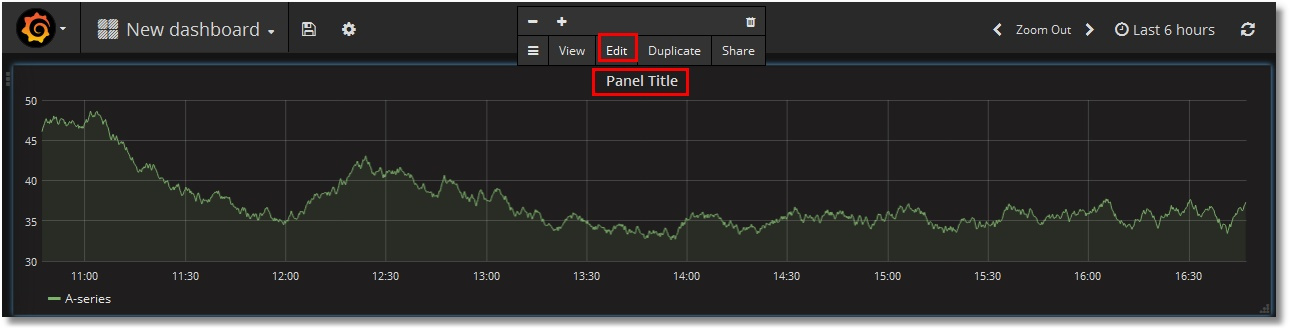
Edit it by clicking on “Panel title”, then “Edit”:
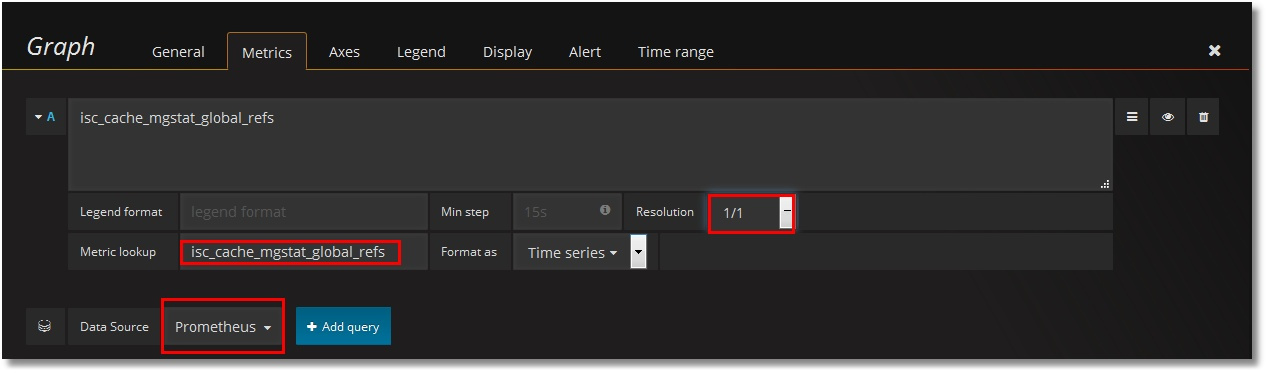
Set Prometheus as the data source and pick our metric, isc_cache_mgstat_global_refs. Set the resolution to 1/1:
Let’s give our graph a name:

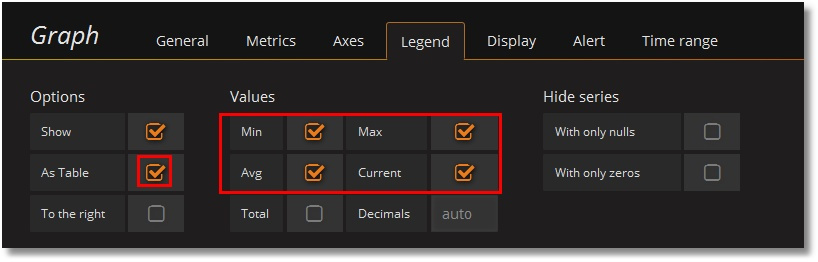
Add a legend:
Click the “Save” button at the top of the window and type the dashboard’s name:

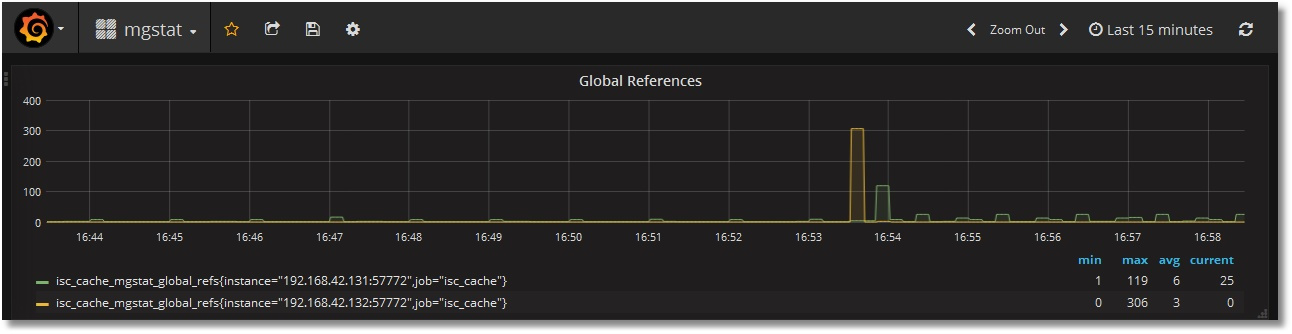
We end up having something like this:
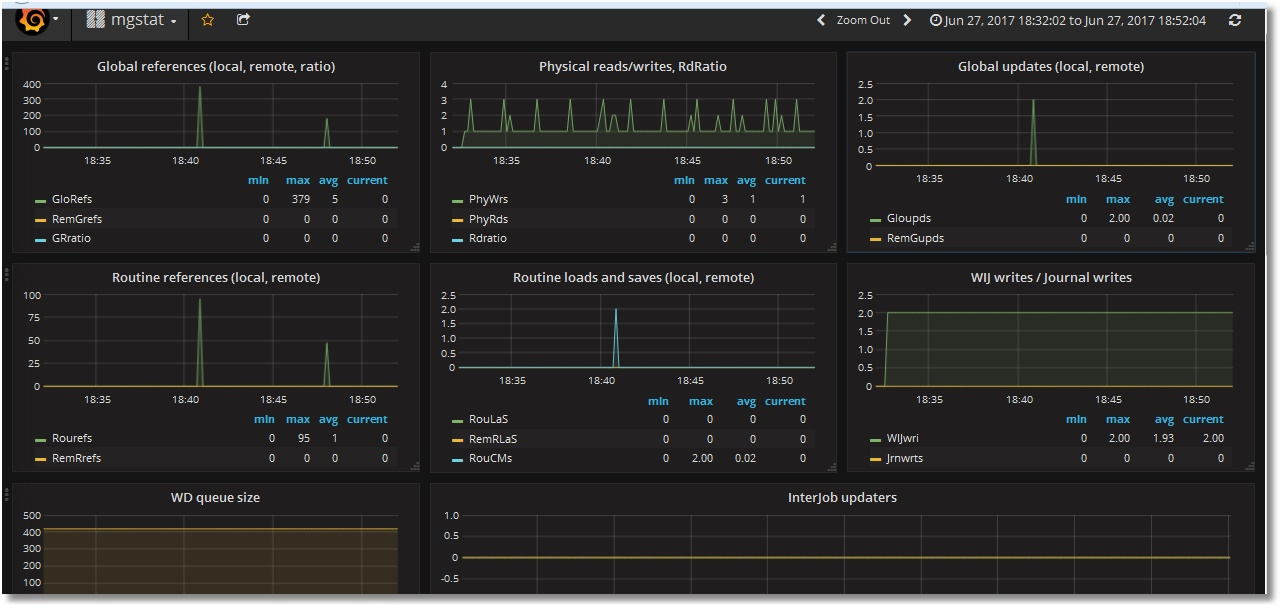
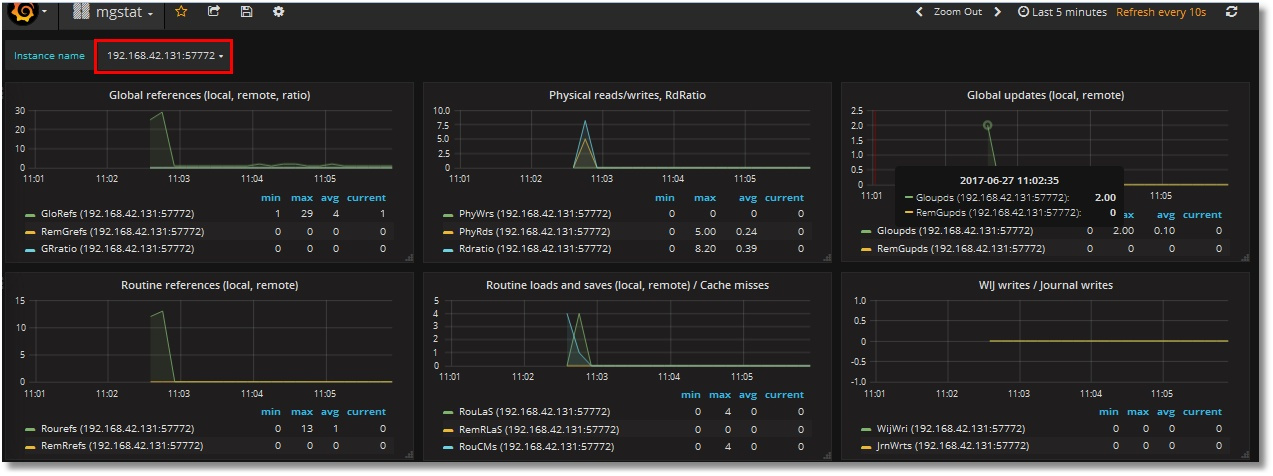
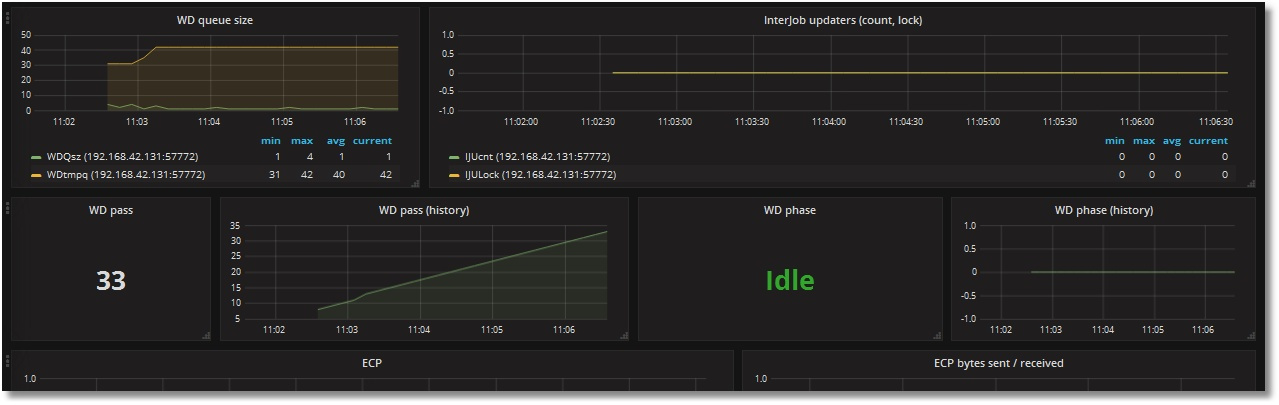
Showing all metrics
Let’s add the rest of the metrics the same way. There will be two text metrics – Singlestat. As the result, we’ll get get the following dashboard (upper and lower parts shown):

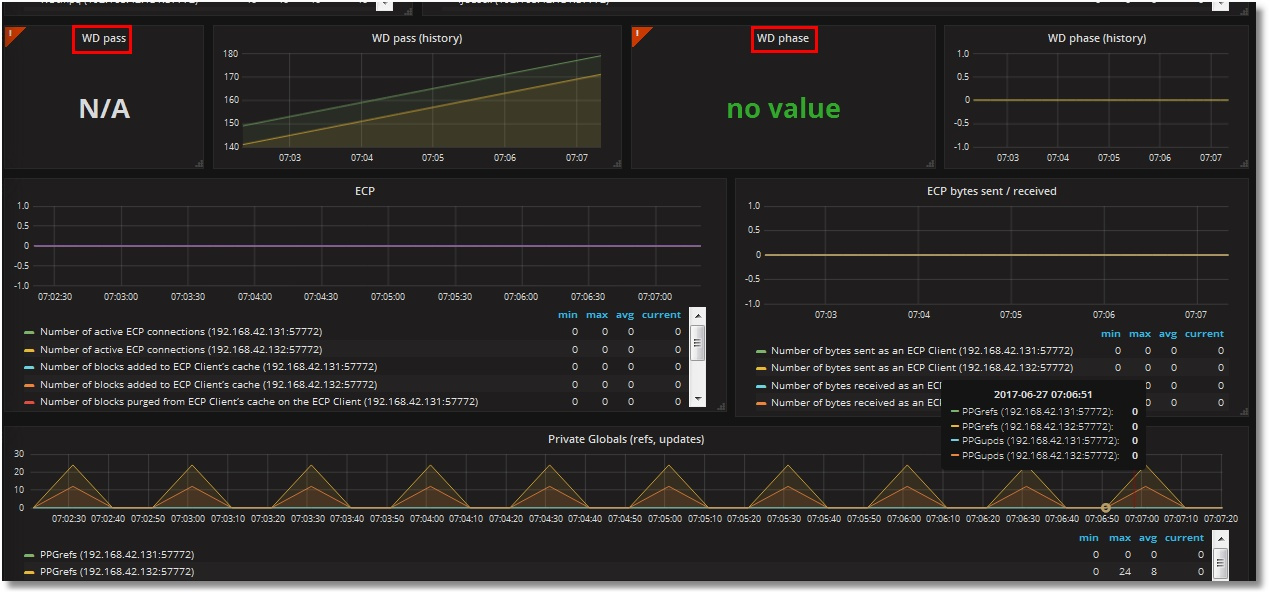
Two things obviously don’t seem right:
— Scrollbars in the legend (as the number of servers goes up, you’ll have to do a lot of scrolling);
— Absence of data in Singlestat panels (that, of course, imply a single value). We have two servers and two values, accordingly.
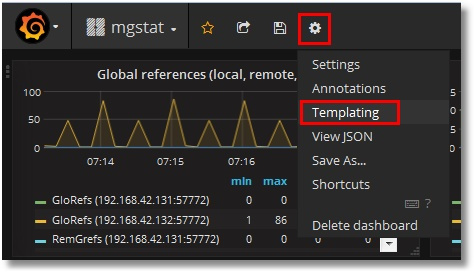
Adding the use of a template
Let’s try fixing these issues by introducing a template for instances. To do that, we’ll need to create a variable storing the value of the instance, and slightly edit requests to Prometheus, according to the rules. That is, instead of the "isc_cache_mgstat_global_refs" request, we should use "isc_cache_mgstat_global_refs{instance="[[instance]]"}" after creating an “instance” variable.
Creating a variable:

In our request to Prometheus, let’s select the values of instance labels from each metric. In the lower part, we can see that the values of our two instances have been identified. Click the “Add” button:
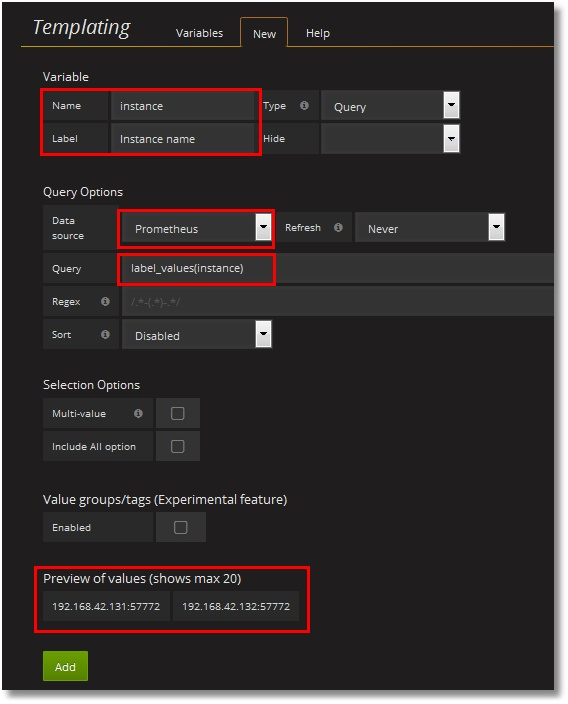
A variable with possible values has been added to the upper part of the dashboard:
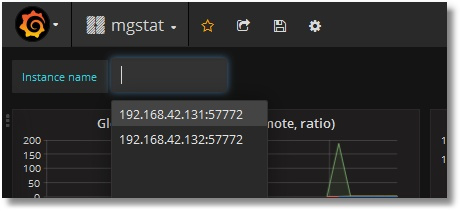
Let us now add this variable to requests for each panel on the dashboard; that is, turn request like "isc_cache_mgstat_global_refs" into "isc_cache_mgstat_global_refs{instance="[[instance]]"}". The resulting dashboard will look like this (instance names have been left next to the legend on purpose):
Singlestat panels are already working:
The template of this dashboard can be downloaded from github. The process of importing it to Grafana was described in part 1 of the article.
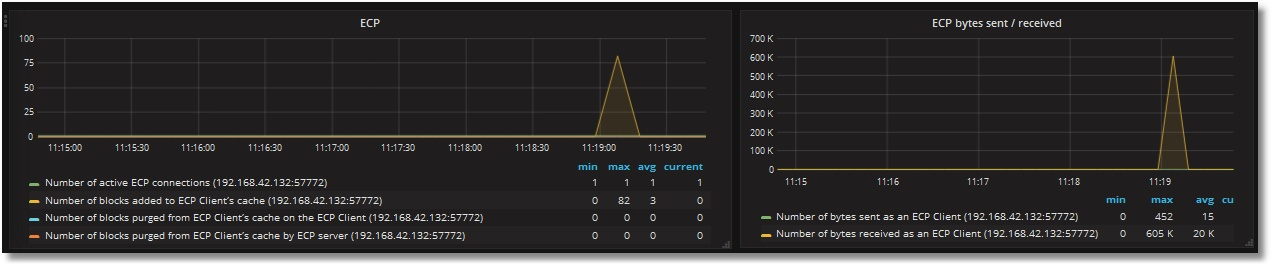
Finally, let’s make server 192.168.42.132 the ECP client for 192.168.42.131 and create globals for generating ECP traffic. We can see that ECP client monitoring is working:
Conclusion
We can replace the display of ^mgstat results in Excel with a dashboard full of nice-looking graphs that are available online. The downside is the need to use an alternative version of ^mgstat. In general, the code of the source tool can change, which wasn’t taken into account. However, we get a really convenient method of monitoring Caché’s performance.
Thank you for your attention!
To be continued...
P.S.
The demo (for one instance) is available here, no login/password required.
Comments
Nice! Thanks for this! Here's what I'm currently using to deal with pButtons/mgstat output: https://community.intersystems.com/post/visualizing-data-jungle-part-iv-running-yape-docker-image
Cheers, Fab
Fabian. thanks for link! I'll try it.
Thank you for sharing . Good job.
Hi Mikhail, you've done a really nice job!
I'm just curious, why:
We don’t care about output to a file.
Wasn't it easier to parse mgstat's output file?
Hi, Alexey! Thanks! What about your question: I think, in that case we should:
1) run mgstat continuously
2) parse file.
Although both of these steps are not difficult, a REST-interface enables us to merge them in one step when we run class in that time we want. Besides we can always extend our metrics set. For example, it's worth to add monitoring of databases sizes as well as Mirroring, Shadowing etc.
Mikhail, haven't you considered to keep the time series in Cache and use Grafana directly? @David Loveluck seems got something working in this direction: https://community.intersystems.com/post/using-grafana-directly-iris. Cashe/IRIS is powerful database, so another database in the middle feels like Boeing using parts from Airbus.
@Arto Alatalo At that time i've used Prometheus as a central monitoring system for hosts, services and Cache as well.
Also Simple JSON plugin should be improved to provide similar to Prometheus/Grafana functionality, at least at that moment I've looked at it last time.
Someone keep json from dashboard ?
Hi Mikhail,
Where did you get the information for the meaning of the returned values from $system.ECP.GetProperty("ClientStats")?
Nice job, anyway ;-)
Hi David,
Thanks -) Regarding a meaning - it's taken from mgstat source-code (%SYS, routine mgstat.int).
Starting point was a line 159 in my local Cache 2017.1:
Then I guessed a meaning from a subroutine "heading" (line 289).
But the best option for you, I think, is to ask WRC. Support is very good.