What is causing the journals to grow rapidly?
Question:
My journal files are growing rapidly - what could be the cause? How can I minimize the phenomena?
Answer:
A good starting point for investigating the cause of journaling usage is the Journal Profile, as you would want to determine the culprit/s that is making the journal files grow rapidly.
Before discussing the Journal Profile, one other way for examining the Journals is simply looking at the journals' contents:
Looking at the file –
a. Via the Mgmt. Portal:

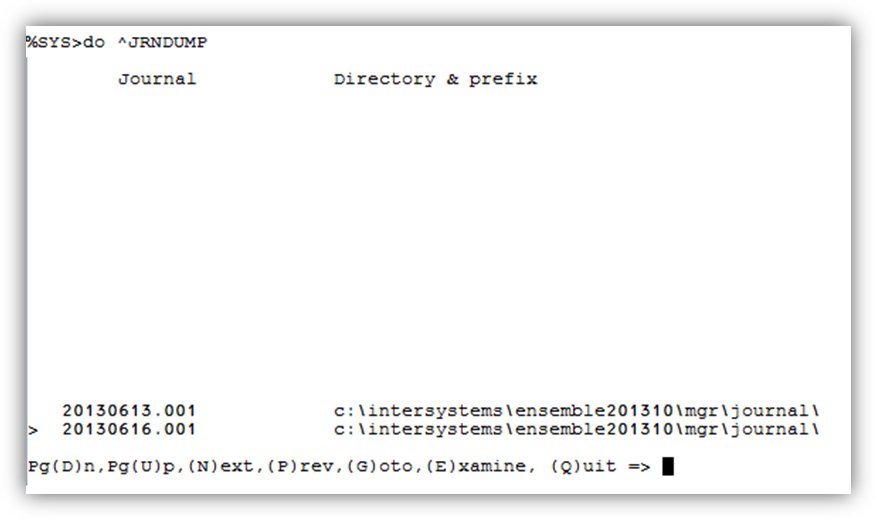
b. Or the ^JRNDUMP utility:

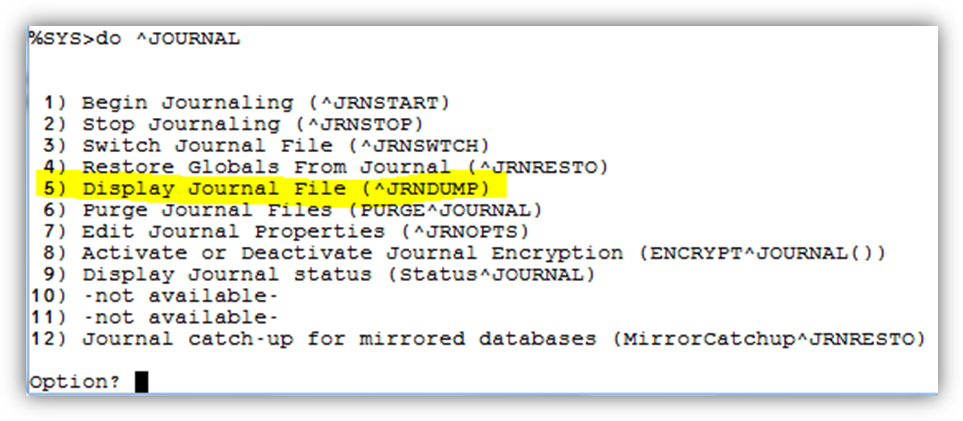
You can also get to this via the more general ^JOURNAL menu:

With this approach you'd need to browse through the journal "pages" and "get a feeling" for which global/s appear a lot.
A better way to do this then would be to use the Journal Profile utility:
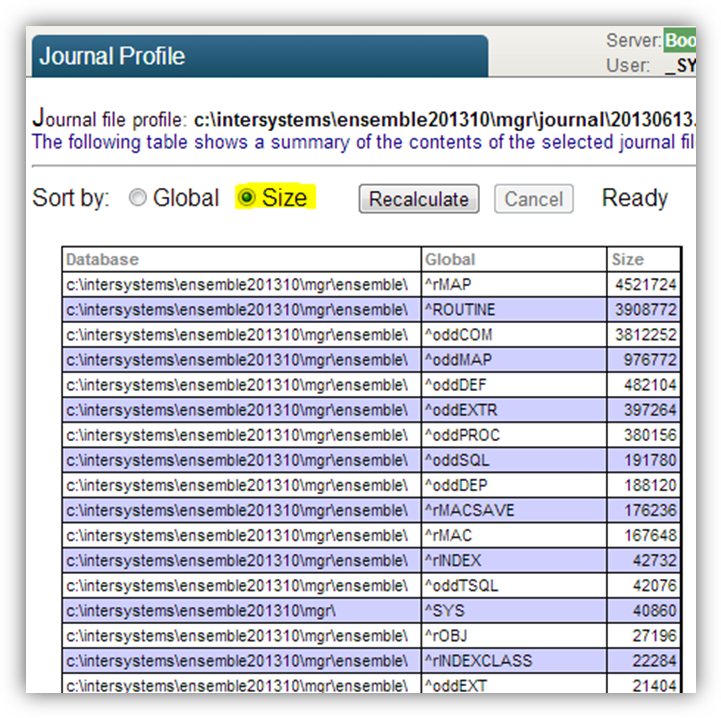
Using the Journal Profile which provides a summary of the size of the file taken up by each global. Note the calculation on large files could take quite a while (be patient)… you'll get a report how much of the file it already calculated, for example:

Running the Profile via the Mgmt. Portal –
 Eventually you'll get a report like this:

Once you have this information (and you can run the Profile on more than one file to get a better picture of this behavior over time), you can focus on the main globals causing the growth and investigate further why these specific globals are growing rapidly, is this the natural behavior, and how you could minimize it.
Comments
Good article, but unfortunately I don't see the answer for last part for the question "How can I minimize the phenomena?"
So, in my practise, such behavior, in most cases related with some application's buffer globals, or logging globals. And mostly we don't need in this journal, because it is not important part of our data, and we should not spend important resources for doing this. And we can cut off journalling for such globals. There are some ways to do it:
- Remap such globals to another database with disabled journaling. But this way has some exceptions, any changes in transactions, should be journaled in any way.
- Use ENABLE^%NOJRN to disable journaling non-transact changes, and return back with DISABLE^%NORJN.
- Remap to database CACHETEMP, which disabled for all changes, even in transaction.
Thanks Dmitry.
Indeed the focus here was on finding the possible globals you would want to dive deeper into regarding why they are taking up relatively a lot of journal space, and thinking of ways to mitigate that.
When I get a chance I planned to follow-up with another post on ways to avoid journaling for such globals (though not always is that an option). Stay tuned...
Incidentally, In addition to what is stated here about the use of the ^JRNDUMP utility, there is also a very useful entry point, SELECT^JRNDUMP, which takes up to 7 arguments, so you can filter results in many ways to suit your needs. This can be helpful in trying to see the exact cause of journal growth.
For complete documentation, go here:
http://docs.intersystems.com/latest/csp/docbook/DocBook.UI.Page.cls?KEY…
Problem with giving recommendations on how to minimize this is that there are many causes and many potential resolutions. Some solutions will not be acceptable. The simplest solution would be to create a database to hold this global and any other you don't need journaled. Set this database to not be journaled and map that global to this database. Of course you may want to have the database journaled. Now you have to dig in further as others have suggested and determine why there is so much activity hitting this global. It could be a routine that can be adjusted to generate less global activity. I had a similar situation where the problem was traced to the fact that for every iteration of a process loop the global was updated. The same record could be touched hundreds of times. The solution was to hold the updates in a process private global (not journaled) and then do a single pass to update the records.
Hope this helps.
The entrypoints in %NOJRN works in the other way.
To disable journaling at the process level you must use DISABLE^%NOJRN
If you would work with this or even look at the documentation by link, which I gave, you would see that DISABLE actually disabled changes which was done by ENABLE^%NOJRN, and name NOJRN says No Journal.
Dmitry,
Ricardo is right: DISABLE^%NOJRN (despite of its non intuitive name) disables the journaling for the current process. Documentation states this, besides it's easy to check:
USER>d DISABLE^%NOJRN w $$CURRENT^%NOJRN
0
USER>d ENABLE^%NOJRN w $$CURRENT^%NOJRN
1
USER>w $$DisableJournal^%SYS.NOJRN," ",$$CURRENT^%NOJRN
1 0
USER>d EnableJournal^%SYS.NOJRN w $$CURRENT^%NOJRN
1I came across this comment and felt that others may benefit by reviewing the documentation rather than the debate. The documented answer for this is found here.
One important question when investigating these types of problems: is it one process, a couple processes, or many processes making the majority of these entries? You can find this out by viewing the file, either in the Management Portal or via JRNDUMP. More frequently than not, it's simply one runaway process, and it's quite either to either just terminate it, or at least determine what it's doing by inspecting the process itself.
Apart from a runaway process, one other activity that often increases the journal by leaps and bounds are bulk data loads, often in an data warehouse/datamart environment. I am sure Tani would cover this use case in his future address about minimizing it.
Here's the follow-up post on this topic.
Hope you enjoy the read.