InterSystems Data Platforms and performance – Part 3: Focus on CPU
This week I am going to look at CPU, one of the primary hardware food groups :) A customer asked me to advise on the following scenario; Their production servers are approaching end of life and its time for a hardware refresh. They are also thinking of consolidating servers by virtualising and want to right-size capacity either bare-metal or virtualized. Today we will look at CPU, in later posts I will explain the approach for right-sizing other key food groups - memory and IO.
So the questions are:
- How do you translate application requirements on a processor from more than five years ago to todays processors?
- Which of the current processors are suitable?
- How does virtualization effect CPU capacity planning?
Added June 2017: For a deeper dive into the specifics of VMware CPU considerations and planning and some common questions and problems, please also see this post: Virtualizing large databases - VMware cpu capacity planning
A list of other posts in this series is here
Comparing CPU performance using spec.org benchmarks
To translate CPU usage between processor types for applications built using InterSystems data platforms (Caché, Ensemble, HealthShare) you can use SPECint benchmarks as a reliable back of the envelope calculator for scaling between processors. The http://www.spec.org web site has trusted results of a standardised set of benchmarks that are run by hardware vendors.
Specifically SPECint is a way to compare processors between processor models from the same vendors and between different vendors (e.g. Dell, HP, Lenovo, and Intel, AMD, IBM POWER and SPARC). You can use SPECint to understand the expected CPU requirements for your application when hardware is to be upgraded or if your application will be deployed on a range of different customer hardware and you need to set a baseline for a sizing metric, for example peak transactions per CPU core for Intel Xeon E5-2680 (or whatever processor you choose).
There are several benchmarks used on the SPECint web site, however the SPECint_rate_base2006 results are the best for Caché and have been confirmed over many years looking at customer data and in our own benchmarks.
As an example in this post we will compare the difference between the customers Dell PowerEdge server running Intel Xeon 5570 processors and a current Dell server running Intel Xeon E5-2680 V3 processors. The same methodology can be applied when Intel Xeon V4 server processors are generally available (expected soon as I write this in early 2016).
Example: Comparing processors
Search the spec.org database for the SPECint2006_Rates for processor name, for example E5-2680 V3, further refine your search results if your target server make and model is known (e.g Dell R730), otherwise use a popular vendor, I find Dell or HP models are good baselines of a standard server, there is not usually much variance between processors on different vendor hardware.
At the end of this post I walk through a step by step example of searching for results using the spec.org web site…
Lets assume you have searched spec.org and have found the existing server and a possible new server as follows:
Existing: Dell PowerEdge R710 with Xeon 5570 2.93 GHz: 8 cores, 2 chips, 4 cores/chip, 2 threads/core: SPECint_rate_base2006 = 251
New: PowerEdge R730 with Intel Xeon E5-2680 v3, 2.50 GHz: 24 cores, 2 chips, 12 cores/chip, 2 threads/core: SPECint_rate_base2006 = 1030
Not surprisingly the newer 24-core server has more than 4x increase in SPECint_rate_base2006 benchmark throughput of the older 8-core server even though the newer server has a lower clock speed. Note the examples are two-processor servers that have both processor sockets populated.
Why is SPECint_rate_base2006 used for Caché?
The spec.org web site has explanations of the various benchmarks, but the summary is the SPECint_rate2006 benchmark is a complete system-level benchmark uses all CPUs with hyper threading.
Two metrics are reported for a particular SPECint_rate2006 benchmark, base and peak. Base is a conservative benchmark, peak is aggressive. For capacity planning use SPECint_rate_base2006 results.
Does four times the SPECint_rate_base2006 mean four times the capacity for users or transactions?
Its possible that if all 24 cores were used the application throughput could scale to four times the capability of the old server. However several factors can cause this milage to vary. SPECint will get you in the ballpark for sizing and throughput that should be possible, but there are a few caveats.
While SPECint gives a good comparison between the two servers in the example above it is not a guarantee that the E5-2680 V3 server will have 75% more capacity for peak concurrent users or peak transaction throughput as the older Xeon 5570 based server. Other factors come into play such as whether the other hardware components in our food groups are upgraded, for example is the new or existing storage capable of servicing the increase in throughput (I will have an in-depth post on storage soon).
Based on my experience benchmarking Caché and looking at customers performance data Caché is capable of linear scaling to extremely high throughput rates on a single server as compute resources (CPU cores) are added, even more so with the year on year improvements in Caché. Put another way I see linear scaling of maximum application throughput, for example application transactions or reflected in Caché glorefs as CPU cores are added. However if there are application bottlenecks they can start to appear at higher transaction rates and impact liner scaling. In later posts I will look at where you can look for symptoms of application bottlenecks. One of the best things you can do to improve application performance capability is to upgrade Caché to the latest version.
Note: For Caché, Windows 2008 servers with more than 64 logical cores are not supported. For example, a 40 core server must have hyper threading disabled. For Windows 2012 up to 640 logical processors are supported. There is no limits on Linux.
How many cores does the application need?
Applications vary and you know your own applications profile, but the common approach I use when capacity planning CPU for a server (or Virtual Machine) is from diligent system monitoring understanding that a certain number of CPU cores of a certain 'standard' processor can sustain a peak transaction rate of n transactions per minute. These may be episodes, or encounters, lab tests, or whatever makes sense in your world. The point is that the throughput of the standard processor is be based on metrics you have collected on your current system or a customers systems.
If you know your peak CPU resource use today on a known processor with n cores, you can translate to the number of cores required on a newer or different processor for the same transaction rate using the SPECint results. With expected linear scaling 2 x n transactions per minute roughly translates to 2 x the number of cores are required.
Selecting a processor
As you see from the spec.org web site or looking at your preferred vendor offerings there are many processor choices. The customer in this example is happy with Intel, so if I stick with recommending current Intel servers then one approach is to look for 'bang for buck' - or SPECint_rate_base2006 per dollar and per core. For example the following chart plots Dell commodity servers - your price milage will vary, but this illustrates the point there are sweet spots in price and higher core counts suitable for consolidation of servers using virtualization. I created the chart by pricing a production quality server, for example Dell R730, and then looking at different processor options.
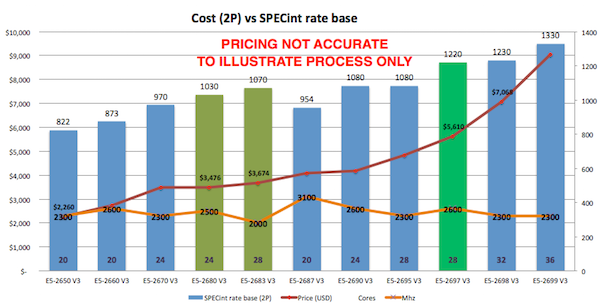
Based on the data in the chart and experience at customers sites the E5-2680 V3 processor shows good performance and a good price point per SPECint or per core.
Other factors come into play as well, for example if you are looking at server processors for virtualized deployment it may be cheaper to increase the core count per processor at increased cost but with the effect of lowering the total number of host servers required to support all your VMs, therefore saving on software (e.g. VMware or Operating Systems) that licence per processor socket. You will also have to balance number of hosts against your High Availability (HA) requirements. I will revisit VMware and HA in later posts.
For example a VMware HA cluster made up of three 24-core host servers provides good availability and significant processing power (core count) allowing flexible configurations of production and non-production VMs. Remember VMware HA is sized at N+1 servers, so three 24-core servers equates to a total 48-cores available for your VMs.
Cores vs GHz - Whats best for Caché?
Given a choice between faster CPU cores versus more CPU cores you should consider the following:
- If your application has a lot of cache.exe threads/processes required then more cores will allow more of these to run at exactly the same time.
- If your application has fewer processes you want each to run as fast as possible.
Another way to look at this is that if you have a client/server application with many processes, say one (or more) per concurrent user you want more available cores. For browser based applications using CSP where users are bundled into fewer very busy CSP server processes your application would benefit from potentially fewer but faster cores.
In an ideal world both application types would benefit from many fast cores assuming there is no resource contention when multiple cache.exe processes are running in all those cores simultaneously. As I noted above, but worth repeating, every Caché release has improvements in CPU resource use, so upgrading applications to the latest versions of Caché can really benefit from more available cores.
Another key consideration is maximising cores per host when using virtualization. Individual VMs may not have high core counts but taken together you must strike a balance between number of hosts needed for availability and minimising the number of hosts for management and cost consideration by increasing core counts.
VMware virtualization and CPU
VMware virtualization works well for Caché when used with current server and storage components. By following the same rules as the physical capacity planning there is no significant performance impact using VMware virtualization on properly configured storage, network and servers. Virtulaization support is much better in later model Intel Xeon processors, specifically you should only consider virtualization on Intel Xeon 5500 (Nehalem) and later — so Intel Xeon 5500, 5600, 7500, E7-series and E5-series.
Example: Hardware refresh - calculating minimum CPU requirements
Putting together the tips and procedures above if we consider our example is a server upgrade of a workload running on Dell PowerEdge R710 with 8-cores (two 4-core Xeon 5570 processors).
By plotting the current CPU utilization on the primary production server at the customer we see that the server is peaking at less than 80% during the busiest part of the day. The run queue is not under pressure. IO and application is also good so there are no bottlenecks artificially surpassing suppressing CPU.
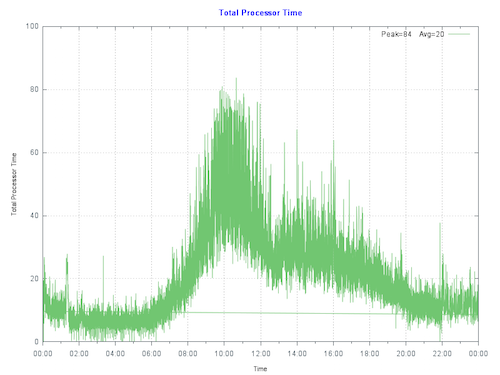
Rule of thumb: Start by sizing systems for maximum 80% CPU utilization at end of hardware life taking into account expected growth (e.g. an increase in users/transactions). This allows for unexpected growth, unusual events or unexpected spikes in activity.
To make calculations clearer I let us assume no growth in throughput is expected over the life of the new hardware:
The per core scaling can be calculated as: (251/8) : (1030/24) or 26% increase in throughput per core.
80% CPU using 8-cores on the old server equates to roughly 80% CPU using 6-cores on the new E5-2680 V3 processors. So the same number of transactions could be supported on six cores.
The customer has a few choices, they can purchase new bare-metal servers which meet the minimum CPU requirement of six E5-2680 V3 or equivalent CPU cores, or move forward with their plans to virtualize their production workload on VMware.
Virtulaizing makes sense to take advantage of server consolidation, flexibility and high availability. Because we have worked out the CPU requirements the customer can move forward with confidence to right-size production VMs on VMware. As a sidebar buying current servers with low core counts is either difficult to source or expensive, which makes virtualization an even more attractive option.
Virtualising is also an advantage if significant growth is expected. CPU requirements can be calculated based on growth in the first few years. With constant monitoring a valid strategy is to add additional resources only as needed ahead of requiring them.
CPU and virtualization considerations
As we have seen production Caché systems are sized based on benchmarks and measurements at live customer sites. It is also valid to size VMware virtual CPU (vCPU) requirements from bare-metal monitoring. Virtualization using shared storage adds very little CPU overhead compared to bare-metal**. For production systems use a strategy of initially sizing the system the same as bare-metal CPU cores.
**Note: For VMware VSAN deployments you must add a host level CPU buffer of 10% for VSAN processing.
The following key rules should be considered for virtual CPU allocation:
Recommendation: Do not allocate more vCPUs than safely needed for performance.
- Although large numbers of vCPUs can be allocated to a virtual machine, best practice is to not allocate more vCPUs than are needed as there can be a (usually small) performance overhead for managing unused vCPUs. The key here is to monitor your systems regularly to ensure VMs are right-sized.
Recommendation: Production systems, especially database servers, initially size for 1 physical CPU = 1 virtual CPU.
- Production servers, especially database servers are expected to be highly utalized. If you need six physical cores, size for six virtual cores. Also see the note on hyper threading below.
Oversubscription
Oversubscription refers to various methods by which more resources than are available on the physical host can be assigned to the virtual servers that are supported by that host. In general, it is possible to consolidate servers by oversubscribing processing, memory and storage resources in virtual machines.
Oversubscription of the host is still possible when running production Caché databases, however for initial sizing of production systems assume is that the vCPU has full core dedication. For example; if you have a 24-core (2x 12-core) E5-2680 V3 server – size for a total of up to 24 vCPU capacity knowing there may be available headroom for consolidation. This configuration assumes hyper-threading is enabled at the host level. Once you have spent time monitoring the application, operating system and VMware performance during peak processing times you can decide if higher consolidation is possible.
If you are mixing non-production VMs a rule of thumb for system sizing to calculate total CPU cores I often use is to initially size non-Production at 2:1 Physical to Virtual CPUs. However this is definitely an area where milage may vary and monitoring will be needed to help you with capacity planning. If you have doubts or no experience you can separate production VMs from non-production VMs at the host level or by using vSphere configuration until workloads are understood.
VMware vRealize Operations and other third-party tools have the facility to monitor systems over time and suggest consolidation or alert that more resources are required for VMs. In a future post I will talk about more tools available for monitoring.
The bottom line is that in our customers example they can be confident that their 6 vCPU production VM will work well, of course assuming other primary food group components such as IO and storage have capacity ;)
Hyperthreading and capacity planning
A good starting point for sizing VMs based on known rules for physical servers is to calculate physical server CPU requirements for the target per processor with hyper-threading enabled then simply make the translation:
one physical CPU (includes hyperthreading) = one vCPU (includes hyperthreading).
A common misconception is that hyper-threading somehow doubles vCPU capacity. This is NOT true for physical servers or for logical vCPUs. As a rule of thumb hyperthreading on a bare-metal server may give a 30% additional performance capacity over the same server without hyperthreading. The same 30% rule applies to virtulized servers.
Licensing and vCPUs
In vSphere you can configure a VM to have a certain number of sockets or cores. For example, if you have a dual-processor VM, it can be configured so it has two CPU sockets, or that it has a single socket with two CPU cores. From an execution standpoint it does not make much of a difference because the hypervisor will ultimately decide whether the VM executes on one or two physical sockets. However, specifying that the dual-CPU VM really has two cores instead of two sockets could make a difference for non-Caché software licenses.
Summary
In this post I outlined how you can compare processors between vendors, servers or models using SPECint benchmark results. Also how to capacity plan and choose processors based on performance and architecture whether virtualized is used or not.
These are deep subjects, and its easy to head of into the weeds…however the same as the other posts, please comment or ask questions if you do want to head off different directions.
—
EXAMPLE Searching for SPECint_rate2006 results.
The following figure shows selecting the SPECint_rate2006 results.
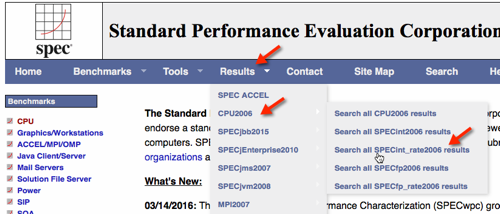
Use the search screen narrow results.
Note that you can also to dump all records to a ~20MB .csv file for local processing, for example with Excel.
The results of the search show the Dell R730.


Selecting HTML to give the full benchmark result.
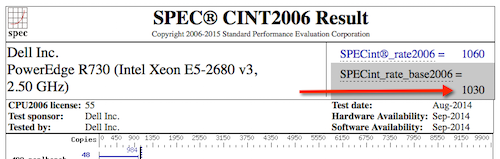
You can see the following results for servers with the processors in our example.
Dell PowerEdge R710 with 2.93 GHz: 8 cores, 2 chips, 4 cores/chip, 2 threads/core Xeon 5570: SPECint_rate_base2006 = 251
PowerEdge R730 (Intel Xeon E5-2680 v3, 2.50 GHz) 24 cores, 2 chips, 12 cores/chip, 2 threads/core Xeon E5-2680 v3: SPECint_rate_base2006 = 1030
Comments
I really appreciate all the work you have done on this post.
But for me, it is beyond me.
Perhaps a more meaningful summary for those who wish to stay out of the weeds?
Ok, here is the simpler route:
1. if you have performance problems then run pButtons, call WRC, they will get "performance team" involved and explain you what you see :);
2. if you have budget for new HW then see item #1 above and ask WRC for advice.
Thank you Murray. These are great article series
The problem with all such analyses is always the same. They fail to account for the single most important factor for real world applications, and that is memory bandwidth.
Code written for benchmarks has the flaw that it is precisely "written for benchmarks". It is no replacement for real life code which accesses memory in ways that such custom code cannot even begin to emulate.
Consider virtualization for a moment. Let's take the x86 world. Let's take Intel's VT-x, or AMD's AMD-V. If you look at the wikipedia entry for such techniques, the core goal of those technologies is _not_ to make machine code run faster (this is the "easy part"), but to reduce the time it takes for programs in virtualized environments to access memory.
Running code is "easy". Accessing memory is hard... And accessing memory is the key.
----
For completeness, I'll just add this: I am mostly a Java developer, and I know that the most glaring flaw of Java is its poor locality of reference -- accessing any `X` in a `List<X>` is very likely to trigger a page fault/load/TLB update cycle for this particular `X` to be available. As a result, when performance comes into play, I do not look as much into the frequency of the CPU as I look into the L{1,2,3} cache sizes and the memory bus width and speed. In the long run, the latter three are the deciding factors as far as I'm concerned.
Hi Francis,
You are absolutely right that memory access performance is vital, however this is not only bandwidth but also latency. With most new systems employing NUMA based architectures, both memory speed and bandwidth have a major impact. This requirement continues to grow as well as because more and more processor cores are crammed into a single socket allowing for more and more concurrently running processes and threads. In additional NUMA node inter-memory accesses plays a major role. I agree that clock speed alone is not a clear indicator of being "the fastest", since clock speeds haven't changed all that much over the years once getting into the 2-3Ghz+ range, but rather items such as overall processor and memory architectures (eg. Intel QPI), on-board instruction sets, memory latency, memory channels and bandwidth, and also on-chip pipeline L2/L3 cache sizes and speeds all play a role.
What this article is demonstrating is not particularly CPU sizing specifics for any given application, but rather mentioning one of (not the only) useful tools comparing a given processor to another. We all agree there is no substitute for real-world application benchmarking, and what we have found through benchmarking real-world application based on Caché that SPECint (and SPECint_rate) numbers usually provides a safe relative correlation or comparison from processor model to processor model. Now things become more complicated when applications might not be optimally written and impose unwanted bottlenecks such as excessive database block contentions, lock contention, etc... from the application. Those items tend to negatively impact scalability on the higher end and would prohibit linear or predictable scaling.
This article is to serve as the starting point for just one of the components in the "hardware food group". So the real proof or evidence is gained from doing proper benchmarking of your application because that encapsulated all components working together.
Kind regards...
Thanks for the comments Francis, I think Mark sums up what I was aiming for. The first round of posts is to introduce the major system components that affect performance, and you are right memory has a big role to play along with CPU and IO. There has to be a balance - to keep stretching the analogy good nutrition and peak performance is the result of a balanced diet. Certainly badly sized or configured memory will cause performance problems for any application, and with Java applications this is obviously a big concern. My next post is about capacity planning memory, so hopefully this will be useful - although I will be focusing more on the intersection with Caché. As Mark pointed out NUMA can also have influence performance, but there are strategies to plan for and mitigate the impact of NUMA which I will talk about in my Global Summit presentations, and which I will also cover in this series of posts.
Another aim in this series is to help customers who are monitoring their systems to understand what metrics are important and from that use the pointers in these posts to start to unpack whats going on with their application and why - and whether action needs to be taken. The best benchmark is monitoring and analysing your own live systems.
Murray,
Can you explain how you do these calculations:
The per core scaling can be calculated as: (251/8) : (1030/24) or 26% increase in throughput per core.
80% CPU using 8-cores on the old server equates to roughly 80% CPU using 6-cores on the new E5-2680 V3 processors. So the same number of transactions could be supported on six cores.
I mean what did you do to match the 80% on the old server to 6 -cores in the new one. I got a little bit lost with the numbers or steps you do.
Thanks
Hi, back of the envelope logic is like this:
For the old server you have 8 cores. Assuming the workload does not change:
Each core on the new server is capable of about 25% more processing throughput. Or another way; each core of the old server is capable of of about 75% processing throughput of the new server. So roughly (8 *.75) old cores equates to about 6 cores on the new server.
You will have to confirm how your application behaves, but if you are using the calculation to work out how much you can consolidate applications on a new virtualized server you can get a good idea what to expect. If it is virtualized you can also right-size after monitoring to fine tune if you have to.
For a deeper dive into VMware CPU considerations and planning, please see the post:
https://community.intersystems.com/post/virtualizing-large-databases-vmware-cpu-capacity-planning
@Murray Oldfield - thank you for the time you spent putting together these performance articles!