InterSystems Data Platforms and performance – Part 2
In the last post we scheduled 24-hour collections of performance metrics using pButtons. In this post we are going to be looking at a few of the key metrics that are being collected and how they relate to the underlying system hardware. We will also start to explore the relationship between Caché (or any of the InterSystems Data Platforms) metrics and system metrics. And how you can use these metrics to understand the daily beat rate of your systems and diagnose performance problems.
A list of other posts in this series is here
Edited Oct 2016... Example of script to extract pButtons data to a .csv file is here. Edited March 2018... Images had disappeared, added them back in.
Hardware food groups

As you will see as we progress through this series of posts the server components affecting performance can be itemised as:
- CPU
- Memory
- Storage IO
- Network IO
If any of these components is under stress then system performance and user experience will likely suffer. These components are all related to each other as well, changes to one component can affect another, sometimes with unexpected consequences. I have seen an example where fixing an IO bottleneck in a storage array caused CPU usage to jump to 100% resulting in even worse user experience as the system was suddenly free to do more work but did not have the CPU resources to service increased user activity and throughput.
We will also see how Caché system activity has a direct impact on server components. If there are limited storage IO resources a positive change that can be made is increasing system memory and increasing memory for Caché global buffers which in turn can lower system storage read IO (but perhaps increase CPU!).
One of the most obvious system metrics to monitor regularly or check when users report problems is CPU usage. Looking at top or nmon on Linux or AIX, or Windows Performance Monitor. Because most system administrators look at CPU data regularly, especially if it is presented graphically, a quick glance gives you a good feel for the current health of your system -- what is normal or a sudden spike in activity that might be abnormal or indicates a problem. In this post we are going to look quickly at CPU metrics, but will concentrate on Caché metrics, we will start by looking at mgstat data and how looking at the data graphically can give a feel for system health at a glance.
Introduction to mgstat
mgstat is one of the Caché commands included and run in pButtons. mgstat is a great tool for collecting basic performance metrics to help you understand your systems health. We will look at mgstat data collected from a 24 hour pButtons, but if you want to capture data outside pButtons mgstat can also be run on demand interactively or as a background job from Caché terminal.
To run mgstat on demand from the %SYS namespace the general format is.
do mgstat(sample_time,number_of_samples,"/file_path/file.csv",page_length)
For example to run a background job for a one hour run with 5 seconds sample period and output to a csv file.
job ^mgstat(5,720,"/data/mgstat_todays_date_and_time.csv")
For example to display to the screen but dropping some columns use the dsp132 entry. I will leave as homework for you to check the output to understand the difference.
do dsp132^mgstat(5,720,"",60)
Detailed information of the columns in mgstat can be found in the Caché Monitoring Guide in the most recent Caché documentation: InterSystems online documentation
Looking at mgstat data
pButtons has been designed to be collated into a single HTML file for easy navigation and packaging for sending to WRC support specialists to diagnose performance problems. However when you run pButtons for yourself and want to graphically display the data it can be separated again to a csv file for processing into graphs, for example with Excel, by command line script or simple cut and paste.
In this post we will dig into just a few of the mgstat metrics to show how even a quick glance at data can give you a feel for whether the system is performing well or there are current or potential problems that will effect the user experience.
Glorefs and CPU
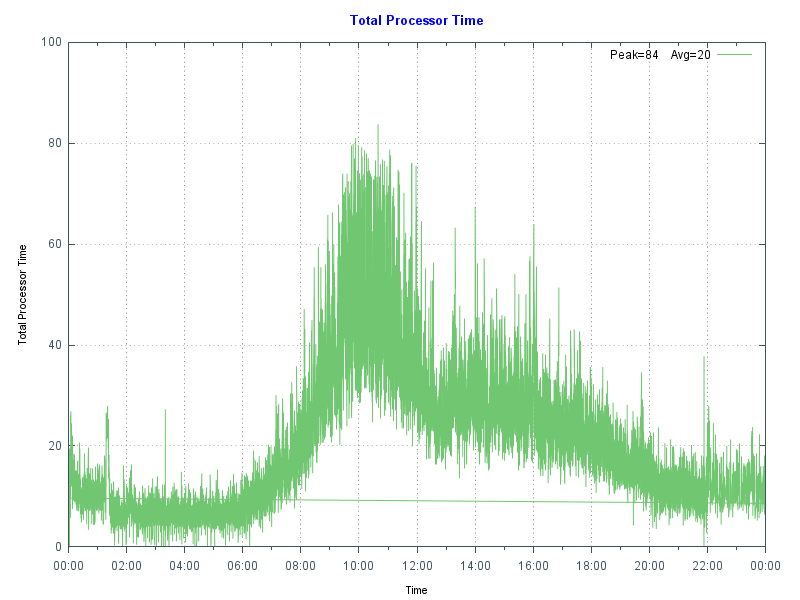
The following chart shows database server CPU usage at a site running a hospital application at a high transaction rate. Note the morning peak in activity when there are a lot of outpatient clinics with a drop-off at lunch time then tailing off in the afternoon and evening. In this case the data came from Windows Performance Monitor _(Total)% Processor Time - the shape of the graph fits the working day profile - no unusual peaks or troughs so this is normal for this site. By doing the same for your site you can start to get a baseline for "normal". A big spike, especially an extended one can be an indicator of a problem, there is a future post that focuses on CPU.

As a reference this database server is a Dell R720 with two E5-2670 8-core processors, the server has 128 GB of memory, and 48 GB of global buffers.
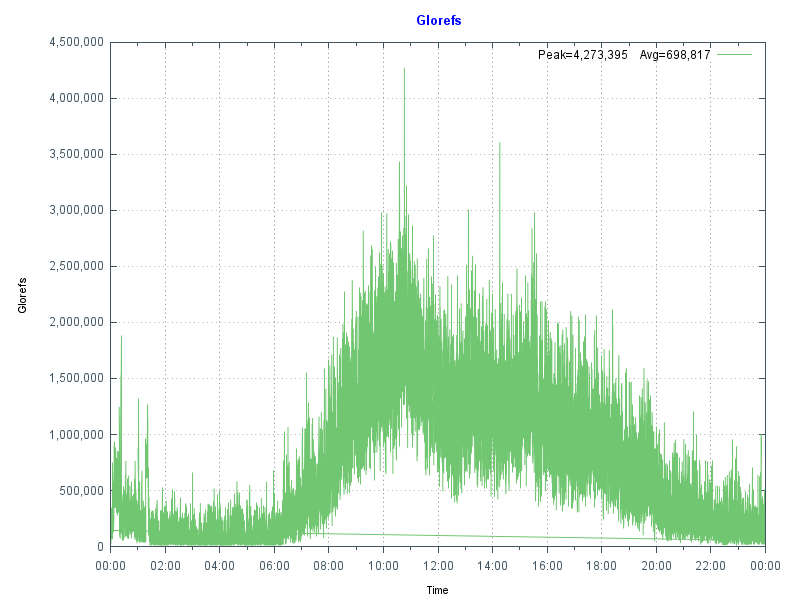
The next chart shows more data from mgstat — Glorefs (Global references) or database accesses for the same day as the CPU graph. Glorefs Indicates the amount of work that is occurring on behalf of the current workload; although global references consume CPU time, they do not always consume other system resources such as physical reads because of the way Caché uses the global memory buffer pool.

Typical of Caché applications there is a very strong correlation between Glorefs and CPU usage.
Another way of looking at this CPU and gloref data is to say that reducing glorefs will reduce CPU utilisation, enabling deployment on lower core count servers or to scale further on existing systems. There may be ways to reduce global reference by making an application more efficient, we will revisit this concept in later posts.
PhyRds and Rdratio
The shape of data from graphing mgstat data PhyRds (Physical Reads) and Rdratio (Read ratio) can also give you an insight into what to expect of system performance and help you with capacity planning. We will dig deeper into storage IO for Caché in future posts.
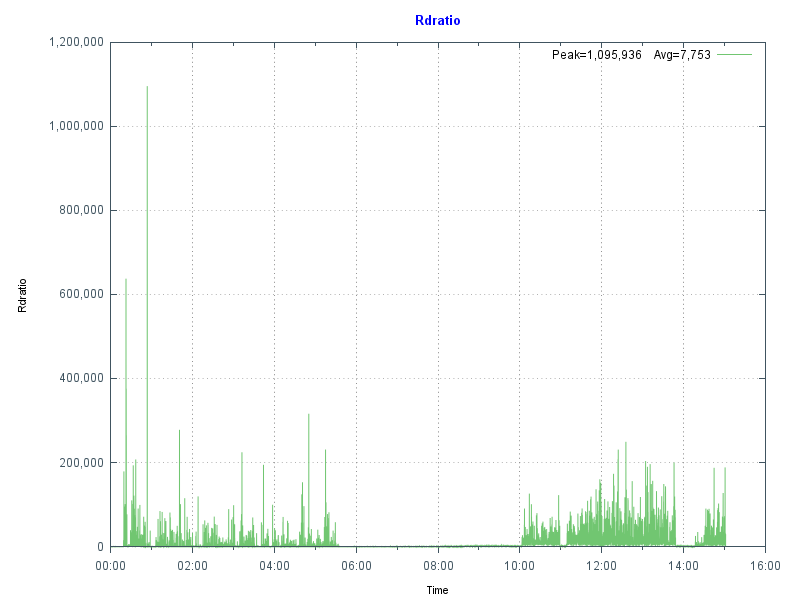
PhyRds are simply physical read IOPS from disk to the Caché databases, you should see the same values reflected in operating system metrics for logical and physical disks. Remember looking at operating system IOPS may be showing IOPS coming from non-Caché applications as well. Sizing storage and not accounting for expected IOPS is a recipe for disaster, you need to know what IOPS your system is doing at peak times for proper capacity planning. The following graph shows PhyRds between midnight and 15:30.

Note the big jump in reads between 05:30 and 10:00. With other shorter peaks at 11:00 and just before 14:00. What do you think these are caused by? Do you see these type of peaks on your servers?
Rdratio is a little more interesting — it is the ratio of logical block reads to physical block reads. So a ratio of how many reads are from global buffers (logical) from memory and how many are from disk which is orders of magnitude slower. A high Rdratio is a good thing, dropping close to zero for extended periods is not good.

Note that the same time as high reads Rdratio drops close to zero. At this site I was asked to investigate when the IT department started getting phone calls from users reporting the system was slow for extended periods. This had been going on seemingly at random for several weeks when I was asked to look at the system.
Because pButtons had been scheduled for daily 24-hour runs it was relatively simple to go back through several weeks data to start seeing a pattern of high PhyRds and low Rdratio which correlated with support calls.
After further analysis the cause was tracked to a new shift worker who was running several reports entering 'bad' parameters combined with badly written queries without appropriate indexes causing the high database reads. This accounted for the seemingly random slowness. Because these long running reports are reading data into global buffers the result is interactive user’s data is being fetched from physical storage, rather than memory as well as storage being stressed to service the reads.
Monitoring PhyRds and Rdratio will give you an idea of the beat rate of your systems and maybe allow you to track down bad reports or queries. There may be valid reason for high PhyRds -- perhaps a report must be run at a certain time. With modern 64-bit operating systems and servers with large physical memory capacity you should be able to minimise PhyRds on your production systems.
If you do see high PhyRds on your system there are a couple of strategies you can consider:
- Improve the performance by increasing the number of database (global) buffers (and system memory).
- Long running reports or extracts can be moved out of business hours.
- Long running read only reports, batch jobs or data extracts can be run on a separate shadow server or asynchronous mirror to minimise the impact on interactive users and to offload system resource use such as CPU and IOPS.
Usually low PhyRds is a good thing and it's what we aim for when we size systems. However if you have low PhyRds and users are complaining about performance there are still things that can be checked to ensure storage is not a bottleneck - the reads may be low because the system cannot service any more. We will look at storage closer in a future post.
Summary
In this post we looked at how graphing the metrics collected in pButtons can give a health check at a glance. In upcoming posts I will dig deeper into the relationship between the system and Caché metrics and how you can use these to plan for the future.
Comments
Murray, thank you for the series of articles.
A couple of questions I have.
1) Documentation (2015.1) states that Rdratio is a Ratio of physical block reads to logical block reads,
while one can see in mgstat log Rdratio values >> 1 (usually 1000 and more). Don't you think that the definition should be reversed?
2) You wrote that:
If you do see high PhyRds on your system there are a couple of strategies you can consider:
...
- Long running read only reports, batch jobs or data extracts can be run on a separate shadow server or asynchronous mirror to minimise impact on interactive users and to offload system resource use such as CPU and IOPS.
I heard this advice many times, but how to return report results back to primary member? (ECP) mounting of remote database that resides on primary member is prohibited on backup member, and vise versa. Or these restrictions does not apply to asynchronous members (never played with them yet)?
I believe the correct statement is that Rdratio is the ratio of logical block reads to physical block reads, but is zero if physical block reads is zero.
Thanks! Yes I wrote the wrong way around in the post. I have fixed this now.
Rdratio is a little more interesting — it is the ratio of logical block reads to physical block reads.
Don't you think that zero values of Rdratio is a special case, as David Marcus mentioned?
In mgstat (per second) logs I have at hand I've found them always accompanied with zero values of PhyRds.
The latest Caché documentation has details and examples for setting up read only or read/write asynchronous report mirror. The asynch reporting mirror is special because it is not used for high availability. For example it is not a DR server.
At the highest level running reports or extracts on a shadow is possible simply because the data exists on the other server in near real time. Operational or time-critcal reports should be run on the primary servers. The suggestion is that resource heavy reports or extracts can use the shadow or reporting server.
While setting up a shadow or reporting asynch mirror is part of Caché, how a report or extract is scheduled or run is an application design question, and not something I can answer - hopefully someone else can jump in here with some advice or experience.
Posibilities may include web services or if you use ODBC your application could direct queries to the shadow or a reporting asynch mirror. For batch reports or extracts routines could be scheduled on the shadow/reporting asynch mirror via task manager. Or you may have a sepearte application module for this type of reporting.
If you need to have results returned to the application on the primary production that is also application dependant.
You should also consider how to handle (e.g. via global mapping) any read/write application databases such as audit or logs which may be overwritten by the primary server.
If you are going to do reporting on a shadow server search the online documentation for special considerations for "Purging Cached Queries".
Murray thanks for your articles.
But I think, should be mentioned metrics related to Write Daemon too, such as WDphase and WDQsz. Some time when our system looks works too slow, it may depends how quickly our disks can write. And I think in this case it is very usefull metrics. In my own experience I saw when in usual day our server started to work to slow in we saw that writedaemon all time was in 8 phase, and with PhyWrs we can count how many blocks were really written on a disk, and it was not so big count in that time, and so we found a problem in our storage, something related with snapshots. And when storage was reconfigured, our witedaemon continued to work as before quickly.
There are several more aticles to come before we are done with storage IO ![]()
I will focus more on IOPS and writes in comming weeks. And will show some examples and solutions to the type of problem you mentioned.
Thanks, for the comment. I have quite a few more articles (in my head) for this series, I will be using the comments to help me decide which topics you all are interested in.
Just one thing; one good tool to use on Linux is dstat.
It is not installed by default, but once you have it (apt-get install dstat on Debian and derivates, yum install dstat on RHEL), you can observe the live behavior of your system as a whole with:
dstat -ldcymsn
It gives quite a lot of information!
Would it be possible to fix the image links to this post?
Hi Mack, sorry about that, the images are back!