Debugging 101: Your First Breakpoint and Tracing Variables in VS Code
In this article, we will discuss all the debugging tools included in the Microsoft Visual Studio Code IDE.
What will be covered:
- Breakpoints
- Watch window
- Call Stack
Let's start by learning about debugging requirements!
Prerequisites
There are two plugins (extensions) for debugging ObjectScript:
The first is part of the InterSystems ObjectScript Extension Pack. The second is Serenji, a standalone plugin that provides an editor, file manager, and debugging functionality. Both plugins can be installed from the plugin store. To activate key functionality, Serenji requires a license. For this article, we'll use the InterSystems ObjectScript Extension Pack to reduce the learning curve. After you've mastered the basics, you can consider purchasing a paid license for Serenji.
You need:
- The latest version of Microsoft Visual Studio Code IDE
- Installed InterSystems ObjectScript Extension Pack plugin (after installing Visual Studio Code)
- InterSystems IRIS instance. You can choose between Docker version or installation kit. (you have to be registered within Developer Community ecosystem)
How to connect your IRIS to Microsoft Visual Studio Code IDE you can read here.
Setting up the debug function
Typically, the configuration file is generated automatically after debugging begins. It will look like this:
{
    "configurations": [

    {
        "type": "objectscript",
        "request": "launch",
        "name": "ObjectScript Run current routine",
        "program": "${file}"
    }
    ]

}
Where type is the language of the code being debugged, request is the debugging start option (launch - starts and executes the code or attach - attaches to the already running code), name is the debugging identifier, program is the name of the class and method being debugged (in this configuration, an open file is picked up).
Breakpoint
Any program code is executed from top to bottom, line by line. When debugging, it's important to understand the program's state at any given moment, including the values of local and global variables, the opening and closing of files, web connections, and so on.
Breakpoint is a debugging tool that allows you to pause program execution at a specific line to pinpoint unwanted changes in the program's state. Getting started with debugging in Visual Studio Code is very simple. Let's say we have the following code:
Class Test.MyFile Extends %RegisteredObject
{

ClassMethod TestVar() As %Integer
{
    set randomNum = $RANDOM(10)
    return randomNum
}

ClassMethod MyMethod() As %Integer
{
    set randomNum = ..TestVar()
    set numVar = 2
    set numDivision = randomNum / numVar

    return numDivision
}
}
We need to understand the value stored in the randomNum variable in the MyMethod() method. It is returned by the TestVar() method. We set a breakpoint before performing the arithmetic operation with this variable on line 15 and click the Debug button. If you don't set a breakpoint, debugging will simply execute the code without outputting anything to the console.
We can see the value of a given variable immediately after starting debugging! Very convenient. Next, we can step through the entire program line by line by pressing the Step into button or F11.
Great! Now we know the values of the variables at every step of the code execution.
We can loop through variables within a loop in the same way. Let's take the following code:
Class Test.MyFile Extends %RegisteredObject
{

ClassMethod LoopMethod() As %List
{

    set objList = $LB("string", 1, {"name":1})
    for i=1:1:$LL(objList){
        set item = $LG(objList, i)
    }

    return objList
}

}
Let's set a breakpoint at the beginning of the method and start debugging. Then, using the “Step into” button on the debugging panel placed at the top of IDE, we move down the program and observe the values assigned to the item variable. We also see the values of all other variables within the program, including the iterator variable i, which in this case is equal to 2.
So, moving further along the loop, you can track what value will be assigned to the item variable for each step of the loop.
Watch window
We can also monitor a variable's state during debugging by adding it to watch. In watch mode, we can apply methods to a variable and measure its state in each iteration. For example, consider the following code:
Class Test.MyFile Extends %RegisteredObject
{

ClassMethod WatchAVariable() As %List
{
    set list = ""
    set randomNum = $RANDOM(100)
    for int=randomNum:randomNum:100000{
        set list = list _$LB(int)
    }

    return list
}
}
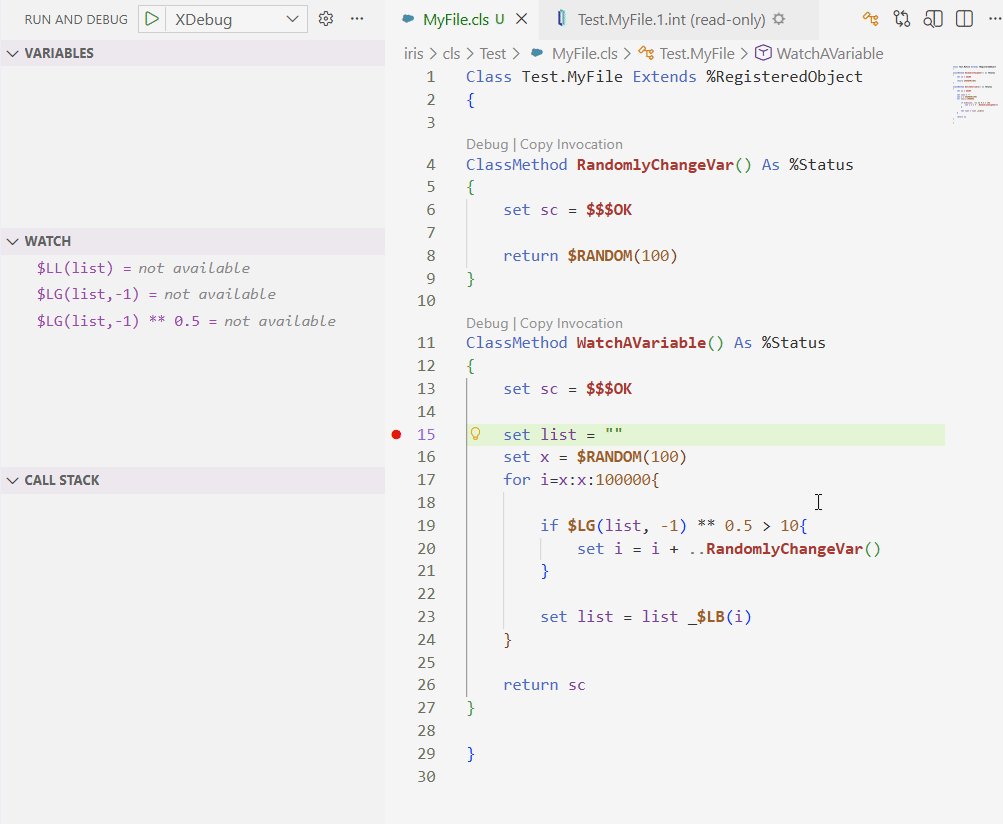
And we will write three methods for the list variable:
We want to keep track of the length of the list $LL(list), the last number added $LG(list, -1) and its square root $LG(list, -1) ** 0.5. We step inside the loop and get the first values:
By defining functions in the watch window, we can see detailed debugging information! Additionally, the variables window still displays the values of the int iterator variables and the loop step. Very convenient!
Call stack window
Notice the “Call Stack” window at the very bottom. This window shows the order of function calls in your code. In our current state, we have two items: the loop and the assignment of variables WatchVariable+7 and WatchVariable+6, respectively. But everything here is pretty self-explanatory. Let's add some more logic:
Class Test.MyFile Extends %RegisteredObject
{

ClassMethod RandomlyChangeVar() As %Integer
{
    return $RANDOM(100)
}

ClassMethod WatchAVariable() As %List
{

    set list = ""
    set randomNum = $RANDOM(100)
    for int=randomNum:randomNum:100000{
        set list = list _$LB(int)
        if $LG(list, -1) ** 0.5 > 10{
            set int = int + ..RandomlyChangeVar()
        }
    }
    return list
}


}
We've added a new method, RandomlyChangeVar(), which will change the next int variable if the square root of the last number is greater than 10. We loop until the state of the variables satisfies the logical condition (thats a GIF):
_anim_preview.jpg)
Note the values of the square root function and the order of function calls in the call stack. As soon as the square root exceeded 10, the RandomlyChangeVar() function was immediately called! Furthermore, by measuring the length of the list, we were able to track how many loop steps it took to reach the desired logical condition. This makes it easy to track the order and conditions of calling multiple functions, no matter how complex the logic.
That's it! You now mastered VSCode ObjectScript Debugging.
In this article, we took a detailed look at the debugging feature in VSCode. We set our first breakpoint, tracked variable values.
Comments
Thank you, it's very informative and well-exemplified!
The last part about the "call stack" was supposed to be explained with a GIF, but the DC website posted a static image. I apologize for the inconvenience, I corrected it in the article and repeated it here (just in case). As I said, keep an eye on the call stack window and pay attention to changes.