K-Means clustering of the IRIS Dataset
Hi all. Today we are going to use k-means algorithm on the Iris Dataset.
Note: I have done the following on Ubuntu 18.04, Apache Zeppelin 0.8.0, python 3.6.5.
Introduction
K-Means is one of the simplest unsupervised learning algorithms that solves the clustering problem. It groups all the objects in such a way that objects in the same group (group is a cluster) are more similar (in some sense) to each other than to those in other groups. For example, assume you have an image with a red ball on the green grass. K-Means will split all pixels into two clusters. The first cluster will contain the pixels of the ball, the second cluster will contain the pixels of the grass.
IRIS Dataset is a table that contains several features of iris flowers of 3 species. Species can be "Iris-setosa", "Iris-versicolor", and "Iris-virginica". Each flower contains 5 features: Petal Length, Petal Width, Sepal Length, Sepal Width, and Species.
Check requirements
First of all, let us check all the requirements. Paste "which python3" in the terminal:
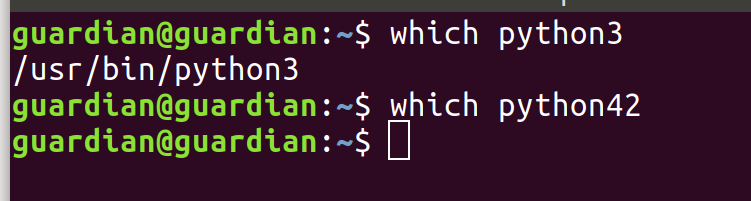
If python 3 is installed, you will see the first path. If it is empty (like "which python42"'s output), paste the following in the terminal:
sudo apt-get update
sudo apt-get -y upgrade
sudo apt install python3
sudo apt-get install -y python3-pip
Next, install pyspark:
pip3 install pyspark
Change zeppelin.pyspark.python in Spark interpreter settings to path to your "which python3"

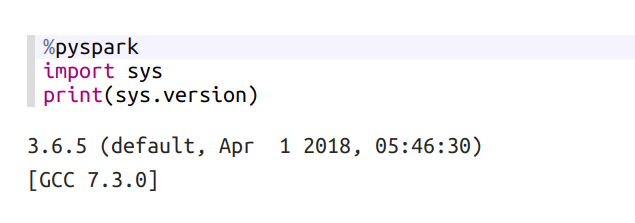
And finally, create new note with spark interpreter and paste this in a new paragraph and run:
%pyspark
import sys
print(sys.version)
If everything is fine, you will see the python version:
Clustering
Setup your InterSystems IRIS to let it work with Zeppelin and Spark. E.g. see my previous article about InterSystems IRIS, Apache Zeppelin, and Apache Spark connection.
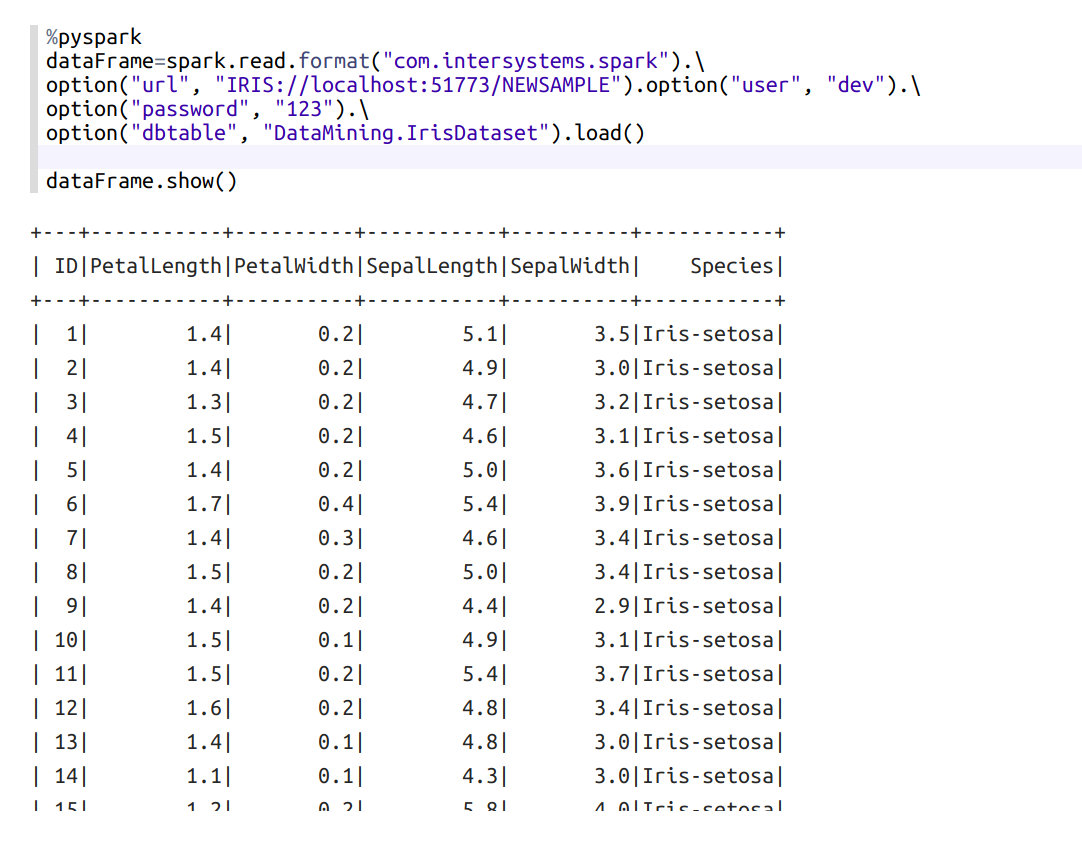
First, load the IRIS dataset:
If you want to see what Species does it have, paste this in a new paragraph and run:
%pyspark
dataFrame.select("Species").show(150)
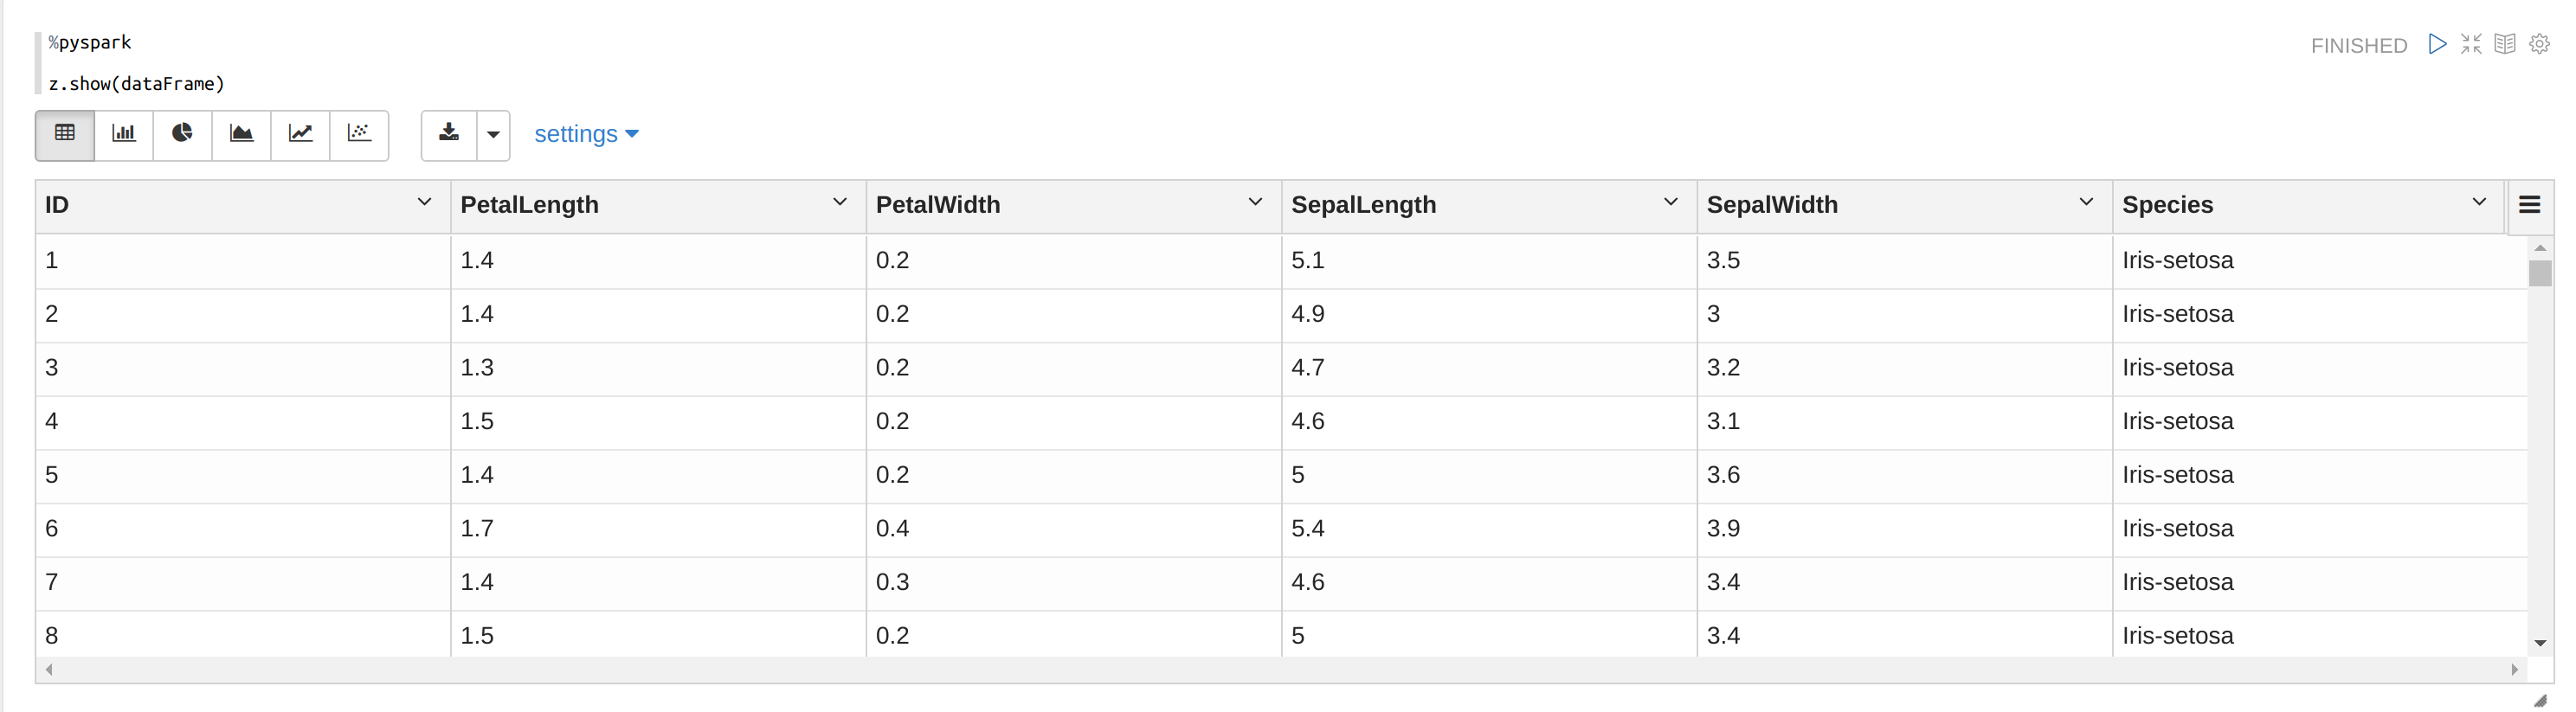
Before we will continue, it will be a good idea to consider what data do we have. Add a new paragraph and paste this and run:
%pyspark
z.show(dataFrame)
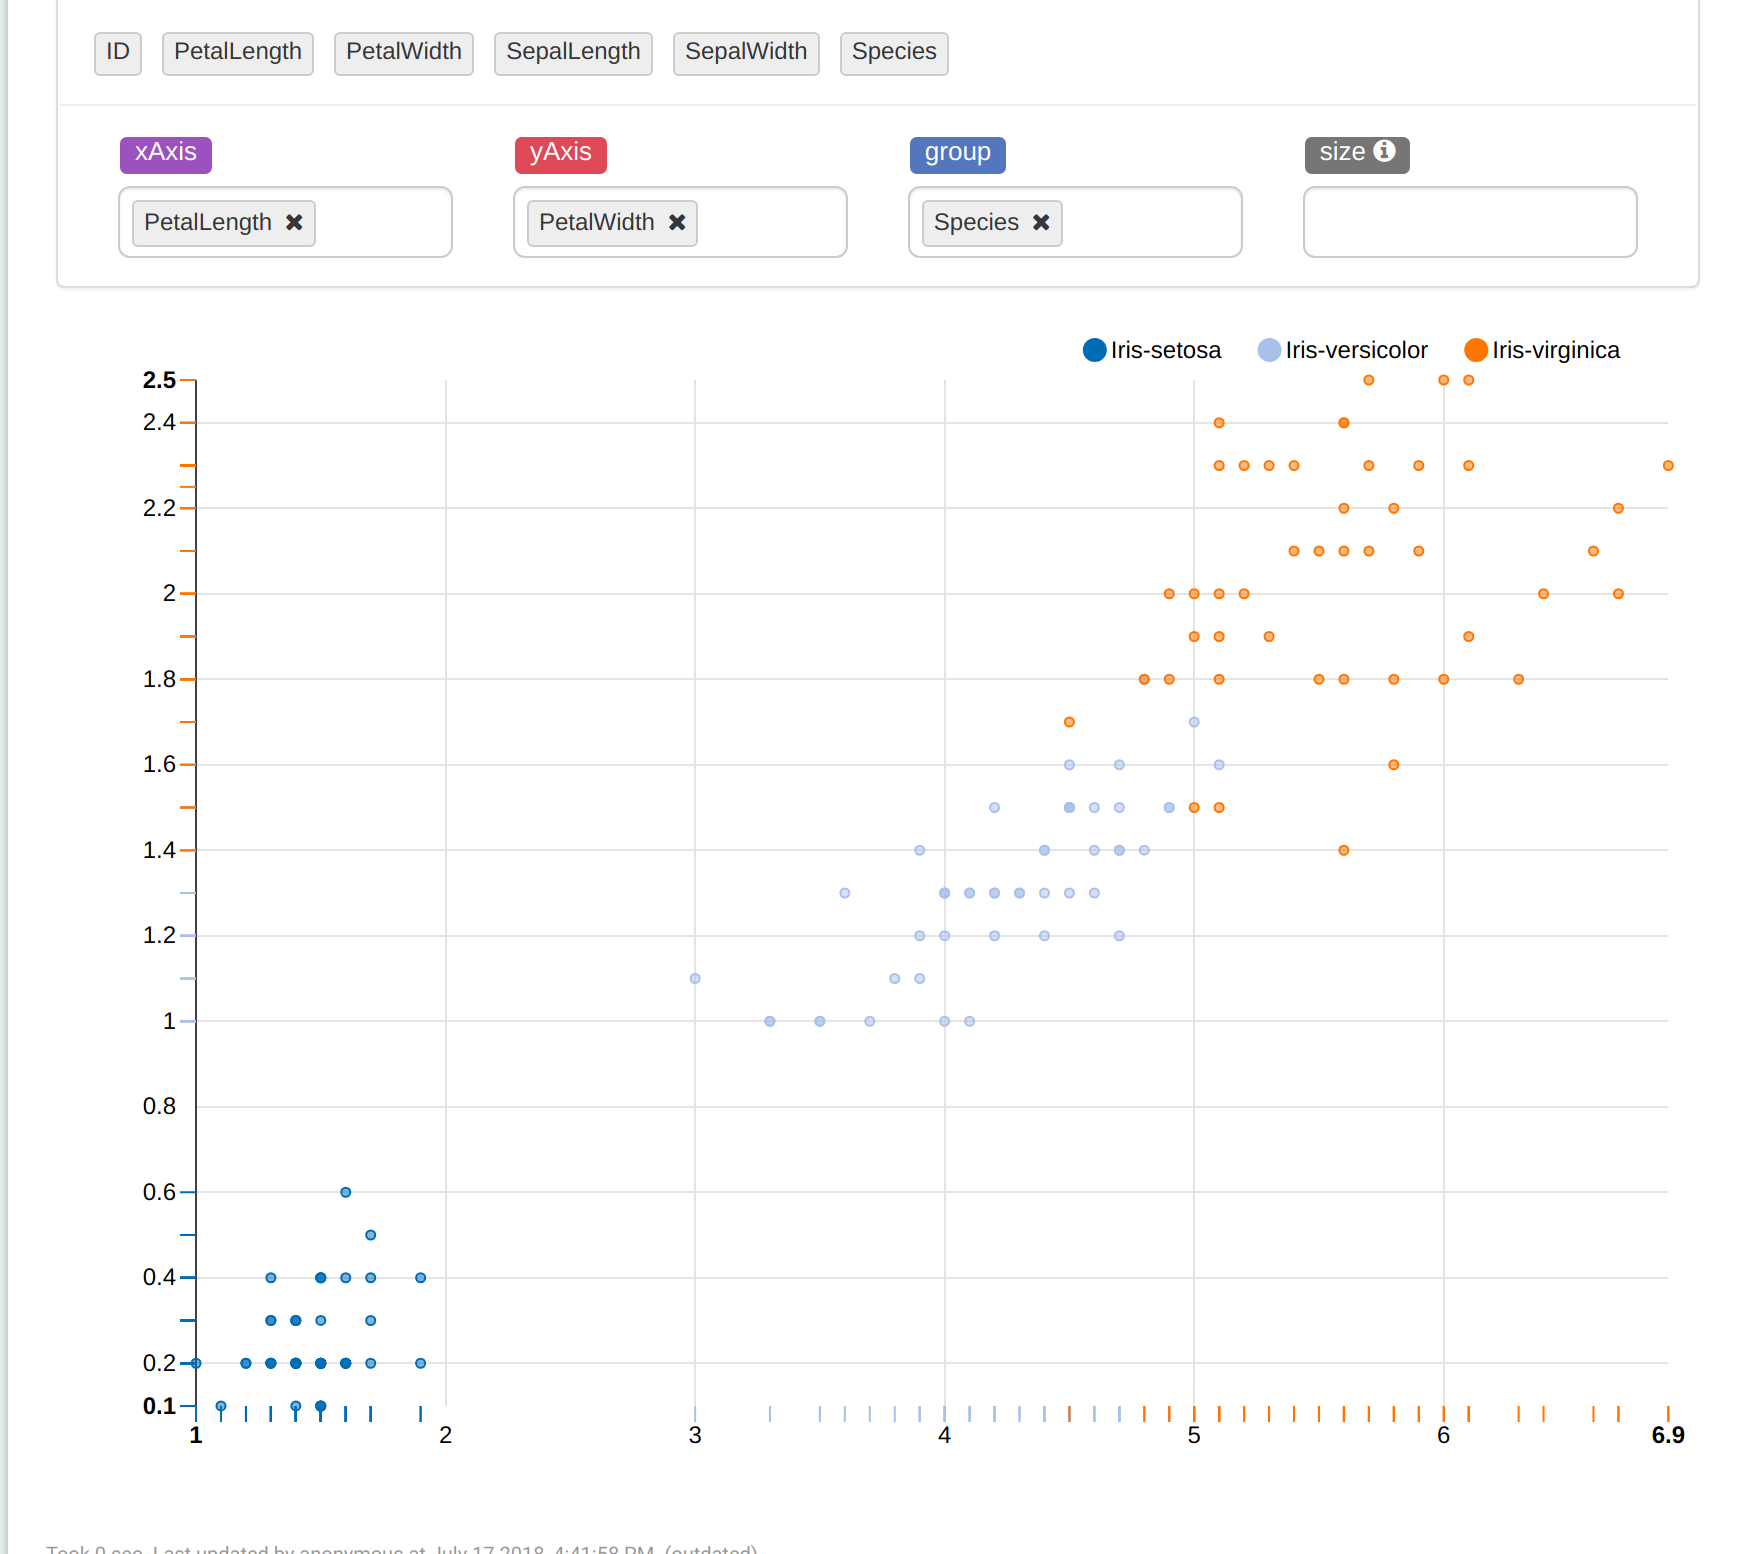
As you can see below, the table has 5 features: PetalLength, PetalWidth, SepalLength, SepalWidth, and Species.
Choose Scatter Chart. Here we can see clusters in the image below (we cannot see a completely image because of 4d vectors). If you want to look at clusters from an another perspective, change the parameters of xAxis and yAxis.
So, our purpose is to predict the species of flowers using features. Add a new paragraph and paste the following in there and run:
%pyspark
from pyspark.ml.linalg import Vectors
from pyspark.ml.feature import VectorAssemblerassembler = VectorAssembler(inputCols = ["PetalLength", "PetalWidth", "SepalLength", "SepalWidth"], outputCol="features") // it makes a vector with 4 parameters mentioned in inputCols and name it as outputCol.
irisFeatures = assembler.transform(dataFrame) // this will add to the table outputCol column with vectors.
irisFeatures.show(5)
Next, paste this in a new paragraph and run:
%pyspark
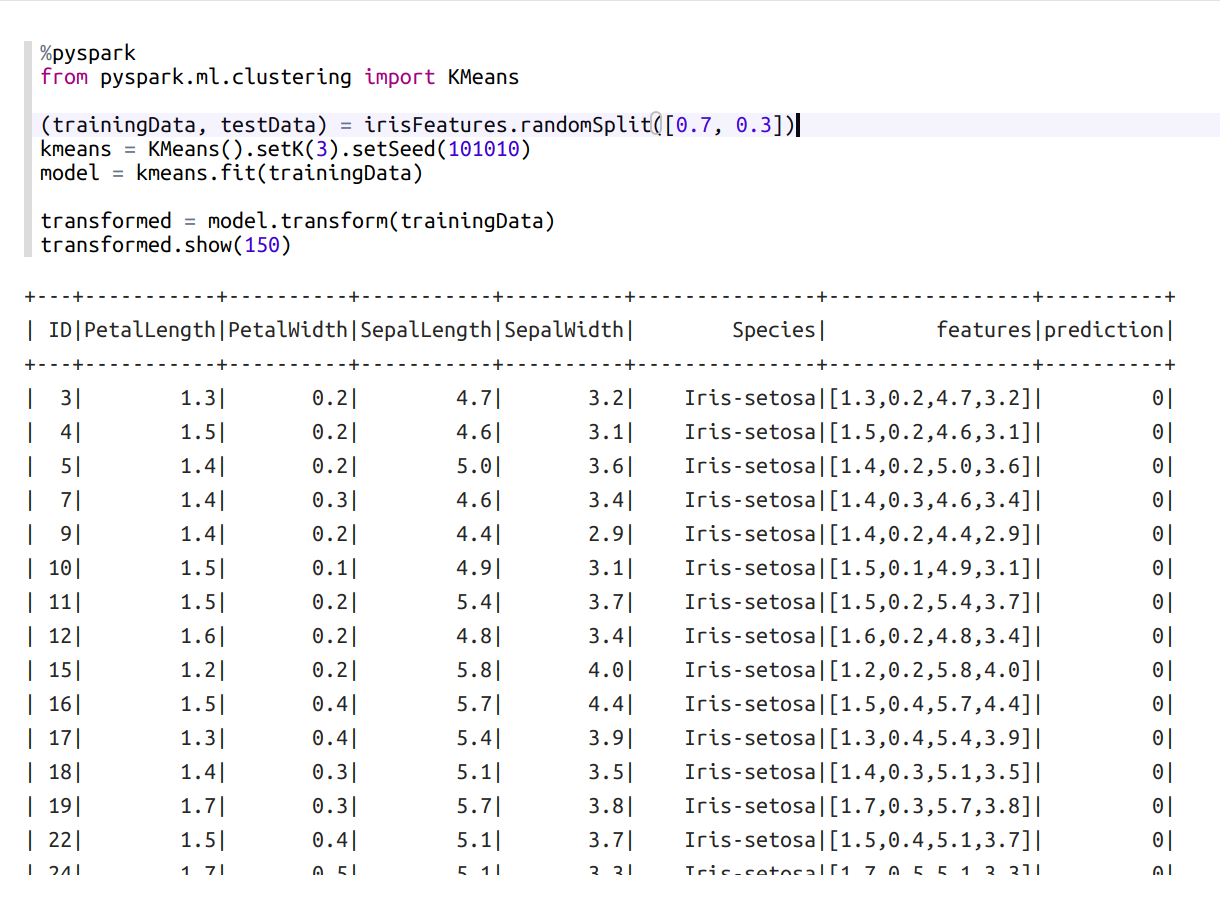
from pyspark.ml.clustering import KMeans(trainingData, testData) = irisFeatures.randomSplit([0.7, 0.3]) // split data into two parts randomly
kmeans = KMeans().setK(3).setSeed(101010) // KMeans model with 3 clusters. setSeed makes reproducible results.
model = kmeans.fit(trainingData) // train kmeans modeltransformed = model.transform(trainingData) // add a new column to the table with predicted results
transformed.show(150)
Use model on our testData:
%pyspark
predictions = model.transform(testData)
predictions.show(151)
And count the accuracy of model:
%pyspark
SpeciesAndPreds = predictions.select("Species", "prediction").collect()
def getCluster(specie):
if specie == "Iris-setosa":
return 0
elif specie == "Iris-versicolor":
return 1
else:
return 2def getAccuracy(flowers):
counter = 0;
for flower in flowers:
if getCluster(flower[0]) == flower[1]:
counter += 1
return counter / len(flowers)accuracy = getAccuracy(SpeciesAndPreds)
print("accuracy is " + str(accuracy))// My result is 0.9090909090909091
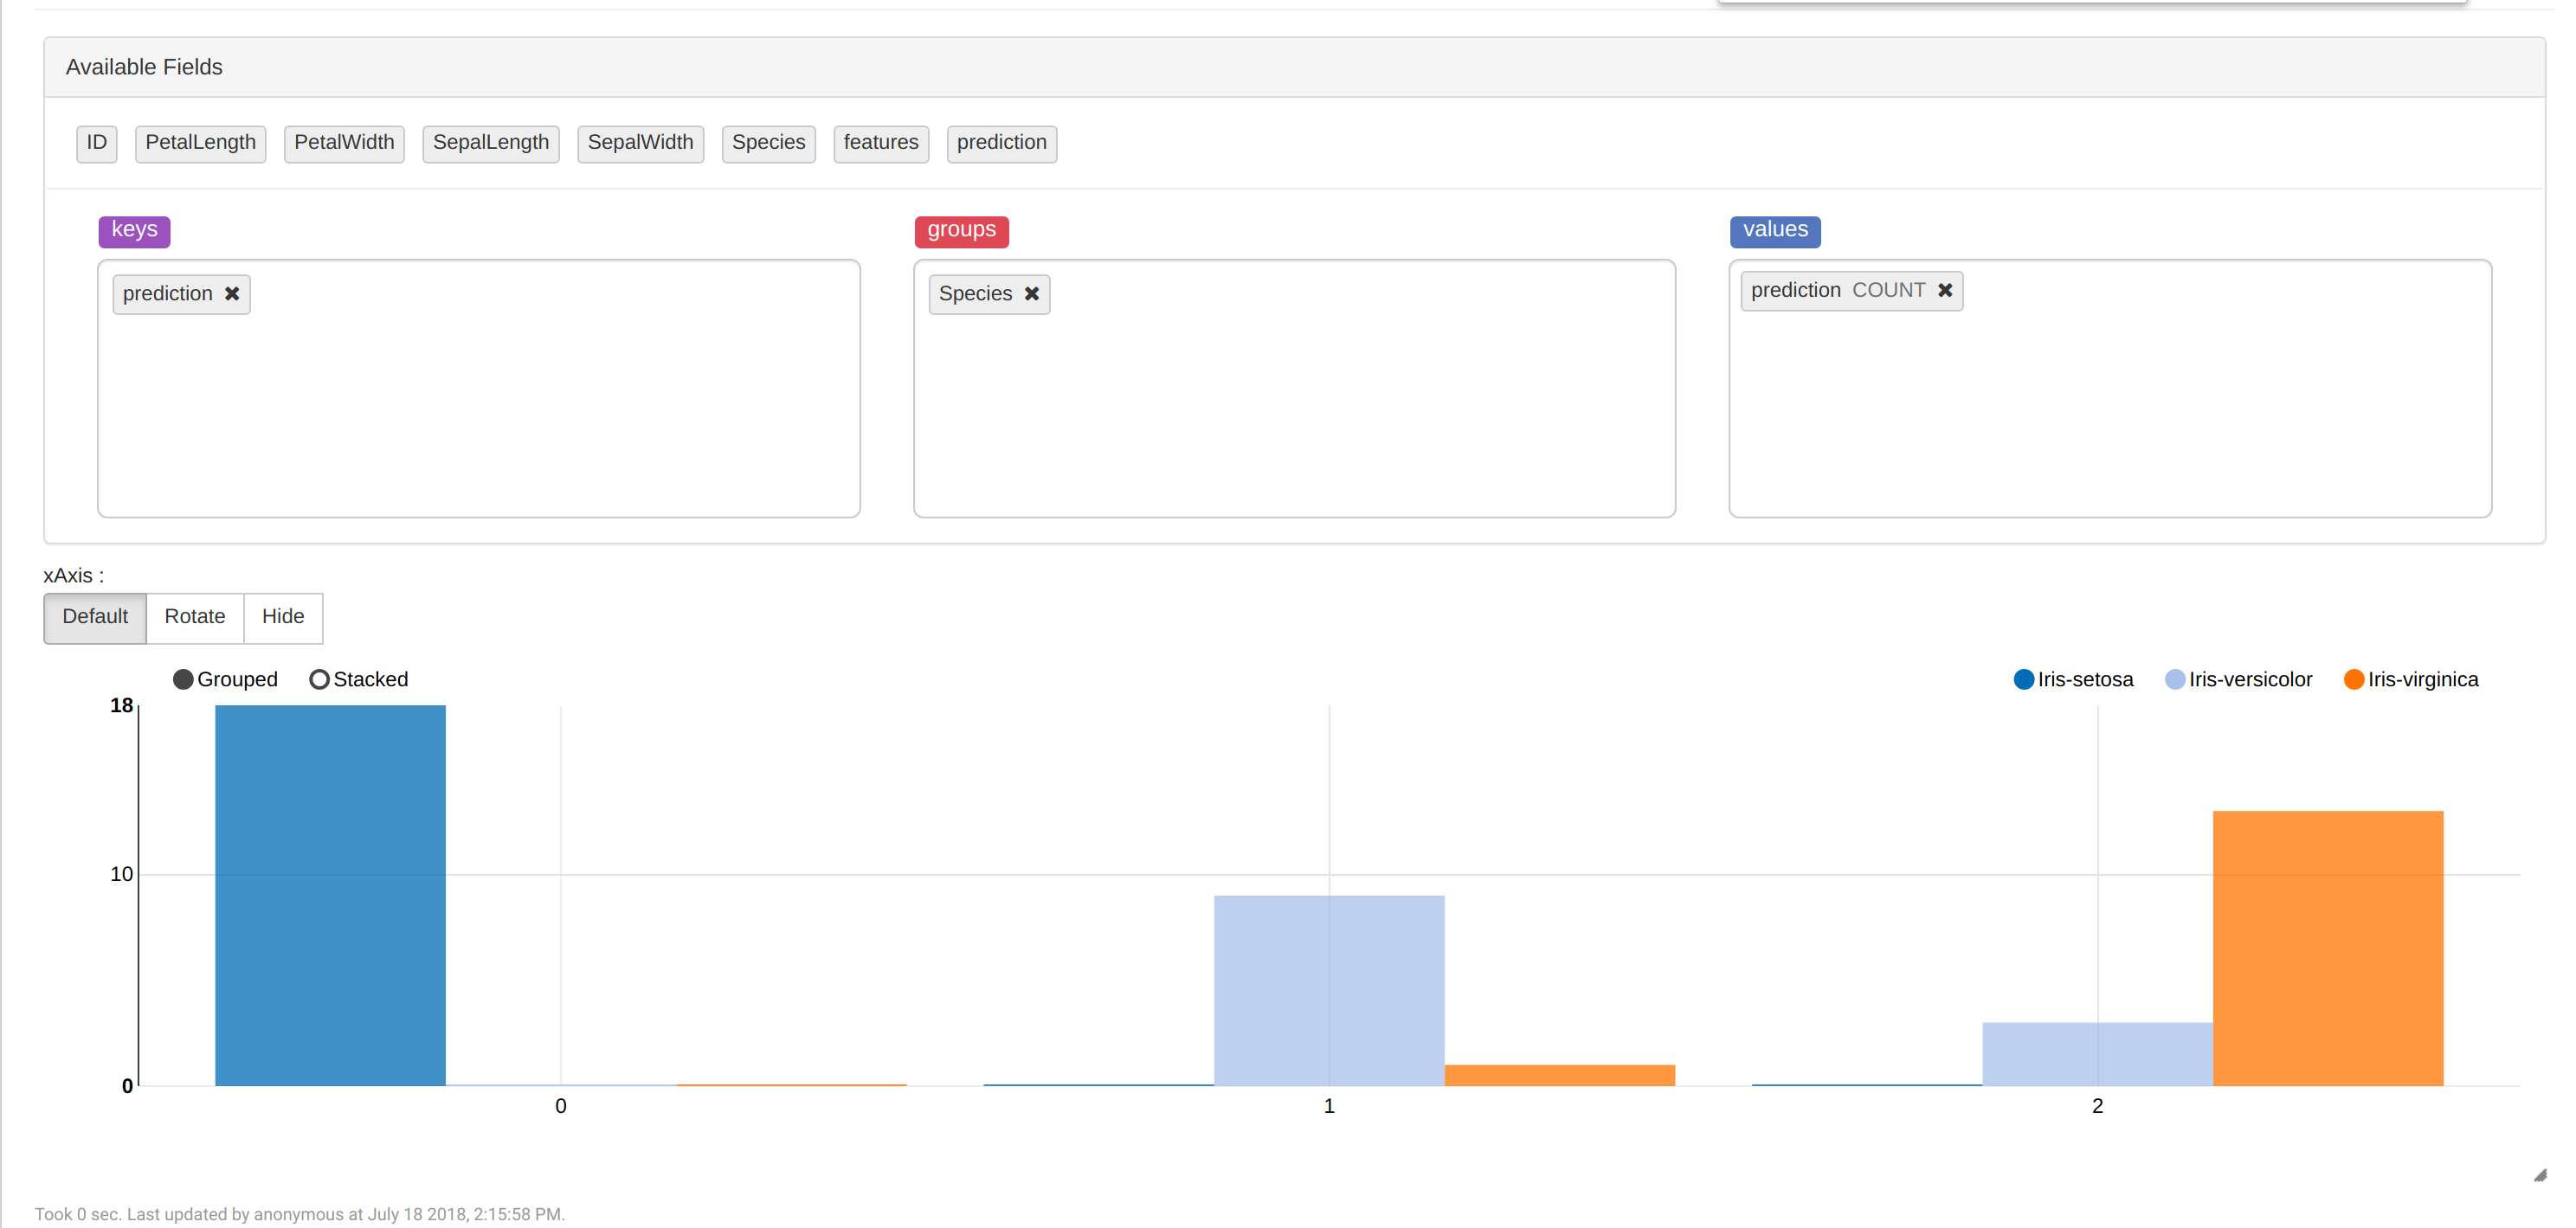
To see how many flowers are in each cluster, use "z.show(predictions)" and choose Bar Chart:
Conclusion
We made the model that predicts species of iris flowers in InterSystems IRIS pretty accurately (accuracy > 0.9). Also we noticed that the "Iris-setosa" is separable and "Iris-virginica" and "Iris-versicolor" are not separable on K-Means algorithm. So, it would be a good idea to use something else to increase accuracy.
Links
The way to launch Apache Spark + Apache Zeppelin + InterSystems IRIS
Spark SQL, DataFrames and Datasets Guide
Machine Learning library guide
Clustering (but this API for RDDs, so just look at the relevant information about algorithms)