InterSystems Reports. Formulas, parameters, labels
In this article, we will explore the use of parameters, formulas and labels in Logi Report Designer (formerly Logi JReport Designer). What are they for and how to create them?
Using the basic functionality of InterSystems Reports Designer, parameters, formulas and labels, you can significantly improve the detail and information content of the generated report. In addition, these tools allow you to automate some of the processes, which greatly speeds up and facilitates the creation of reports.
Let's analyze each tool separately now.
Parameters are individually configurable variables. They can store both static and dynamic data. For a dynamic parameter, you can set your own SQL query, which will be independent of the SQL query of the main dataset. In this way, you can output data without creating multiple datasets, thus keeping your design organized and clean. Parameters can be used both as a part of functions and SQL queries and as an independent indicator with the following syntax: “@YourParameter”. This quality is simply indispensable when the accuracy and detail of data are required.
A static parameter is a predefined value or a list of values used as a condition or filter on the output. A static parameter can also be used in SQL queries, functions and labels using the same syntax: “@YourParameter”.
Formulas are fully programmable functions in the Java language. This powerful tool greatly expands the possibilities of analytics, allowing you to perform complex calculations and set logical conditions for the output data. Formulas are created in the built-in Java IDE inside Logi with a built-in set of functions for working with such data types as Array, Date / Time, Financial, Math, String, etc. Formulas can work with all data available in InterSystems Reports. The built-in IDE understands parameters, calculated fields, and even other formulas.
A label is a text widget. It serves to display any lowercase characters and variables. Its purpose speaks for itself: it is used in headers and footers, as a custom legend for a chart or table, in a word, and wherever data need to be titled. Just like all other InterSystems Reports tools, the label is a very flexible widget. It can be placed anywhere on the page, inside a graph or table.
Here we will look at examples of the most basic use of these tools.
We will create a parameter that returns the number of developers out of the total number of members of the InterSystems community.
In order to create a parameter, you need to click on the Catalog Manager button in the upper left corner of the toolbar.

In the window that opens, on the left, select the Parameters item, then click on the “New Parameter” button in the upper left corner.

The parameter creation window will open.

In the first line, we need to set the parameter name. It is recommended to choose a name that reflects the purpose of the parameter as accurately as possible and at the same time is short enough. It is necessary because during the development process, you will create an abundance of different parameters, and there is a risk of overloading the lists of parameters and functions. In this article, we will analyze the dynamic parameter, so in the second line in the Value Setting we will select Bind with Single Column. In the next Data Source line, we will choose the table from which the selection will occur. In our case, it is Members. Then in the Bind Column, we will select the columns from which we will return the value.
There isn't a separate column that can count the number of developers for us in the Members table. Yet, thanks to the ability to set a special SQL query, we can establish a condition for this particular selection. To do that, scroll down the list of properties, find the line Import SQL and click on it.

A request creation window will appear. It has already pre-recorded the selection string of the members_count column - the total number of participants. We only need to add the condition “where Developer = 1”. We can check the request by clicking on the Check button, and if it is successful, you should click OK.
After completing the previous steps, click OK in the parameter creation window, and the new Developer_member parameter will appear in the directory on the left. At this point, close the Catalog Manager window and try the newly created parameter. To do that, drag it to the report page and click View. After completing this step, you will be prompted to accept the value of the parameter taken from the current database, so click OK.
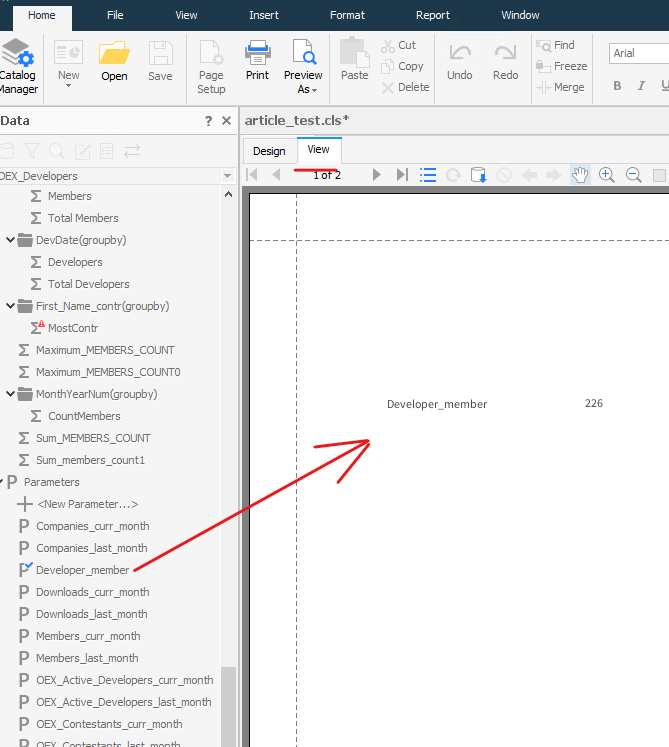
Ready! Now we can see how many people in the community are developers. This setting will automatically get updated every time the data changes.
Now we will create a formula. This formula will calculate the percentage of developers compared to the total number of participants.
To do that, you should repeat the same steps we took when creating the parameter. Let me remind you. Click on the Catalog Manager, select Formulas, and then New Formula in the upper left corner.

Before the formula creation window appears, we will be prompted to enter a name for the formula.
After that, the IDE will open for you to write code in Java. Built in InterSystems Reports, the compiler allows you to write short functions without defining classes and methods. In order to calculate the percentage, we need to divide our new parameter by the total number of members and multiply by 100. We have already created the CountTotalMembers indicator. We did it with the tool called InterSystems Adaptive Analytics (powered by AtScale). You can find out more about it here (link).
Thus, we got the following formula. Pay attention to the function allowing you to write comments to the code. Well-documented code will make it easier for others to work with your formulae.

After writing, you can check if the resulting code has any errors by clicking the checkmark button on the toolbar. Toolwill check whether the syntax is correct and whether the specified parameters are present.
After the function has been tested, it can be saved. To make that happen, click the Save button, and the formula will appear in the catalog.
Following the parameter example, our next step will be to drag the new formula onto the page and find out the share of developers in the total number of participants.
This function can be utilized as an indicator for graphs and tables. I will give you an example of using our new formula in a bar graph. You can learn more about charts and how to create them here (link).
In this example, I used a new formula and derived the proportion of developers over the past five months.

It's a bar graph, with the formula developers_to_members on the y-axis and the dimension month_year_num on the x-axis. It turned out a very visual trend and we did it in just a few minutes.
Now it is time to look at the labels.
They are embedded into the report page from the Insert tab with the Label button.

A window to enter the text will appear on the page.

The built-in functionality allows you to edit many parameters for the new Label. In this article, we used this widget to enhance our new table.

There are a lot of parameters placed on the panel on the right that can help you design a label. To make them appear, select the Label widget.

To set the borders for the widget, scroll down to the Border category. Select all 4 borders: Bottom Line, Left Line, Right Line, and Top Line, and set all of them to Solid.

In order to fill the background, you need to scroll through the properties to the Color category and select the desired shade. The same can be done in the Format tab on the toolbar at the top.
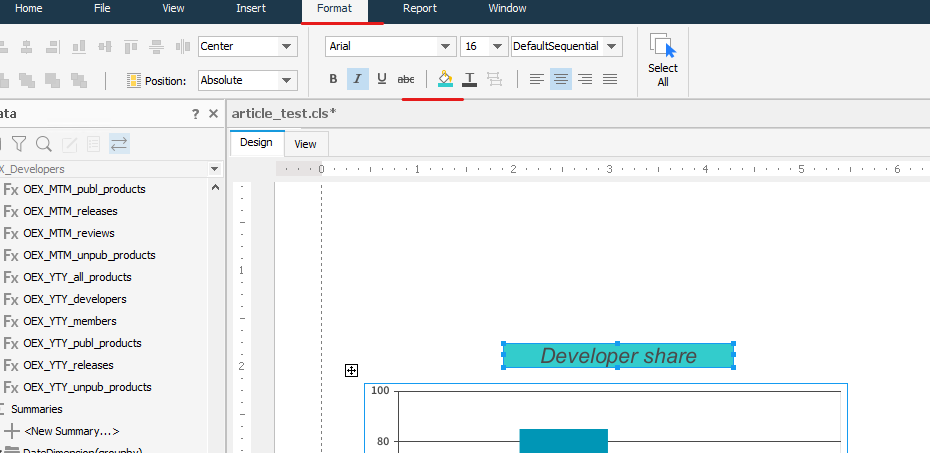
If you wish to select the font size, stay on the same Format tab, click the drop-down menu with sizes, and pick the desired one. It can also set the font type and the location of the text inside the widget.
For more precise positioning relative to other widgets, use the coordinates the Label has inside the page. By default, sheet sizes are in inches. The positioning settings are located in the Geometry category on the widget's properties panel on the left.

In this article, we tried to cover three basic features of InterSystems Reports (powered by Logi Report). That is why by now, we expect you to know how to create formulae, parameters, and labels with great confidence.
Comments
Great article! @Jean Millette / @Timothy Leavitt - are we leveraging all of these features in our use of InterSystems Reports?
Hi,
I think you missed some links references:
.png)
.png)
Btw, great article! :)