How we reduced the report generation time by 28 times
Colleagues, hello!
In this article, I will tell you how we reduced the report generation time from 28 minutes to 1 minute. Let me tell you how we achieved this.
I hope that if necessary you will be able to reproduce the same results for yourself. Useful links will be inside this post, so read to the end.
Let's start.
Report
We are reporting for a company using Adaptive Analytics and InterSystems Reports Server. Previously, this report was generated in the form of screenshots from DeepSee. In general, it was not bad, but it took a lot of time and did not look very readable. The report itself consists of 12 pages, in PDF format.
In general, the data is not too large for it to make the report generation take a lot of time.
Source Data
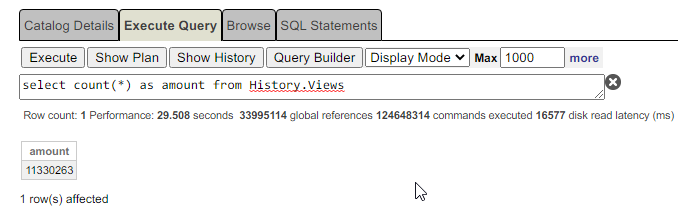
However, there is one table that contains 11,330,263 rows at the time of writing. Not so critically much, but it creates delays. Even the query to count the number of rows takes almost 30 seconds.
Initially, the system interaction scheme looked like this:
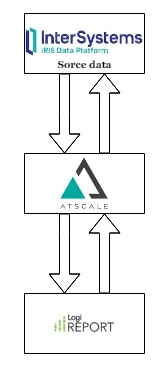
Atscale created its own data cache, which led to an increase in performance.
Logi used its own data cache, which slightly speeded up the development of reports.
But in general, this still led to the fact that the report was formed in 28 minutes.
Given that the report contained 12 pages, this is quite slow.
We even added new tabs on purpose and copied widgets from the report there so as not to generate the entire report during development or debugging. Perhaps this is such a life hack when developing on Logi, or is it a normal development method. In general, we used it at work.
At the time the report was generated, hundreds of requests were leaving Logi to Atscale, and a few more were leaving Astcale to IRIS. Some individual queries were up to 4 minutes long. Several times it happened that requests generally took off on a timeout.
Then we realized that this could not continue. And we connected the main feature of Adaptive Analytics and the scheme became like this:
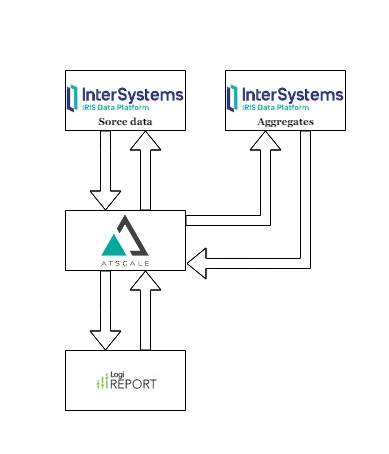
This is a UDAF feature. In other words, this User Defined Aggregate Functions, but in fact these are aggregate tables in which, upon request and periodically, aggregated values for measures are stored. And what is most interesting, these aggregates are created and updated automatically by Atscale.
To enable aggregates, we compiled the isc-aa-udaf package, which is currently in a private repository, because it cannot be freely distributed under Atscale's terms of use.
After turning on the aggregates, service tables were created for several minutes, the aggregates were calculated, in general, the database was loaded. But then the real relief began. The system began to work as it should. Requests, which were previously formed for 4 minutes, began to be formed in 5 seconds. Caching has become faster.
As a result, the report that took 28 minutes to form began to form in 1 minute.
It is worth noting that such an increase is more characteristic of stable, production systems in which the cube is relatively stable and aggregates are collected more and more. When the cube structure changes, the aggregations are rebuilt and recreated on the first request to the changed cube.
What is done
Basically what has been done:
- IRIS has Adaptive Analytics UDAF installed
- Namespace created in IRIS to store aggregates
- IRIS connected to Atscale
- CUSTOM FUNCTION INSTALLATION MODE = Custom Managed enabled in Data Warehouse
- Adaptive Analytics has created a cube with data.
- Report created in Logi
- Tested and measured
Here details:
- InterSystems IRIS has installed the necessary classes for UDAF to work. We have packaged them in a ZPM package called isc-aa-udaf, which is stored in the zpm registry pm.intersystems.com. This registry is available to official InterSystems clients
iris command:
zpm “install isc-aa-udaf”
- An optional item aimed at optimizing the use of resources. We added a dedicated namespace to IRIS, which will store pre-calculated aggregate values. The name of this namespace will be required in the next step.
- Connected IRIS to Atscale as a data source for the Cube. Go to Setting, then Data Warehouses, and the last is CREATE DATA WAREHOUSE. in the field number 1 specifies the namespace in which the parsed data is stored


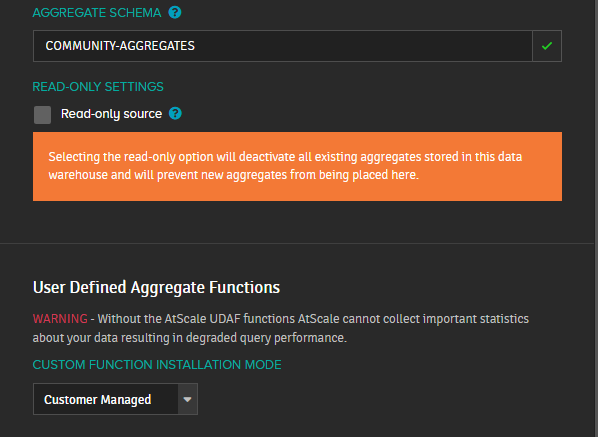
in the field number 2 we specify the namespace created in step 2 for storing aggregates. This value can be identical to the value of 1, in which case the aggregates will be stored next to the data. In this case, the data source cannot be read-only.
- We set CUSTOM FUNCTION INSTALLATION MODE to Customer Managed, since we previously installed UDAF in the first step. If you specify the None mode, then even with UDAF installed, these functions will not be used and there will be no performance gain. If everything is done correctly, then the UDAF check glows green:
- Created a project and a cube using the created Data Warehouse. This is a long and exciting process. I will not talk about this in detail here, several articles have been written about it, including my article: How to easily start working in Adaptive Analytics + InterSystems Reports
- The project published on Atscale creates data source connections for Logi reports. In the previous article, I also described how to create a report. Link here: How to easily start working in Adaptive Analytics + InterSystems Reports
- Testing and measurements. Here it is interesting. I originally designed the report without UDAF enabled. Because of this, some requests were executed for 4 minutes or more. Due to the fact that the report consists of 12 pages, the time to complete the report was on average 28 minutes.

After enabling UDAF, the Atscale system was loading the data source in automatic mode for some time. She herself calculated the actual queries that will be used in the report and prepared pre-calculated values for it. In addition, the Intersystems Report is based on calculated parameters, which are partially cached by the Intersystems Report itself, and the AtScale system gave additional optimization, which cached the results of executing the same queries and returned them instantly, instead of re-sending to the data source.
There is another interesting point in the work of the described bundle: the more often a report is generated, the less time it takes to produce it.
Based on the results of all the manipulations and several measurements, the time for generating a 12-page report began to be 60 seconds, that is, one minute.
The difference was 28 times.
At the same time, similar reports, completely identical in structure, but taking data from other databases, also gave a similar increase in the speed of their construction.
Based on what we saw, we made an unambiguous conclusion in favor of using this bundle in all future projects. Increased development speed. Improved debugging speed. The time of delivery of reports to business consumers of these reports has been reduced.
I hope that in the future we will be able to extract even more performance from the IRIS - AtScale - Logi bundle and be able to share the solutions we found with you.
And if you have information about the performance of your tool chains, I will be grateful if you share it with us.
Comments
Evgeniy, thank you for sharing your experience.
there is one table that contains 11,330,263 rows at the time of writing. Not so critically much, but it creates delays. Even the query to count the number of rows takes almost 30 seconds
Looking just at the number of rows, one apparently can't consider such a table to be a big one.
What was the size (in GB) of the underlining global?
It is about 278 Mb now.
And I have no idea about why it is so slow ))
Based on
.png)
it looks like History.Views may not have indices or at least doesn't have a bitmap index. If the table had a bitmap index it shouldn't take 30 seconds to count the rows. ... but maybe I'm incorrect.... seeing the query plan would have provided that insight.
You report that the now generates in 60 seconds and previously it 28 minutes for a twelve-page report. Was the primary problem /time consumed in gathering the data or something else?
I think that index exists.
The problem was to run queries on 278 Mb table with no visible reasons for 4 minute execution time.
Results of the query execution has a little data, less than 1 Kb.