How to easily start working in Adaptive Analytics + InterSystems Reports bundle
Let's assume that we have already connected a data source to Adaptive Analytics, created a project and added tables there.
Now we will prepare Adaptive Analytics for work. First, we need to select data from tables, to make it available for the future report. To do this, we need to create dimensions from the columns of the tables. Dimensions are usually created to break down our data into categories, such as what city the user lives in, or what month a purchase was made in. However nothing prevents us from creating dimensions from numerical data so that we could apply functions to them in Intersystems Reports Designer.
The tool for creating dimensions is located on the right side of the interface as shown in the image below. To create a new dimension, right-click on the hamburger button located to the right of the "Filter" line and select a "Create Dimension" line as indicated in the picture.
.png)
The following window will appear:
After having created a dimension, you can make it hierarchical. To do that, double-click the left mouse button on the dimension in the left table and get into the hierarchy editor.
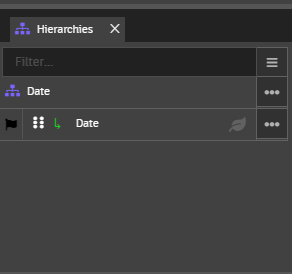
By clicking on the three dots next to the hierarchy, we can create a new dimension within the hierarchy. In the menu, the dimensions can be moved up / down the hierarchy. Thanks to hierarchies, we can make different levels of data details. For example, we can specify how many people have visited the site from the country, region, city.
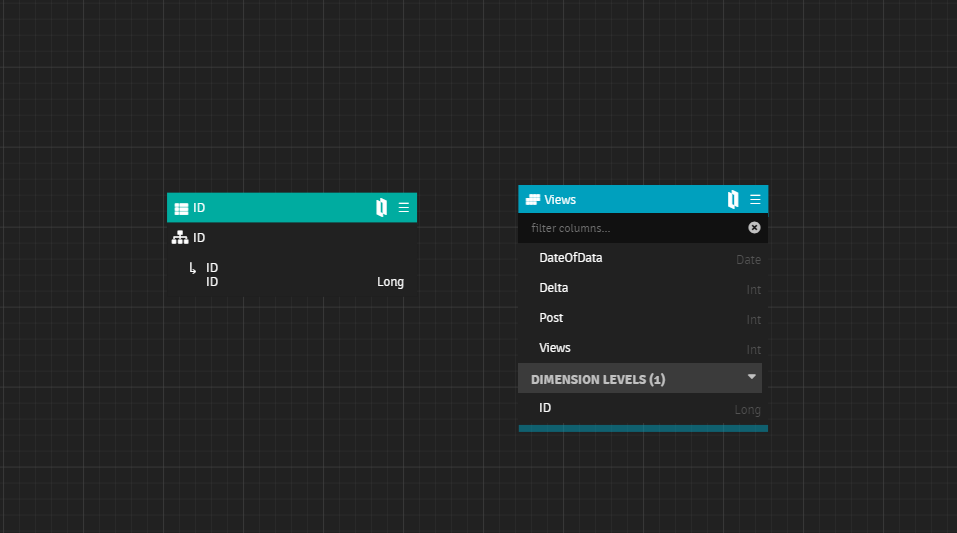
You can use dimensions to create relationships between tables. To do that, you need to drag the desired field of the table using the left mouse button and drop it in the desired highlighted dimension.. The link creation window will appear. Click Save, and our connection will be ready.

In addition to the actual data from the table, in Adaptive Analytics we can create measures based on various operations applied to a specific column. Measures are always a numerical display of data - number of users, amount of purchases, average time spent watching a video, etc.
To create a measure, we apply the same principle as for dimensions but using the "Measures" tab.

By clicking on the hamburger button and selecting "Add measure", we call the following window:


‘Measure name’ is the name that will be displayed in the Adaptive Analytics interface.
‘Query name’ is the name that will be displayed in the Intersystems Reports Designer. It is generated automatically based on the column name, but you can also set it yourself.
‘Description’ is the description visible in Adaptive Analytics.
'Sources' define from which table and which column to take data for the measure.
‘Aggregation Handling’ shows which function we apply to the data. The list of functions can be found below. By default the "Sum" is selected as a value: .png)
‘Data Handling and Formatting’ determines what will happen to the measure if it is used in conjunction with a dimension for which the measure is not defined. You should leave it by default.
‘Visibility in Published Data Sources’ specifies whether this measure will be available in Intersystems Reports Designer.
You can split measures by dimensions. For example, we have a measure that shows the average check, which we have calculated employing the data of a column with daily data for one year. If we distribute the measure over a dimension containing months, we will get the average check for each month.
To find out what is in your data connected to Adaptive Analytics, you can use the Cube Data Preview tool. You can get into it by clicking on the tab in the upper left corner of the workspace.
.png)
By specifying a dimension on one axis and a measure on the other, we get the measure value for each dimension value. In this case, below you can see the number of records in the table for each date..png)
Having created all the measures, dimensions and relationships that we needed, now we must publish our project. To do that, go to the main page of the project on the tab in the upper left corner and click the "Publish" button, then click the "Next" button on all windows which will appear..png)
Now we can start paying attention to the left window, where we have 2 sections: "Draft", where we can edit our project, and "Publish", which displays the published versions of the project. By clicking on the "Published project", select the cube, and go to its "Connect" tab. Here we can see all the necessary data to connect Intersystems Reports Designer to our project..png)
We have learned everything we need to work with Adaptive Analytics. Now we can move on to working in InterSystems Reports Designer.
I need to mention that Intersystems Reports Designer version 17.1 requires JDK version 16 to work, and it will not run on later versions.
First, you need to install drivers for the JDBC connection to Adaptive Analytics.
Here are the links to the required JAR files. The JDBC driver itself must be compatible with the one used on the server. We use versions that are old enough so that we do not get an error caused by the older version of the Hive on the server compared to ours. For convenience, we have collected all the necessary libraries in one archive, which you can download from the link:
https://github.com/teccod/Logi-JDBC-drivers
These files must be placed in the lib folder, located along the path LogiReport\Designer\lib.
Launch Intersystems Reports Designer and close the "Start" page. Now you can find yourself in the workspace of Intersystems Reports Designer. By default, it opens the last catalog with which the user was working or the pre-installed catalog that was installed with Intersystems Reports Designer.
Go to the "File" section and click "New Catalog"; fill in the name of the catalog, the name of the data source and the location where the file should be saved.
Intersystems Reports Designer creates an empty data source for us. Right-click on it and select "New JDBC connection".
.png)
In the "Driver" line we write our driver - org.apache.hive.jdbc.HiveDriver.
We take the URL from the JDBC field of the "Connect" tab in Adaptive Analytics and fill in the username and password.
The connection is established, but no cubes from the project have been loaded into it yet. Right-click on "Tables", then "Add tables" and select the desired cubes; add them with the "Add button", then press "Done" to complete the process. If the tables are not displayed when you select a data scheme different from the one that opens by default, use the "Refresh" button.
After adding everything that we needed, we have the dimensions and measures available in the project, and we can almost start creating a report.
In order to use the available data, we must make a request. In this request, we can impose the necessary restrictions on the data (do not show canceled orders, do not display data for the current month, etc.) and take only the part of the data that we need.
To create a query on the "Home" or "File" tab, select "New" and choose "Query". We pick the data source, fill in the query name, open our source, "Tables" and add the necessary tables to the query using the arrow.
.png)
We get into the query editor window:
.png)
There, by setting the necessary checkboxes or by checking the box next to the * field, select the necessary ones or all fields of the table. In the "Menu" item, we see several functions, the most interesting one of which is data filtering.
.png)
Here we can add conditions that will be written in SQL in the "WHERE" section of the "SELECT" statement (or simply, conditions that cut off data for the specified expression). In our case, we could write that the date is less than a certain value, is in a range of values, etc.
In the "Query Editor", we can also add calculated columns to enrich our data. The functions that you can use when creating them depend on what functions the data source provides. Adaptive Analytics does not provide any functions, so we are limited to the built-in Logi functions (which are the simplest mathematical and logical operators).
If there are several tables in the query, then you can set up links between them by dragging the link with the left mouse button from one field to another. In the SQL query code, these relationships will be displayed as WHERE table_name1.field_name = table_name2.field_name.
When you have finished editing the request, click the "ok" button. If necessary, you can create several more queries with different filters or fields in them.
Now you are ready to create the report. We will talk about the process of its creation in the next article.