DeepSee - Period to date vs same period last year
How are we doing THIS year versus the same period LAST year?
This is a common need in Business Intelligence. In fact, many design specifications for reports make use of a comparison between a selected period (year, quarter, etc) up to a certain date (for example November 15th, 2016) and a summary of the same information for the previous year (i.e. up to November 15th, 2015).
This post shows how to implement this in DeepSee.
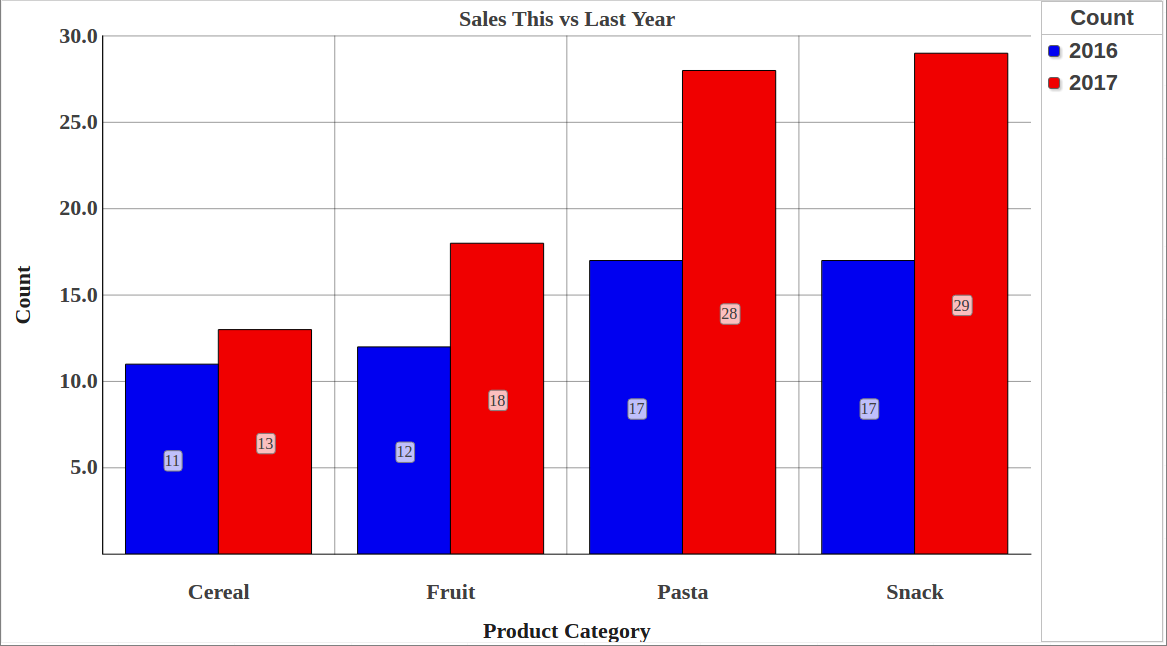
The following is an example using the HoleFoods cube. The table shows sell counts for each Product Category in rows. The first column shows the sell counts in 2016 up to the date of today. The second column shows the sell counts in 2015 up to exactly one year ago.
In this example the period of interest is year, corresponding to the “YearSold” level in HoleFoods but we will implement a dynamical period that can be set to quarter, month, etc.

This implementation is not trivial but it can be achieved on a “normal” non-KPI pivot
Prerequisites
For this implementation you will need a standard calendar, that is a calendar based on Months and not on custom periods.
A week level in the same hierarchy as day and month will lead to unexpected results. If a week period is needed the week level should be placed in a different hierarchy than the rest of the levels.
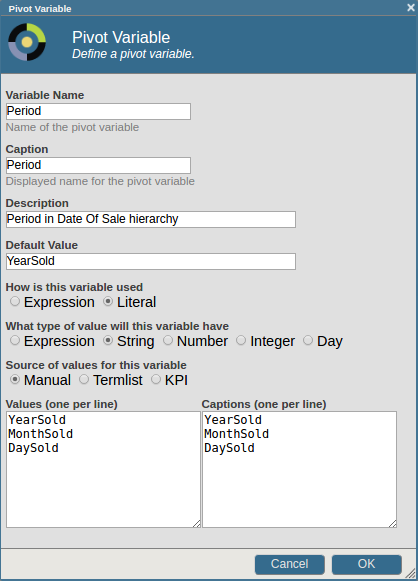
Define the Period as a pivot variable
In Analyzer Define a Period pivot variable as in the following picture:
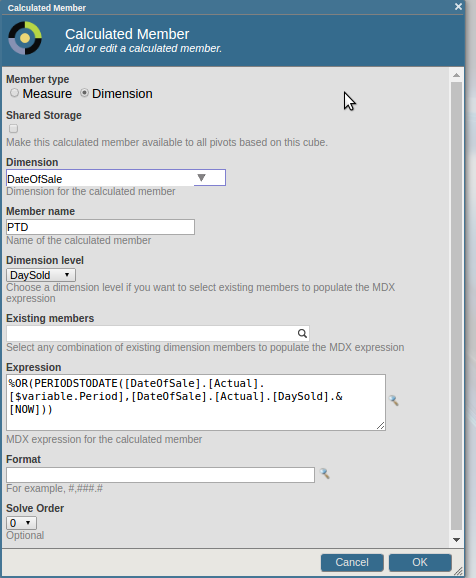
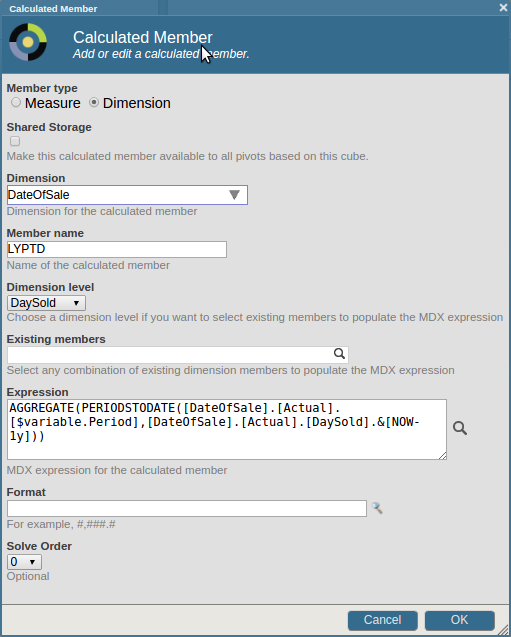
Define PTD and LYPTD
Define two Calculated Measures to compute period to date (PTD) and the same period in the last year (LYPTD):
- PTD (Period To Date) with Expression:
%OR(PERIODSTODATE([DateOfSale].[Actual].[$variable.Period], [DateOfSale].[Actual].[DaySold].&[NOW]))
PERIODSTODATE is an MDX function returning the set of child or descendent members of the given level, up to and including the given member. In the example above PERIODSTODATE returns a set of dates in the period specified by the pivot variable Period up to the date of today. %OR is used to return a single value for the set of all dates.
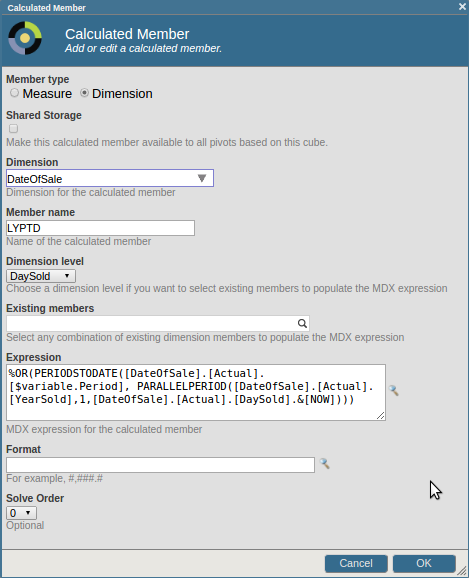
- LYPTD (Last Year Period To Date) with Expression:
%OR(PERIODSTODATE([DateOfSale].[Actual].[$variable.Period], PARALLELPERIOD([DateOfSale].[Actual].[YearSold], 1, [DateOfSale].[Actual].[DaySold].&[NOW])))
PARALLELPERIOD is used to calculate the date of today but one year in the past. This date is used in PERIODSTODATE as it was done in PTD to return a set of dates in Period but one year in the past. %OR combines all elements of this set of dates in one single value. Notice that $variable.Period is how you can reference the value of the Period pivot variable.
A simpler solution to calculate the date of today but one year in the past is to use the following syntax together with the NOW member:
[DateOfSale].[Actual].[DaySold].&[NOW-1y]
The expression becomes:
%OR(PERIODSTODATE([DateOfSale].[Actual].[$variable.Period], [DateOfSale].[Actual].[DaySold].&[NOW-1y]))
Create the pivot
Place Product Category on Rows, Count on Measures, crossjoin PTD and LYPTD on Count. Drag the Period pivot variable to filters and select a period, for example YearSold. Finally, click on the gear icon next to PTD and LYPTD in Columns to change the captions. It is possible to use $variable.Period in the caption string (not shown).
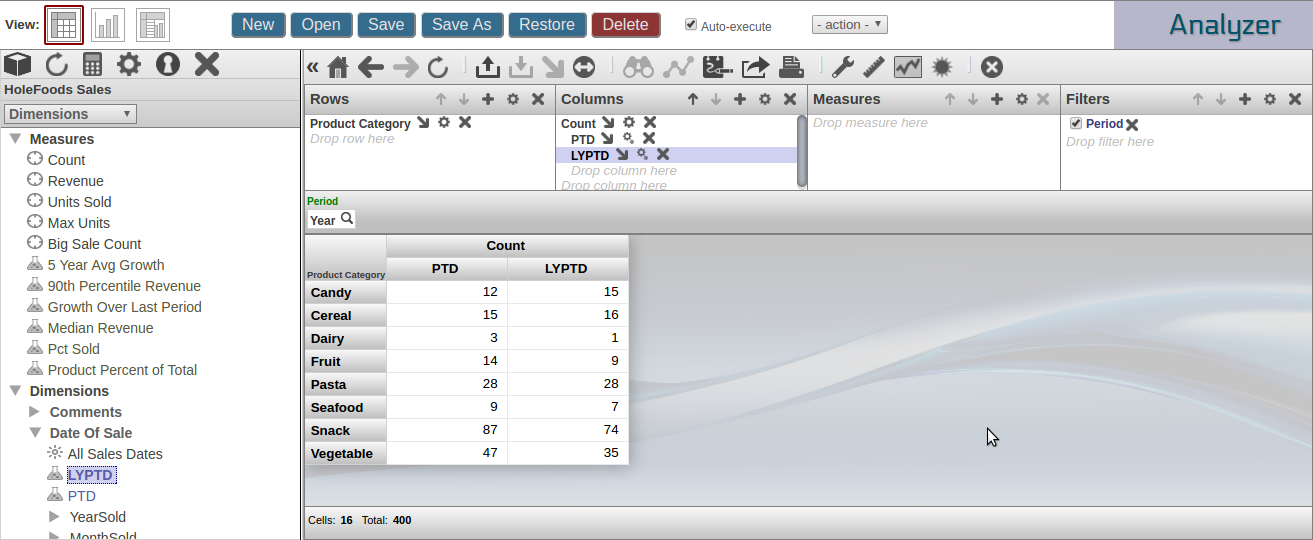
The MDX for this example is the following:
WITH MEMBER [DateOfSale].[PTD] AS '%OR(PERIODSTODATE([DateOfSale].[Actual].[$variable.Period], [DateOfSale].[Actual].[DaySold].&[NOW]))' MEMBER [DateOfSale].[LYPTD] AS '%OR(PERIODSTODATE([DateOfSale].[Actual].[$variable.Period], [DateOfSale].[Actual].[DaySold].&[NOW]))' SELECT NON EMPTY NONEMPTYCROSSJOIN([Measures].[%COUNT], {%LABEL([DATEOFSALE].[PTD],"PTD",""), %LABEL([DATEOFSALE].[LYPTD],"LYPTD","")}) ON 0, NON EMPTY [Product].[P1].[Product Category].Members ON 1 FROM [HOLEFOODS]
Embed the Pivot in a dashboard
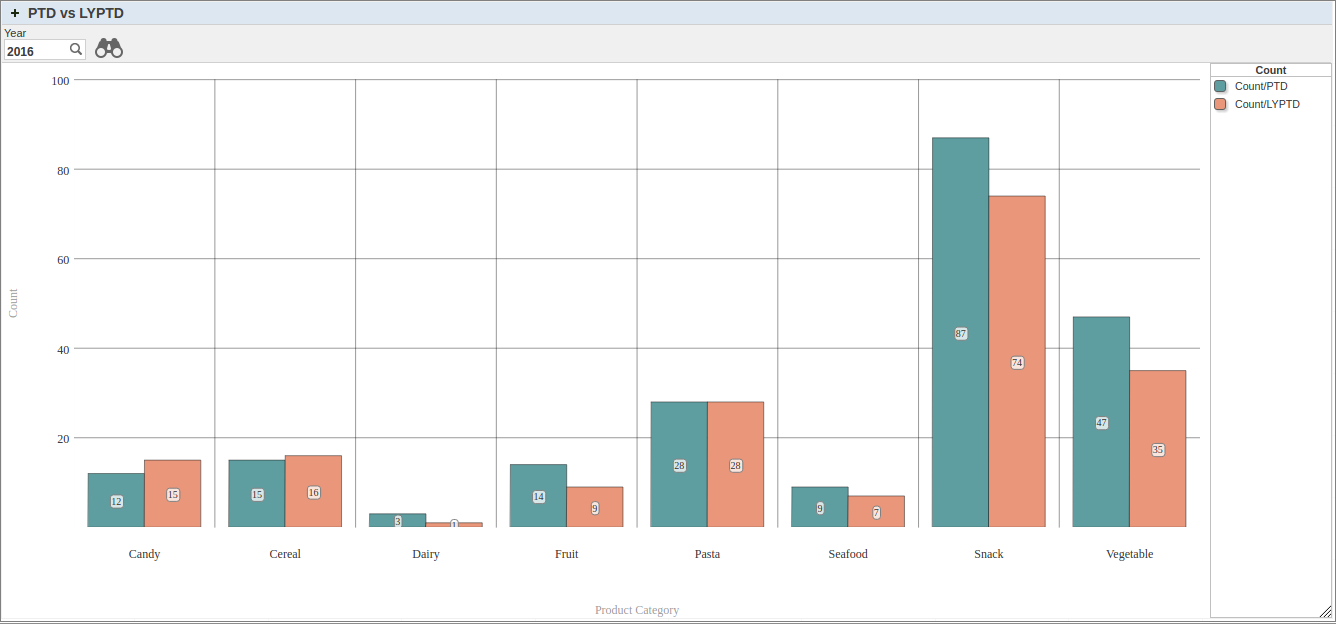
Finally, create a dashboard and embed your pivot as a widget. Add an Apply Pivot Variable Control targeting Period on your widget to be able to change period. This is how the widgets appear as a Bar Chart:
Exercises for the reader
- Extend this implementation to be able to select a dynamic date so that sales can be shown up up to a user-selected date. Hint: create a Date pivot variable.
- Can you find an alternative to the method proposed in this post, for example using %MDX in calculated members? Post your answer in the comments.
Comments
Hi, Alessandro!
Thank you for the valuable post!
One question: should we consider using %TIMERANGE or %OR instead of AGGREGATE just because of better query performance?
Hello Evgeny,
Yes, in this example it makes sense to use %OR instead of AGGREGATE. AGGREGATE can become useful when we the user needs to bring a measure inside the calculated dimension, for example to avoid crossjoining or having two measures in different axes. Also note that in the next major version an AGGREGATE function that acts on a set (first argument) with no expression (second argument) will be automatically replaced at the parser level with %OR for the purposes of calculating results.
Thank you for your suggestion, I updated the post.
Alessandro,
I'm trying to follow your example on Cache 2016.2.1. but with no luck. Respectively, when I drag and drop pivot table rows and columns, I always get "no result" in the (single) cell.
However, when using the MDX supplied, it works fine. Looking at generated MDX when using drag'n'drop, the MDX looks completely different.
What am I doing wrong?
Dan
Hi Dan.
I've just repeated Allesandro's steps on 2016.2.1 and got the same results as he.
With the exception that screenshots for PTD and LYPTD showing usage of ISNULL function, whereas you should use just %OR(...) expressions that are written before screenshot.
Here is the MDX I've got:
WITH  MEMBER [DateOfSale].[PTD] AS '%OR(PERIODSTODATE([DateOfSale].[Actual].[$variable.Period], [DateOfSale].[Actual].[DaySold].&[NOW]))'
MEMBER [DateOfSale].[LYPTD] AS '%OR(PERIODSTODATE([DateOfSale].[Actual].[$variable.Period], PARALLELPERIOD([DateOfSale].[Actual].[YearSold], 1, [DateOfSale].[Actual].[DaySold].&[NOW])))'
SELECT NON EMPTY NONEMPTYCROSSJOIN([Measures].[%COUNT],
       {[DATEOFSALE].[PTD],[DATEOFSALE].[LYPTD]}) ON 0,
       NON EMPTY [Product].[P1].[Product Category].Members ON 1
FROM [HOLEFOODS]
Alexander.
Thanks to Alexander, he found the potential bug (or a feature), the calculated measure definition shall not have "shared storage" selected!
Dan
Yes, there is currently a bug with pivot variables and calculated member using shared storage. Let's hope this bug will get fixed soon. I replace the screenshots which include ISNULL in the expression
Thank you Alessandro for this post. It got me started, and was quite valuable to my education.
However, in my usage case, performance was still quite sluggish, so I tried another approach: I created a SQL-based KPI that selected against the underlying table, which resulted in much better performance. In my testing on a cube with 900K facts, the performance was quite literally more than an order of magnitude faster.
Using SQL with CASE statements, one can derive all of these fields, although the SQL is perhaps even more baroque and complex than even the MDX is.
Hi, Samual!
Would you please send a piece of your MDX which has a bad performance.
Alessandro's example is very general. In many cases you can reach the same result without PERIODSTODATE and PARALLELPERIOD functions and any %OR statements. E.g. to make the Year-to-Year(YTY) monthly comparison you can just use the following (Holefoods Sample Cube):
SELECT [Measures].[Amount Sold] ON 0,NON EMPTY {[DateOfSale].[Actual].[MonthSold].&[201612],[DateOfSale].[Actual].[MonthSold].&[201512]} ON 1 FROM [HOLEFOODS]
Which shouldn't cause any performance issues for any number of rows.
If you want to parametrize the month with pivot variable the expression for YTY for any month could look like the following (assuming the $variable.month is a list of months):
SELECT [Measures].[Amount Sold] ON 0,NON EMPTY {[DateOfSale].[Actual].[MonthSold].&[$variable.month],PARALLELPERIOD([DateOfSale].[Actual].[YearSold],1,
[DateOfSale].[Actual].[MonthSold].&[$variable.month])} ON 1 FROM [HOLEFOODS]
HTH