Game Of Throne Analytics or How long is Arya's Stark List
Hi Devs!
Last weekend I had been testing the newborn csvgen module and was looking for a CSV file to test - thus I came across an interesting datafile on Data.World with Game of Throne episodes statistics. Death statistics. These folks documented all the murders through all the 8 seasons and noted where, who, from what clan with what weapon had killed another one.
So I imported it and made an IRIS Analytics dashboard.

Don't worry, Jon, with this dashboard we can figure out something ). See the details below.
The result of the "research" turned into this interactive IRIS Analytics dashboard:

Some facts
The "level of blood" grows from season to season and reaches its peak in Season 8.

There are 68 weapons, and the most dangerous is Dragonfire and Daenerys Targaryen is the bloodiest hero with 1000+ victims.
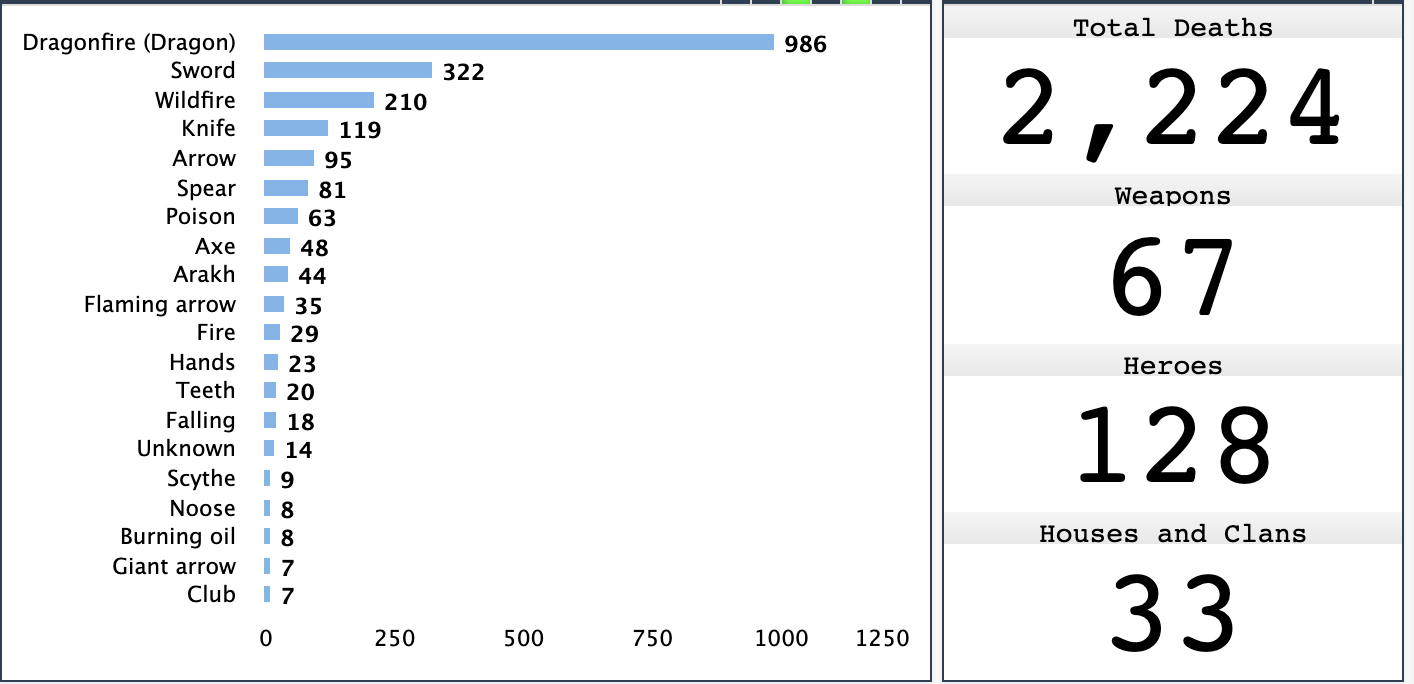
If we exclude Dragonfire weapon, then Cersei Lannister heads the top of the killers with 199 victims through all the 8 seasons.

What surprised me, that Stark house killed more Lannister soldiers, then Lannisters killed Starks - 34 vs 14.
How does this work
It took me half an hour to make all the things.
First I made a new repository using objectscript-docker template.
The csvgen module gives you a nice option to process a CSV to generate the class and import CSV data with one command. To make the thing you need to run the following:
set fn="/irisdev/app/data/game_of_thrones_deaths_collecti.csv"
set status=##class(community.csvgen).Generate(fn,",",1,,.tResults)As a result, you get the class generated, whereas you can see, csvgen guessed on datatypes too:
Class shvarov.GOT.Deaths Extends %Library.Persistent [ Not Abstract, DdlAllowed, Not LegacyInstanceContext, ProcedureBlock ]
{

Property name As %Library.String(MAXLEN = 250) [ SqlColumnNumber = 2 ];

Property allegiance As %Library.String(MAXLEN = 250) [ SqlColumnNumber = 3 ];

Property season As %Library.Integer(MAXVAL = 2147483647, MINVAL = -2147483648) [ SqlColumnNumber = 4 ];

Property episode As %Library.Integer(MAXVAL = 2147483647, MINVAL = -2147483648) [ SqlColumnNumber = 5 ];

Property location As %Library.String(MAXLEN = 250) [ SqlColumnNumber = 6 ];

Property killer As %Library.String(MAXLEN = 250) [ SqlColumnNumber = 7 ];

Property killershouse As %Library.String(MAXLEN = 250) [ SqlColumnNumber = 8, SqlFieldName = killers_house ];

Property method As %Library.String(MAXLEN = 250) [ SqlColumnNumber = 9 ];

Property deathno As %Library.Integer(MAXVAL = 2147483647, MINVAL = -2147483648) [ SqlColumnNumber = 10, SqlFieldName = death_no ];
The only thing I changed manually, I added the check after %Save() in the generated Import() method. Without it, you'll never know (obviously) why don't you have records imported.
Next, I created the cube class (manually with Architect), pivot queries (manually with Analyser), and a Dashboard (manually with IRIS Analytics Portal).
Then this was visualized with DSW.
I baked all the solution into a docker image, with the following dockerfile, where I use ZPM to install:
csvgen - to generate CSV and import data, the source.
isc-dev - for easy export IRIS Analytics artifacts, the source.
dsw - to visualize the data, the source.
All was coded in VSCode using VSCode ObjectScript plugin and Docker image of InterSystems IRIS Community Edition 2020.2.
And this is being deployed with every push into GCP Kubernetes Engine (GKE) using Github Actions Workflow. This dashboard is being redeployed with every push in the master branch.
And as a result, you can see this interactive dashboard working.
The quality of ObjectScript is continuously measured using ObjectScript Quality via this workflow file and can be examined here.
Any collaboration is very welcome!
P.S. And there were 68 people in Arya's list.