Virtualizing large databases - VMware CPU capacity planning
I am often asked by customers, vendors or internal teams to explain CPU capacity planning for large production databases running on VMware vSphere.
This post was originally written in 2017, I am updating the post in February 2026. For context I have kept the original post, but highlighted changes. This post was originally written for ESXi 6.0. The core principles remain valid for vSphere 7.x and 8.x, though there have been improvements to vNUMA handling, CPU scheduling (particularly for AMD EPYC), and CPU Hot Add compatibility with vNUMA in vSphere 8. Always consult the Performance Best Practices guide for your specific vSphere version. For a deeper dive see the "Additional links" section at the end of the post.
Changes are marked with:
UPDATE 2026: ...
In summary there are a few simple best practices to follow for sizing CPU for large production databases:
- Plan for one vCPU per physical CPU core.
- Consider NUMA and ideally size VMs to keep CPU and memory local to a NUMA node.
- Right-size virtual machines. Add vCPUs only when needed.
Generally this leads to a couple of common questions:
- Because of hyper-threading VMware lets me create VMs with 2x the number of physical CPUs. Doesn’t that double capacity? Shouldn’t I create VMs with as many CPUs as possible?
- What is a NUMA node? Should I care about NUMA?
- VMs should be right-sized, but how do I know when they are?
I answer these questions with examples below. Bust also remember, best practices are not written in stone. Sometimes you need to make compromises. For example, it is likely that large production database VMs will NOT fit in a NUMA node, and as we will see that’s OK. Best practices are guidelines that you will have to evaluate and validate for your applications and environment.
Although I am writing this with examples for databases running on InterSystems data platforms, the concepts and rules apply generally for capacity and performance planning for any large (Monster) VMs.
For virtualisation best practices and more posts on performance and capacity planning; A list of other posts in the InterSystems Data Platforms and performance series is here.
Monster VMs
This post is mostly about deploying _Monster VMs _, sometimes called Wide VMs. The CPU resource requirements of high transaction databases mean they are often deployed on Monster VMs.
A monster VM is a VM with more Virtual CPUs or memory than a physical NUMA node.
CPU architecture and NUMA
Current Intel processor architecture has Non-Uniform Memory Architecture (NUMA) architecture. For example, the servers I am using to run tests for this post have:
- Two CPU sockets, each with a processor with 12 cores (Intel E5-2680 v3).
- 256 GB memory (16 x 16GB RDIMM)
Each 12-core processor has its own local memory (128GB of RDIMMs and local cache) and can also access memory on other processors in the same host. Each 12-core package of CPU, CPU cache and 128 GB RDIMM memory is a NUMA node. To access memory on another processor NUMA nodes are connected by a fast inter-connect.
Processes running on a processor accessing local RDIMM and Cache memory have lower latency than going across the interconnect to access remote memory on another processor. Access across the interconnect increases latency, so performance is non-uniform. The same design applies to servers with more than two sockets. A four socket Intel server has four NUMA nodes.
ESXi understands physical NUMA and the ESXi CPU scheduler is designed to optimise performance on NUMA systems. One of the ways ESXi maximises performance is to create data locality on a physical NUMA node. In our example if you have a VM with 12 vCPU and less than 128GB memory, ESXi will assign that VM to run on one of the physical NUMA nodes. Which leads to the rule;
If possible size VMs to keep CPU and memory local to a NUMA node.
If you need a Monster VM larger than a NUMA node that is OK, ESXi does a very good job of automatically calculating and managing requirements. For example, ESXi will create virtual NUMA nodes (vNUMA) that intelligently schedule onto the physical NUMA nodes for optimal performance. The vNUMA structure is exposed to the operating system. For example, if you have a host server with two 12-core processors and a VM with 16 vCPUs ESXi may use eight physical cores on on each of two processors to schedule VM vCPUs, the operating system (Linux or Windows) will see two NUMA nodes.
It is also important to right-size your VMs and not allocate more resources than are needed as that can lead to wasted resources and loss of performance. As well as helping you size for NUMA, it is more efficient and will result in better performance, to have a 12 vCPU VM with high (but safe) CPU utilisation than a 24 vCPU VM with low or middling VM CPU utilisation, especially if there are other VMs on this host needing to be scheduled and competing for resources. This also re-enforces the rule;
Right-size virtual machines.
Note: There are differences between Intel and AMD implementations of NUMA. AMD has multiple NUMA nodes per processor. It’s been a while since I have seen AMD processors in a customer server, but if you have them review NUMA layout as part of your planning.
UPDATE 2026: Note: AMD EPYC processors are now common in datacenter environments and have a different NUMA architecture than Intel. EPYC processors can have multiple NUMA nodes per socket, configured via NPS (NUMA Per Socket) BIOS settings. Starting with vSphere 7.0 Update 2, the ESXi CPU scheduler includes significant optimizations for AMD EPYC that can achieve up to 50% better performance out-of-the-box. For AMD EPYC, the default BIOS settings (NPS-1, CCX-as-NUMA disabled) provide optimal performance for most virtualization workloads. Review AMD's VMware vSphere Tuning Guides for your specific EPYC generation (7003, 8004, 9004 series) for detailed recommendations.
Wide VMs and Licencing
For best NUMA scheduling configure wide VMs;
Correction June 2017: Configure VMs with 1 vCPU per socket.
For example, by default a VM with 24 vCPUs should be configured as 24 CPU sockets each with one core.
Follow VMware best practice rules .
Please see this post on the VMware blogs for examples.
The VMware blog post goes into detail, but the author, Mark Achtemichuk, recommends the following rules of thumb:
- While there are many advanced vNUMA settings, only in rare cases do they need to be changed from defaults.
- Always configure the virtual machine vCPU count to be reflected as Cores per Socket, until you exceed the physical core count of a single physical NUMA node.
- When you need to configure more vCPUs than there are physical cores in the NUMA node, evenly divide the vCPU count across the minimum number of NUMA nodes.
- Don’t assign an odd number of vCPUs when the size of your virtual machine exceeds a physical NUMA node.
- Don’t enable vCPU Hot Add unless you’re okay with vNUMA being disabled.
- Don’t create a VM larger than the total number of physical cores of your host.
UPDATE 2026: Starting with vSphere 6.5, vNUMA behavior was decoupled from the Cores per Socket setting. ESXi now automatically calculates and presents the optimal vNUMA topology to the guest OS. For most workloads, leaving the default settings is recommended. vSphere 8.0 introduced an enhanced virtual topology feature that automatically selects optimal coresPerSocket values for VMs.
UPDATE 2026: For vSphere 8 and later: The limitation where CPU Hot Add disabled vNUMA has been lifted in vSphere 8 for VMs using virtual hardware version 20. VMs can now be configured to expose vNUMA topology even with CPU Hot-Add enabled. However, this requires the VM to use the latest virtual hardware compatibility and the new vSphere 8 API property to be configured. **For earlier vSphere versions, the original guidance still applies: do not enable Hot Add for monster VMs.
IRIS licensing counts cores so this is not a problem, however for software or databases other than IRIS specifying that a VM has 24 sockets could make a difference to software licensing so you must check with vendors.
Hyper-threading and the CPU schedular
Hyper-threading (HT) often comes up in discussions, I hear; “hyper-threading doubles the number of CPU cores”. Which obviously at the physical level it can’t — you have as many physical cores as you have. Hyper-threading should be enabled and will increase system performance. An expectation is maybe 20%-30% or more application performance increase, but the actual amount is dependant on the application and the workload. But certainly not double.
As I posted in the VMware best practice post, a good starting point for sizing large production database VMs is to assume is that the vCPU has full physical core dedication on the server —basically ignore hyper-threading when capacity planning. For example;
For a 24-core host server plan for a total of up to 24 vCPU for production database VMs knowing there may be available headroom.
Once you have spent time monitoring the application, operating system and VMware performance during peak processing times you can decide if higher VM consolidation is possible. In the best practice post I stated the rule as;
One physical CPU (includes hyper-threading) = One vCPU (includes hyper-threading).
Why Hyper-threading does not double CPU
HT on Intel Xeon processors is a way of creating two logical CPUs on one physical core. The operating system can efficiently schedule against the two logical processors — if a process or thread on a logical processor is waiting, for example for IO, the physical CPU resources can be used by the other logical processor. Only one logical processor can be progressing at any point in time, so although the physical core is more efficiently utilised performance is not doubled.
With HT enabled in the host BIOS, when creating a VM you can configure a vCPU per HT logical processor. For example, on a 24-physical core server with HT enabled you can create a VM with up to 48 vCPUS. The ESXi CPU scheduler will optimise processing by running VMs processes on separate physical cores first (while still considering NUMA). I explore later in the post whether allocating more vCPUs than physical cores on a Monster database VM helps scaling.
co-stop and CPU scheduling
After monitoring host and application performance you may decide that some overcommitment of host CPU resources is possible. Whether this is a good idea will be very dependant on the applications and workloads. An understanding of the schedular and a key metric to monitor can help you be sure that you are not over committing host resources.
I sometimes hear; for a VM to be progressing there must be the same number of free logical CPUs as there are vCPUs in the VM. For example, a 12 vCPU VM must ‘wait’ for 12 logical CPUs to be ‘available’ before execution progresses. However it should be noted that ESXi after version 3 this is not the case. ESXi uses relaxed co-scheduling for CPU for better application performance.
Because multiple cooperating threads or processes frequently synchronise with each other not scheduling them together can increase latency in their operations. For example a thread waiting to be scheduled by another thread in a spin loop. For best performance ESXi tries to schedule as many sibling vCPUs together as possible. But the CPU scheduler can flexibly schedule vCPUs when there a multiple VMs competing for CPU resources in a consolidated environment. If there is too much time difference as some vCPUs make progress while siblings don’t (the time difference is called skew) then the leading vCPU will decide whether to stop itself (co-stop). Note that it is vCPUs that co-stop (or co-start), not the entire VM. This works very well when even when there is some over commitment of resources, however as you would expect; too much over commitment of CPU resources will inevitably impact performance. I show an example of over commitment and co-stop later in Example 2.
Remember it is not a flat-out race for CPU resources between VMs; the ESXi CPU scheduler’s job is to ensure that policies such as CPU shares, reservations and limits are followed while maximising CPU utilisation and to ensure fairness, throughput, responsiveness and scalability. A discussion of using reservations and shares to prioritise production workloads is beyond the scope of this post and dependant on your application and workload mix. I may revisit this at a later time if I find any IRIS specific recommendations. There are many factors that come into play with the CPU scheduler, this section just skims the surface. For a deep dive see the VMware white paper and other links in the references at the end of the post.
Examples
To illustrate the different vCPU configurations, I ran a series of benchmarks using a high transaction rate browser based Hospital Information System application. A similar concept to the DVD Store database benchmark developed by VMware.
The scripts for the benchmark are created based on observations and metrics from live hospital implementations and include high use workflows, transactions and components that use the highest system resources. Driver VMs on other hosts simulate web sessions (users) by executing scripts with randomised input data at set workflow transaction rates. A benchmark with a rate of 1x is the baseline. Rates can be scaled up and down in increments.
Along with the database and operating system metrics a good metric to gauge how the benchmark database VM is performing is component (also could be a transaction) response time as measured on the server. An example of a component is part of an end user screen. An increase in component response time means users would start to see a change for the worse in application response time. A well performing database system must provide consistent high performance for end users. In the following charts, I am measuring against consistent test performance and an indication of end user experience by averaging the response time of the 10 slowest high-use components. Average component response time is expected to be sub-second, a user screen may be made up of one component, or complex screens may have many components.
Remember you are always sizing for peak workload, plus a buffer for unexpected spikes in activity. I usually aim for average 80% peak CPU utilisation.
A full list of benchmark hardware and software is at the end of the post.
Example 1. Right-sizing - single monster VM per host
It is possible to create a database VM that is sized to use all the physical cores of a host server, for example a 24 vCPU VM on the 24 physical core host. Rather than run the server “bare-metal” in a IRIS database mirror for HA or introduce the complication of operating system failover clustering, the database VM is included in a vSphere cluster for management and HA, for example DRS and VMware HA.
I have seen customers follow old-school thinking and size a primary database VM for expected capacity at the end of five years hardware life, but as we know from above it is better to right-size; you will get better performance and consolidation if your VMs are not oversized and managing HA will be easier; think Tetris if there is maintenance or host failure and the database monster VM has to migrate or restart on another host. If transaction rate is forecast to increase significantly vCPUs can be added ahead of time during planned maintenance.
Note, 'hot add' CPU option disables vNUMA so do not use it for monster VMs.
Consider the following chart showing a series of tests on the 24-core host. 3x transaction rate is the sweet spot and the capacity planning target for this 24-core system.
- A single VM is running on the host.
- Four VM sizes were used to show performance at 12, 24, 36 and 48 vCPU.
- Transaction rates (1x, 2x, 3x, 4x, 5x) were run for each VM size (if possible).
- Performance/user experience is shown as component response time (bars).
- Average CPU% utilisation in the guest VM (lines).
- Host CPU utilisation reached 100% (red dashed line) at 4x rate for all VM sizes.

There is a lot going on in this chart, but we can focus on a couple of interesting things.
- The 24 vCPU VM (orange) scaled up smoothly to the target 3x transaction rate. At 3x rate the in-guest VM is averaging 76% CPU (peaks were around 91%). Host CPU utilisation is not much more than the guest VM. Component response time is pretty much flat up to 3x, so users are happy. As far as our target transaction rate — this VM is right-sized.
So much for right-sizing, what about increasing vCPUs, that means using hyper threads. Is it possible to double performance and scalability? The short answer is No!
In this case the answer can be seen by looking at component response time from 4x onwards. While the performance is ‘better’ with more logical cores (vCPUs) allocated, it is still not flat and as consistent as it was up to 3x. Users will be reporting slower response times at 4x no matter how many vCPUs are allocated. Remember at 4x the _host _ is already flat-lined at 100% CPU utilisation as reported by vSphere. At higher vCPU counts even though in-guest CPU metrics (vmstat) are reporting less than 100% utilisation this is not the case for physical resources. Remember the guest operating system does not know it is virtualised and is just reporting on resources presented to it. Also note the guest operating system does not see HT threads, all vCPUs are presented as physical cores.
The point is that database processes (there are more than 200 IRIS processes at 3x transaction rate) are very busy and make very efficient use of processors, there is not a lot of slack for logical processors to schedule more work, or consolidate more VMs to this host. For example, a large part of IRIS processing is happening in-memory so there is not a lot of wait on IO. So while you can allocate more vCPUs than physical cores there is not a lot to be gained because the host is already 100% utilised.
IRIS is very good at handling high workloads. Even when the host and VM are at 100% CPU utilisation the application is still running, and transaction rate is still increasing — scaling is not linear, and as we can see response times are getting longer and user experience will suffer — but the application does not ‘fall off a cliff’ and although not a good place to be users can still work. If you have an application that is not so sensitive to response times it is good to know you can push to the edge, and beyond, and IRIS still works safely.
Remember you do not want to run your database VM or your host at 100% CPU. You need capacity for unexpected spikes and growth in the VM, and ESXi hypervisor needs resources for all the networking, storage and other activities it does.
I always plan for peaks of 80% CPU utilisation. Even then sizing vCPU only up to the number of physical cores leaves some headroom for ESXi hypervisor on logical threads even in extreme situations.
If you are running a hyper-converged (HCI) solution you MUST also factor in HCI CPU requirements at the host level. See my previous post on HCI for more details. Basic CPU sizing of VMs deployed on HCI is the same as other VMs.
Remember, You must validate and test everything in your own environment and with your applications.
Example 2. Over committed resources
I have seen customer sites reporting ‘slow’ application performance while the guest operating system reports there are CPU resources to spare.
Remember the guest operating system does not know it is virtualised. Unfortunately in-guest metrics, for example as reported by vmstat (for example in pButtons) can be deceiving, you must also get host level metrics and ESXi metrics (for example esxtop) to truly understand system health and capacity.
As you can see in the chart above when the host is reporting 100% utilisation the guest VM can be reporting a lower utilisation. The 36 vCPU VM (red) is reporting 80% average CPU utilisation at 4x rate while the host is reporting 100%. Even a right-sized VM can be starved of resources, if for example, after go-live other VMs are migrated on to the host, or resources are over-committed through badly configured DRS rules.
To show key metrics, for this series of tests I configured the following;
- Two database VMs running on the host.
-
- a 24vCPU running at a constant 2x transaction rate (not shown on chart).
-
- a 24vCPU running at 1x, 2x, 3x (these metrics are shown on chart).
With another database using resources; at 3x rate, the guest OS (RHEL 7) vmstat is only reporting 86% average CPU utilisation and the run queue is only averaging 25. However, users of this system will be complaining loudly as the component response time shot up as processes are slowed.
As shown in the following chart Co-stop and Ready Time tell the story why user performance is so bad. Ready Time (%RDY) and CoStop (%CoStop) metrics show CPU resources are massively over committed at the target 3x rate. This should not really be a surprise as the host is running 2x (other VM) and this database VMs 3x rate.

The chart shows Ready time increases when total CPU load on the host increases.
Ready time is time that a VM is ready to run but cannot because CPU resources are not available.
Co-stop also increases. There are not enough free logical CPUs to allow the database VM to progress (as I detailed in the HT section above). The end result is processing is delayed due to contention for physical CPU resources.
I have seen exactly this situation at a customer site where our support view from pButtons and vmstat only showed the virtualised operating system. While vmstat reported CPU headroom user performance experience was terrible.
The lesson here is it was not until ESXi metrics and a host level view was made available that the real problem was diagnosed; over committed CPU resources caused by general cluster CPU resource shortage and to make the situation worse bad DRS rules causing high transaction database VMs to migrate together and overwhelm host resources.
Example 3. Over committed resources
In this example I used a baseline 24 vCPU database VM running at 3x transaction rate, then two 24 vCPU database VMs at a constant 3x transaction rate.
The average baseline CPU utilisation (see Example 1 above) was 76% for the VM and 85% for the host. A single 24 vCPU database VM is using all 24 physical processors. Running two 24 vCPU VMs means the VMs are competing for resources and are using all 48 logical execution threads on the server.

Remembering that the host was not 100% utilised with a single VM, we can still see a significant drop in throughput and performance as two very busy 24 vCPU VMs attempt to use the 24 physical cores on the host (even with HT). Although IRIS is very efficient using the available CPU resources there is still a 16% drop in database throughput per VM, and more importantly a more than 50% increase in component (user) response time.
Summary
My aim for this post is to answer the common questions. See the reference section below for a deeper dive into CPU host resources and the VMware CPU schedular.
Even though there are many levels of nerd-knob twiddling and ESXi rat holes to go down to squeeze the last drop of performance out of your system, the basic rules are pretty simple.
For large production databases :
- Plan for one vCPU per physical CPU core.
- Consider NUMA and ideally size VMs to keep CPU and memory local to a NUMA node.
- Right-size virtual machines. Add vCPUs only when needed.
If you want to consolidate VMs remember large databases are very busy and will heavily utilise CPUs (physical and logical) at peak times. Don't oversubscribe them until your monitoring tells you it is safe.
References
- VMware Blog - When to Overcommit vCPU:pCPU for Monster VMs
- Introduction 2016 NUMA Deep Dive Series
- The CPU Scheduler in VMware vSphere 5.1
Tests
I ran the examples in this post on a vSphere cluster made up of two processor Dell R730’s attached to an all flash array. During the examples there was no bottlenecks on the network or storage.
- IRIS 2016.2.1.803.0
PowerEdge R730
- 2x Intel(R) Xeon(R) CPU E5-2680 v3 @ 2.50GHz
- 16x 16GB RDIMM, 2133 MT/s, Dual Rank, x4 Data Width
- SAS 12Gbps HBA External Controller
- HyperThreading (HT) on
PowerVault MD3420, 12G SAS, 2U-24 drive
- 24x 24 960GB Solid State Drive SAS Read Intensive MLC 12Gbps 2.5in Hot-plug Drive, PX04SR
- 2 Controller, 12G SAS, 2U MD34xx, 8G Cache
VMware ESXi 6.0.0 build-2494585
- VMs are configured for best practice; VMXNET3, PVSCSI, etc.
RHEL 7
- Large pages
Baseline 1x rate averaged 700,000 glorefs/second (database access/second). 5x rate averaged more than 3,000,000 glorefs/second for 24 vCPUs. The tests were allowed to burn in until constant performance is achieved and then 15 minute samples were taken and averaged.
These examples only to show the theory, you MUST validate with your own application!
Additional Links (Feb 2026)
- Performance Best Practices for VMware vSphere 8.0 Update 3
- VMware vSphere 8.0 Virtual Topology Performance Study (also referenced in the Extreme Performance Series blog post)
- Performance Optimizations in VMware vSphere 7.0 U2 CPU Scheduler for AMD EPYC Processors
- Virtual Machine vCPU and vNUMA Rightsizing – Guidelines (Mark Achtemichuk)
- vSphere 7 Cores per Socket and Virtual NUMA (Frank Denneman, 2021)
- vSphere 8 CPU Topology for Large Memory Footprint VMs (Frank Denneman, 2022)
- Decoupling of Cores per Socket from Virtual NUMA Topology in vSphere 6.5 (Frank Denneman)
- AMD EPYC 9004 VMware vSphere Tuning Guide (AMD)
- Performance Tuning for Latency-Sensitive Workloads in vSphere 8 (January 2025)
- vNUMA and CPU Hot-Add support in vSphere 8 (William Lam)
- NUMA Deep Dive Series (Frank Denneman)
Comments
Correction June 2017: A VMware engineer has pointed out that the rule for monster VMs to: Configure VMs with 1 vCPU per socket. is no longer best practice. I have added a link at the appropriate section to current best practice and rules of thumb.
Murray, do you have any experience benchmarking Caché deployments on Amazon EC2 ecosystems? Would your advice "Plan for one vCPU per physical CPU core" apply equally to an EC2 deployment? Actually, with EC2, I'm not sure that it's possible to ever know the number of physical cores allocated to a VM. You are given the number of virtual cores. Not sure if this makes a difference in terms of sizing methodology.
Good question. InterSystems uses AWS for many different workloads and scenarios. There are so many types of server offered, it really is a case where you must test yourself.
As a starting point:
You really need understand just what AWS is giving you. For a list of instance types see the link below. And note the small print; Each vCPU is a hyperthread of an Intel Xeon core except for T2 and m3.medium.
If you know your sizing on VMware or bare metal with hyperthreading enabled and you usually need 4 cores (with hyperthreading) - I would start with sizing for 8 EC2 vCPUs. Of course you will have to test this before going into production. It would be great if you came back to the community if you came back and commented after your testing.
AWS:
https://aws.amazon.com/ec2/instance-types/
For more general information I recommend Marks post on EC2 reference architecture.
https://community.intersystems.com/post/intersystems-technologies-amazo…
Mark also noted there is a difference between reserved instances and on-demand. Reserved is just that – dedicated resources, so you won’t be contending with other VMs. If your requirement is consistent, and you want consistent performance look at the reserved instances.
I also received feedback on this from a coworker who has been running workloads on AWS which I think is useful;
"I selected the large EC2 instances which used all the available vCPU on underlying processors. ( AWS would reserve a few vCPUs for management functions. ) Thus, a AWS 40vCPU system is roughly equivalent to 20 core with HT bare metal system of the same clock speed. So right, If you want the equivalent of 4 VMware cpus , allocate at least 8 vCPUs. Also note the clock speeds of AWS are slower than what you are typically using. [ie the servers I use in my on premises benchmarks]. You can use the specint rate as the comparison."
For more on the last comment and how to compare SPECint metrics see:
https://community.intersystems.com/post/intersystems-data-platforms-and…
Murray,
Thanks for your response - much appreciated. Your colleague, Mark Bolinsky, seems to have a different perspective on this question. He writes the following:
"In AWS a given EC2 instance type's reported number of vCPU is an individual thread on the processor as a "logical processor". The OS (and Ensemble/HealthShare as well for that matter) will only see a given instance's number of vCPUs, and the OS will only schedule jobs on those as it sees them. Ensemble and HealthShare are process based - not thread based, so for an instance type of m4.large with 4 vCPUs will mean only 4 jobs in parallel will execute as a time."
This is the link for that post: https://community.intersystems.com/post/ensemblehealthshare-server-sizing-amazon-aws-ec2-servers. I was wondering if you and Mark are actually saying the same thing but perhaps I'm missing something. If I understand Mark's point, the number of vCPUs will be exposed to the OS as the number of logical processors, and therefore can be taken into account by the scheduler (ex. 4 vCPUs could potentially allow 4 processes to be scheduled to run simultaneously). But if I understand your point, the number of processes guaranteed to be executed simultaneously (assuming they are not waiting on non-CPU resources) would be one process per physical core (i.e. vCPUs/2). Based on efficiencies introduced by HT, the processor might be able execute additional threads (i.e. processes) on the physical cores provided that they are not using the same instruction sets simultaneously or competing for the same processor resources (cache, etc.). So then, my reduction of all this would be that 8 vCPUs would guarantee parallel execution of at least 4 processes, but there might be some additional premium (but in total, < # vCPUs) depending on how well the processor is able to optimize the thread execution. So therefore any processes above (vCPUs/2) would have to be considered "gravy", and probably very application-dependent. The OS would see 8 CPUs and try to schedule 8 processes, but it would be impossible for 8 processes to run simultaneously on 4 cores. Is this a fair summary?
Regards,
Ray
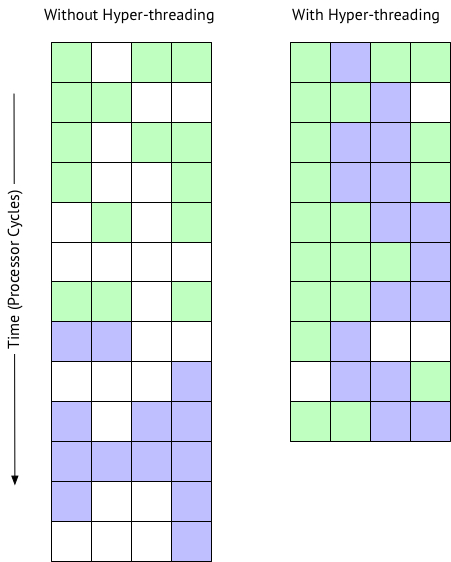
Hi, I think you have got it. Mark and I are saying the same thing. Sometimes a picture helps. The following is based on some presentations I have seen from Intel and VMware. It shows what happens when multiple VMs are sharing a host, which is why we recommend a reserved instance. But this also illustrates hyper-threading in general.
So to recap; A hyper-thread is not a complete core. A core is a core is a core, hyper-threading does not create more physical cores. The following picture shows a workload going through 4 processing units... micro execution units in a processor.
One VM is green a second is purple, white is idle. A lot of time is spent idle waiting for memory cache, IO, etc.
As you can see with hyper-threading on the right you don’t suddenly get two processors, not 2x, and expectation is ~10-30% improvement in processing time overall.
The schedular can schedule processing when there idle time, but remember on a system under heavy load CPU utilisation will be saturated anyway so there are less white idle time.
Hi sir, could you clarify this:
At the beginning of the post you said you started with this:
- Two CPU sockets, each with a processor with 12 cores (Intel E5-2680 v3).
- 256 GB memory (16 x 16GB RDIMM)
Then, in the final Test section you were talking about :
- 2x Intel(R) Xeon(R) CPU E5-2680 v3 @ 2.50GHz
2x means 2 sockets and one physical processor? or you finally used 2 physical processors?
Regards
Ivan
PD: I need to buy a server for SAP B1 which will run a Vmware host with 2 VMs (server and Database).
Each VM with 20 vCpu.....and i need to check if we are ok with 1 or 2 physical proccesors.