If one of your packages on OEX receives a review, you get notified by OEX only of YOUR own package.
The rating reflects the experience of the reviewer with the status found at the time of review.
It is kind of a snapshot and might have changed meanwhile.
Reviews by other members of the community are marked by * in the last column.
I also placed a bunch of Pull Requests on GitHub when I found a problem I could fix.
Some were accepted and merged, and some were just ignored.
So if you made a major change and expect a changed review, just let me know.
| # | Package | Review | Stars | IPM | Docker | * |
|---|---|---|---|---|---|---|
| 1 | iris-image-reducer | my very personal 7* | 7.0 | y | ||
| 2 | OPNEx-ECP Deployment | Reloaded and polished | 6.5 | y | ||
| 3 | interface-explorer | modern interface | 5.5 | y | y | |
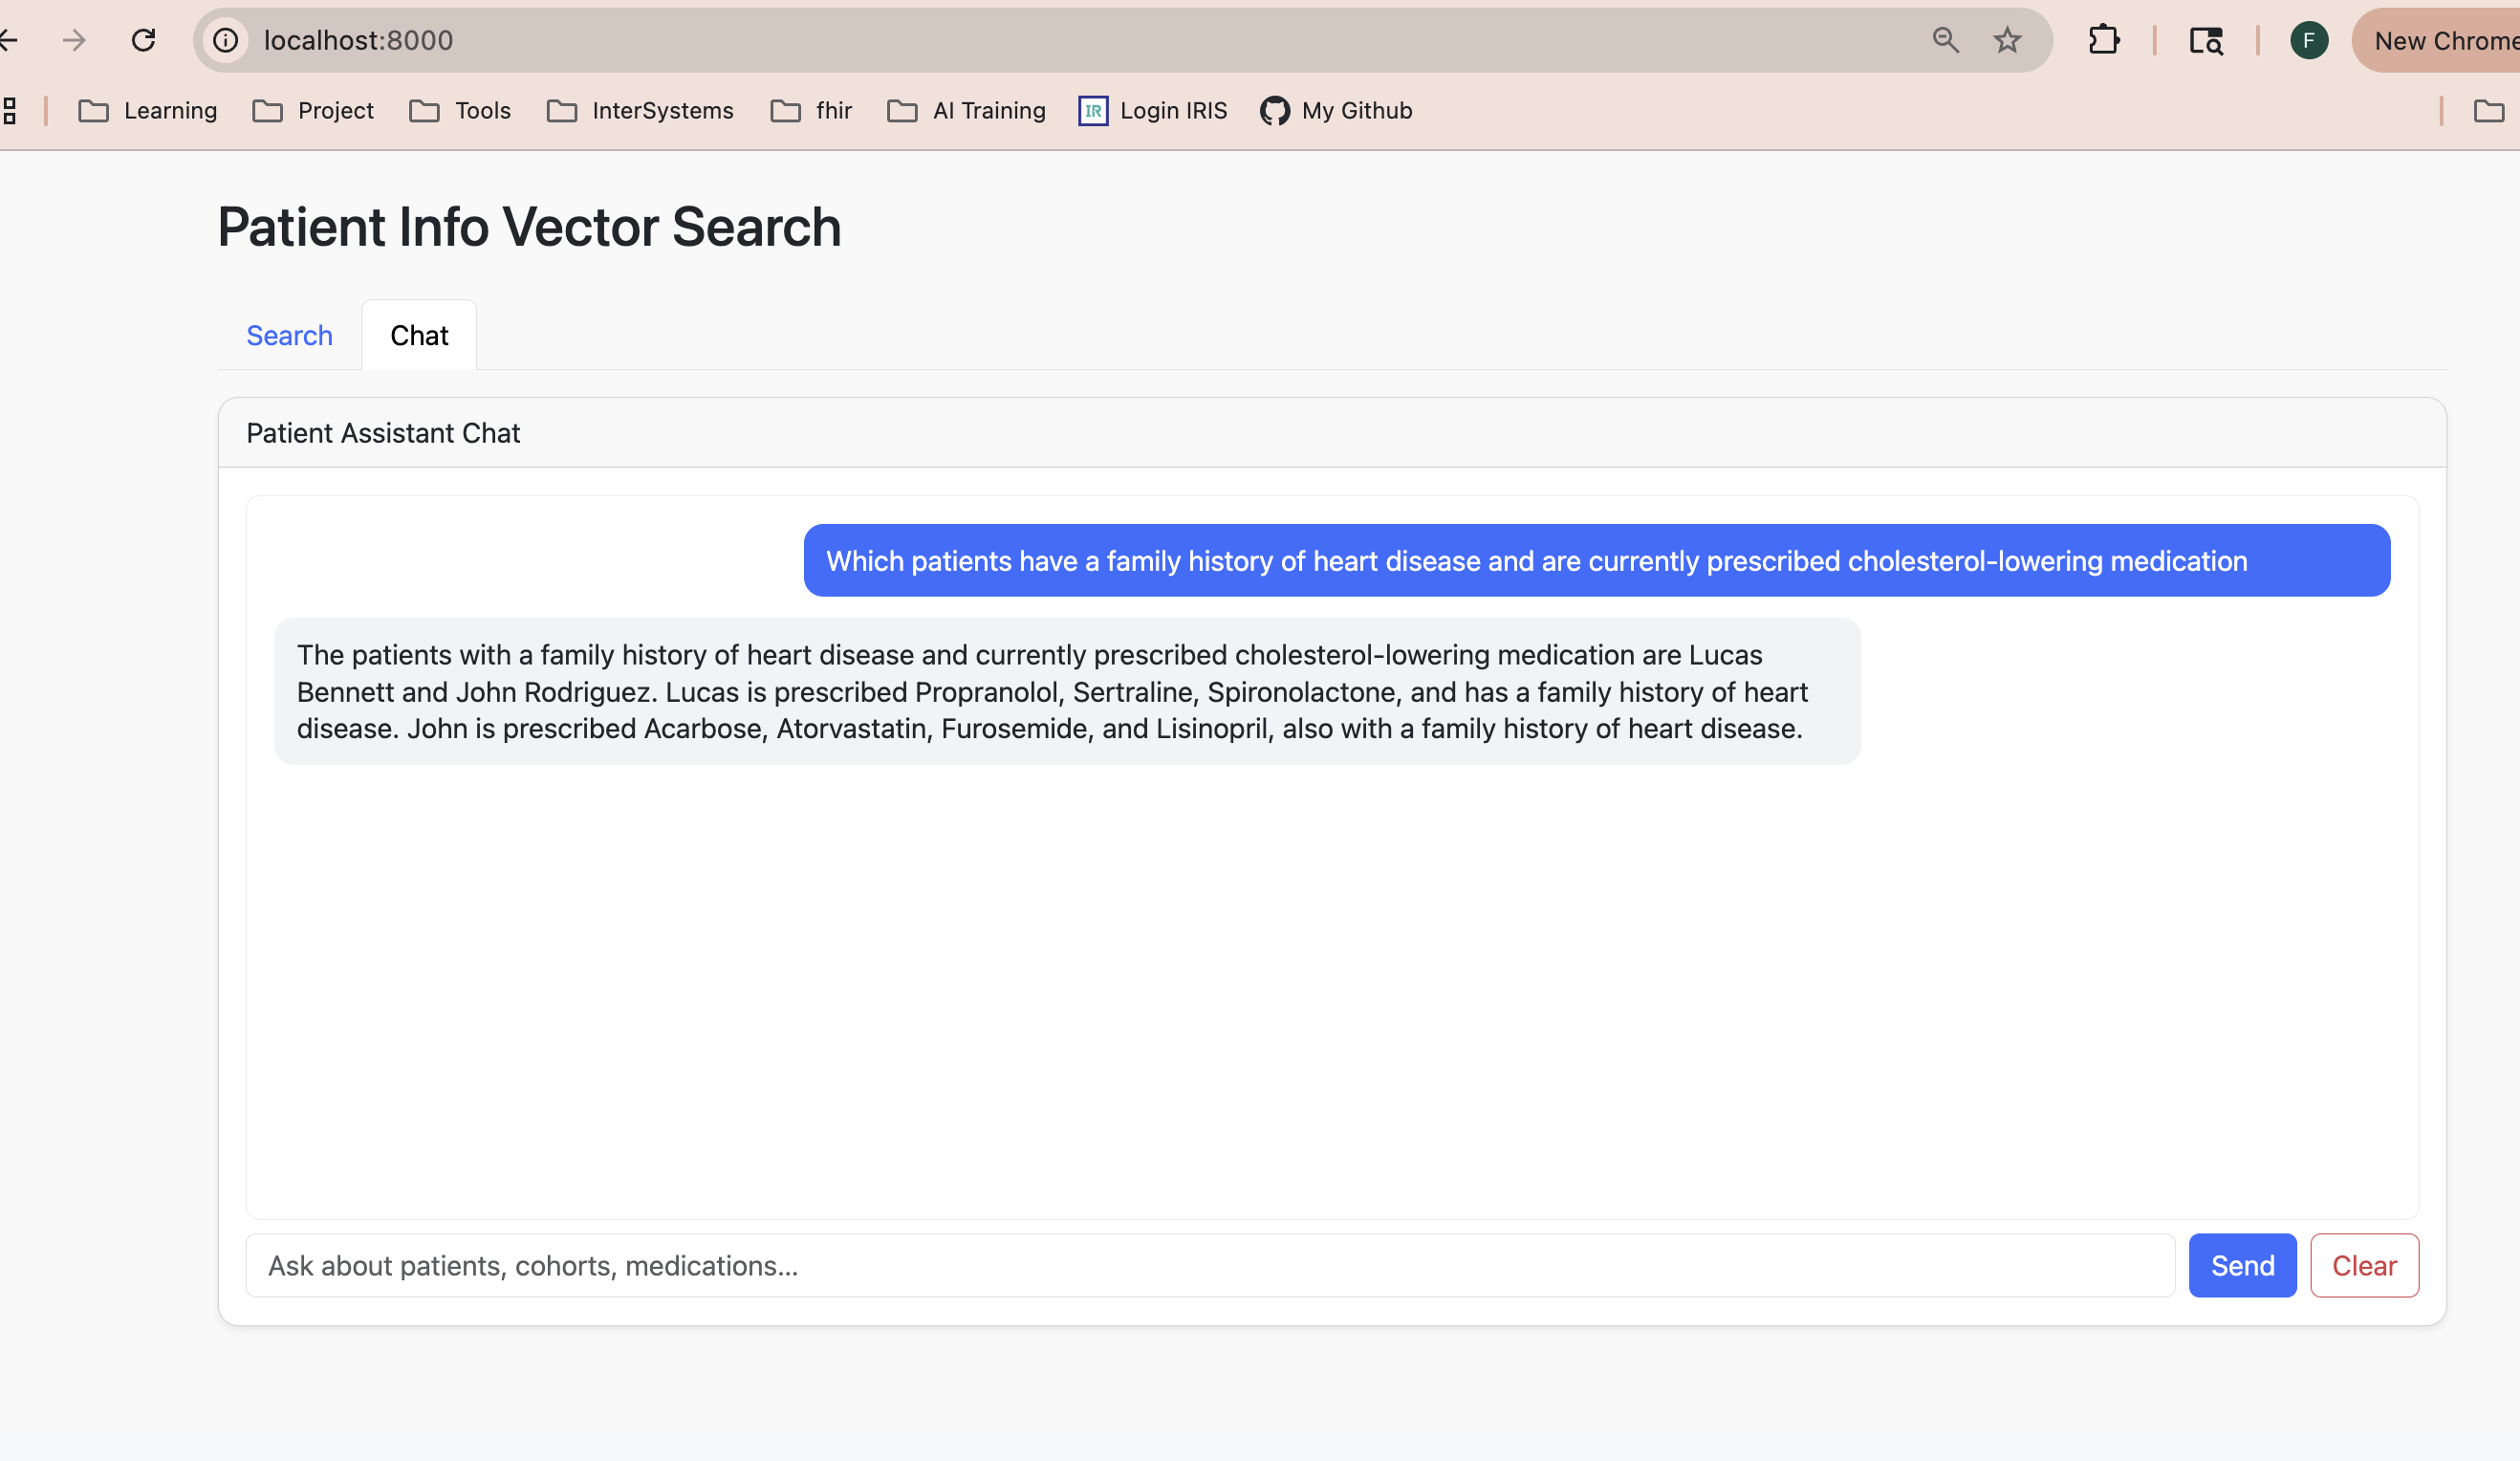
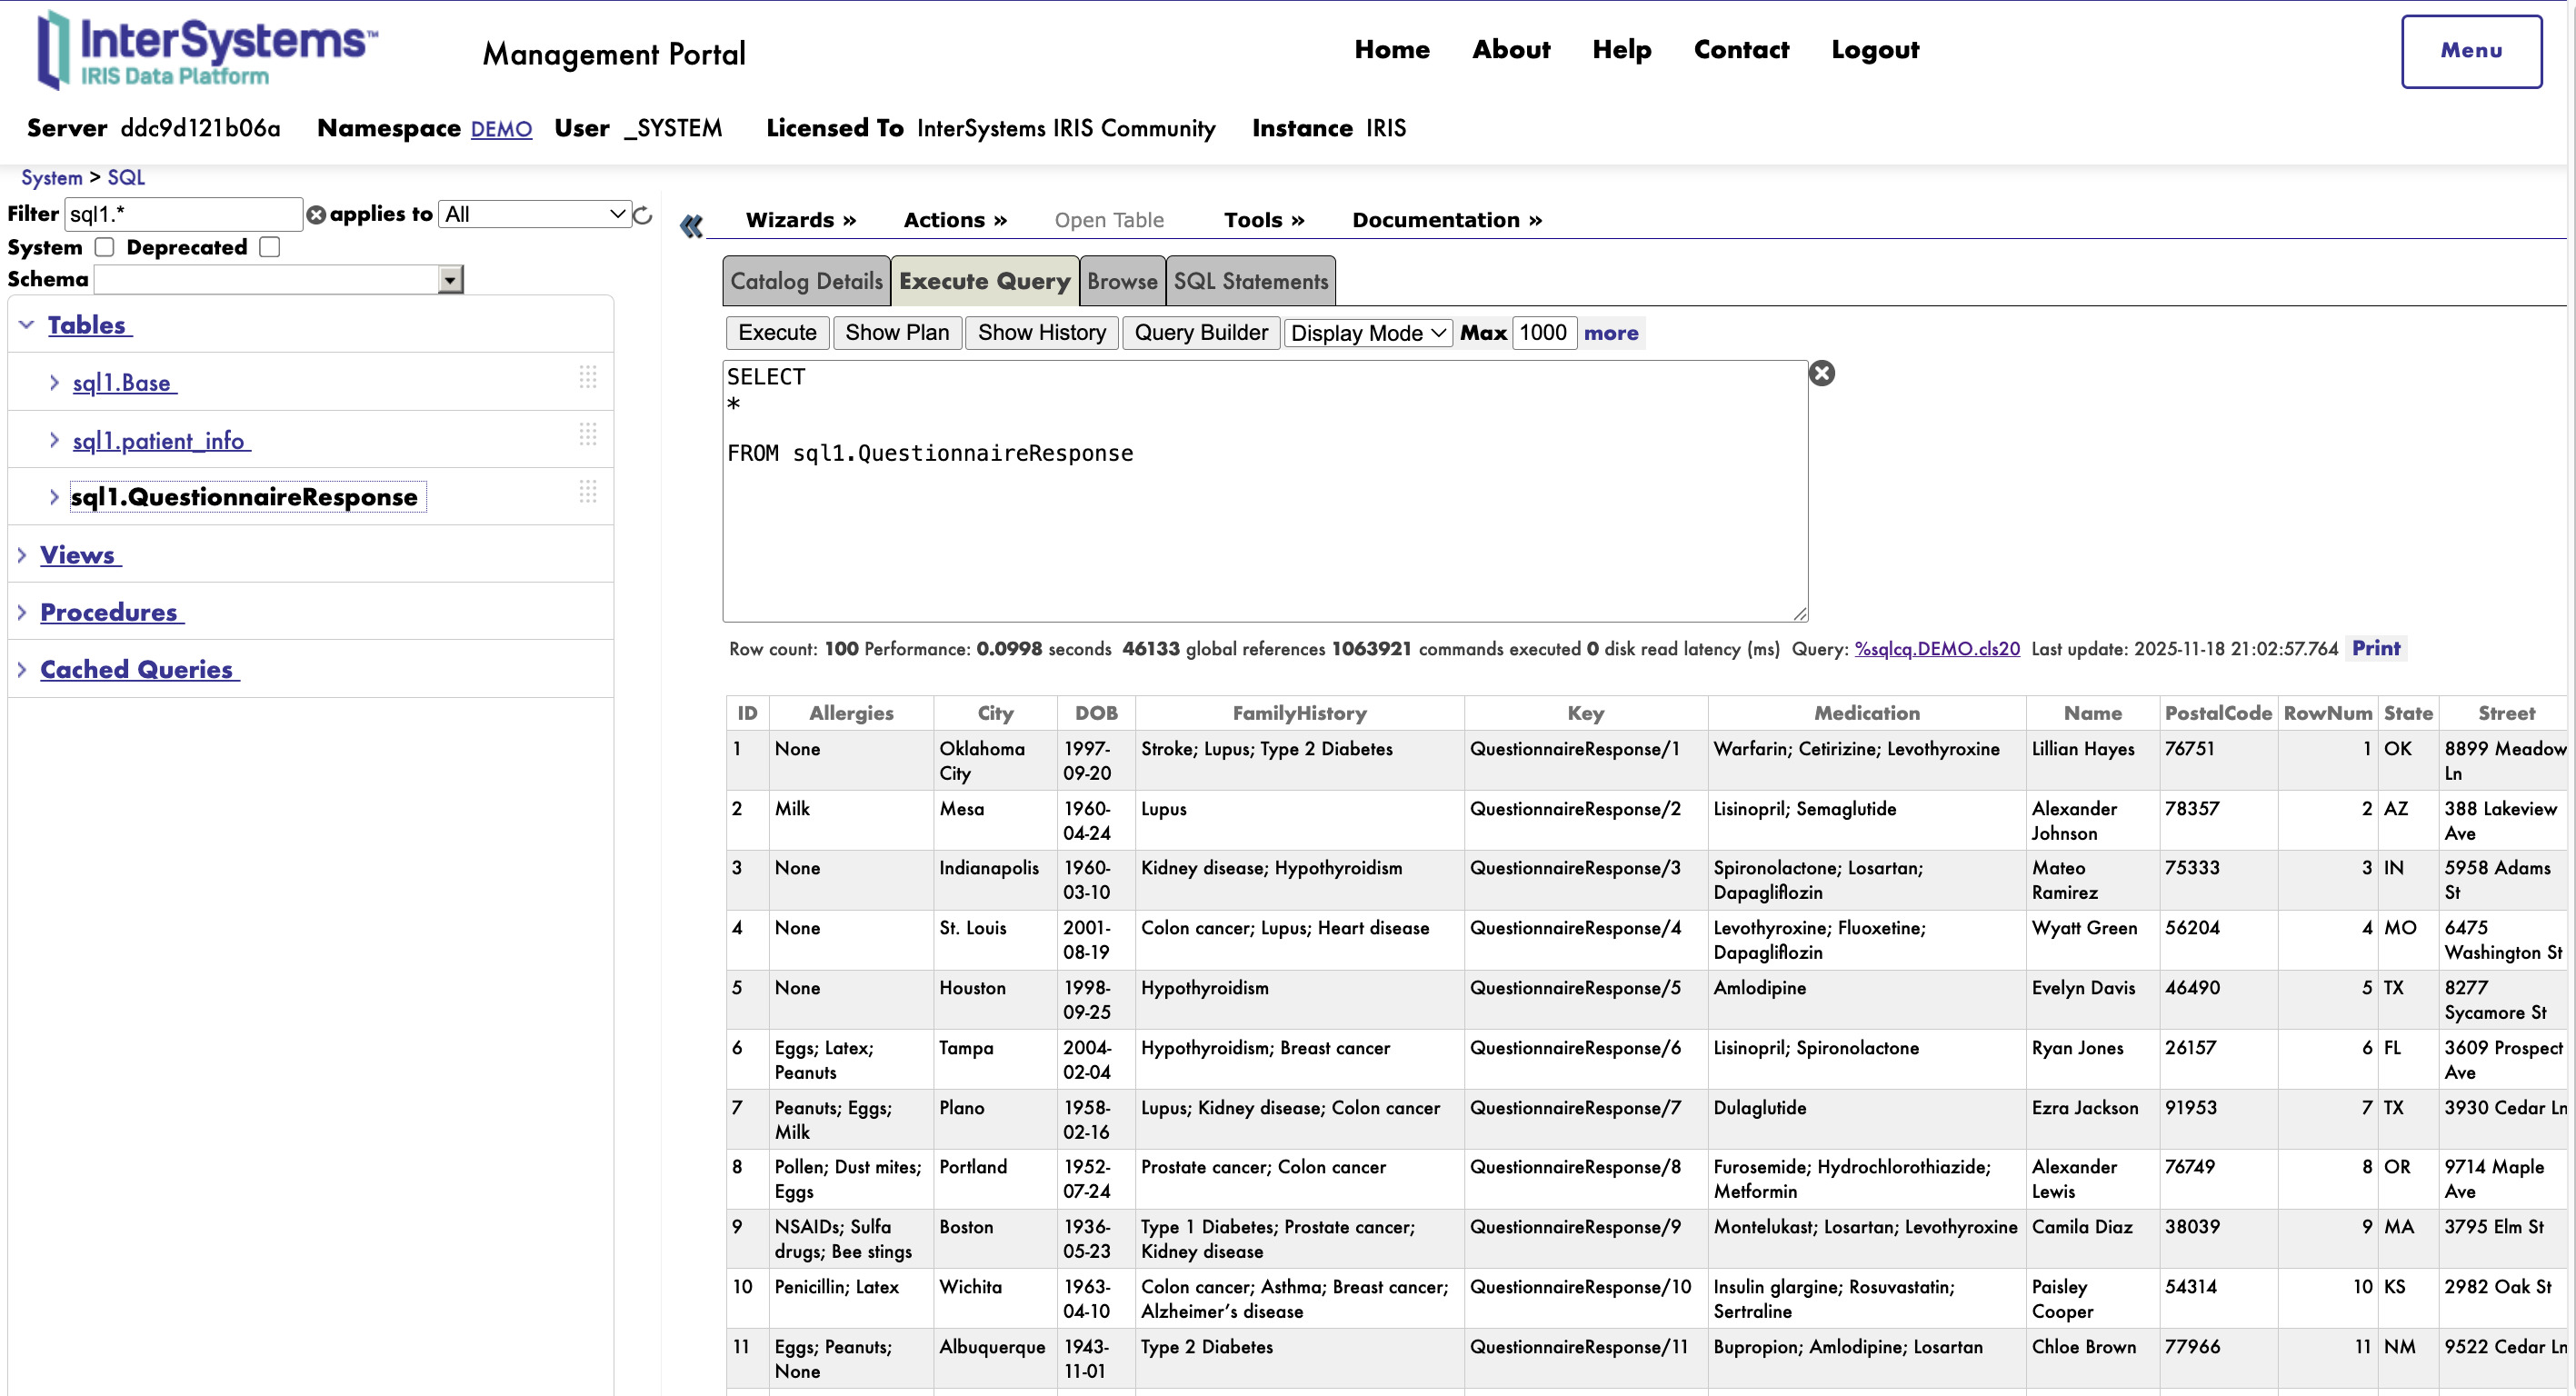
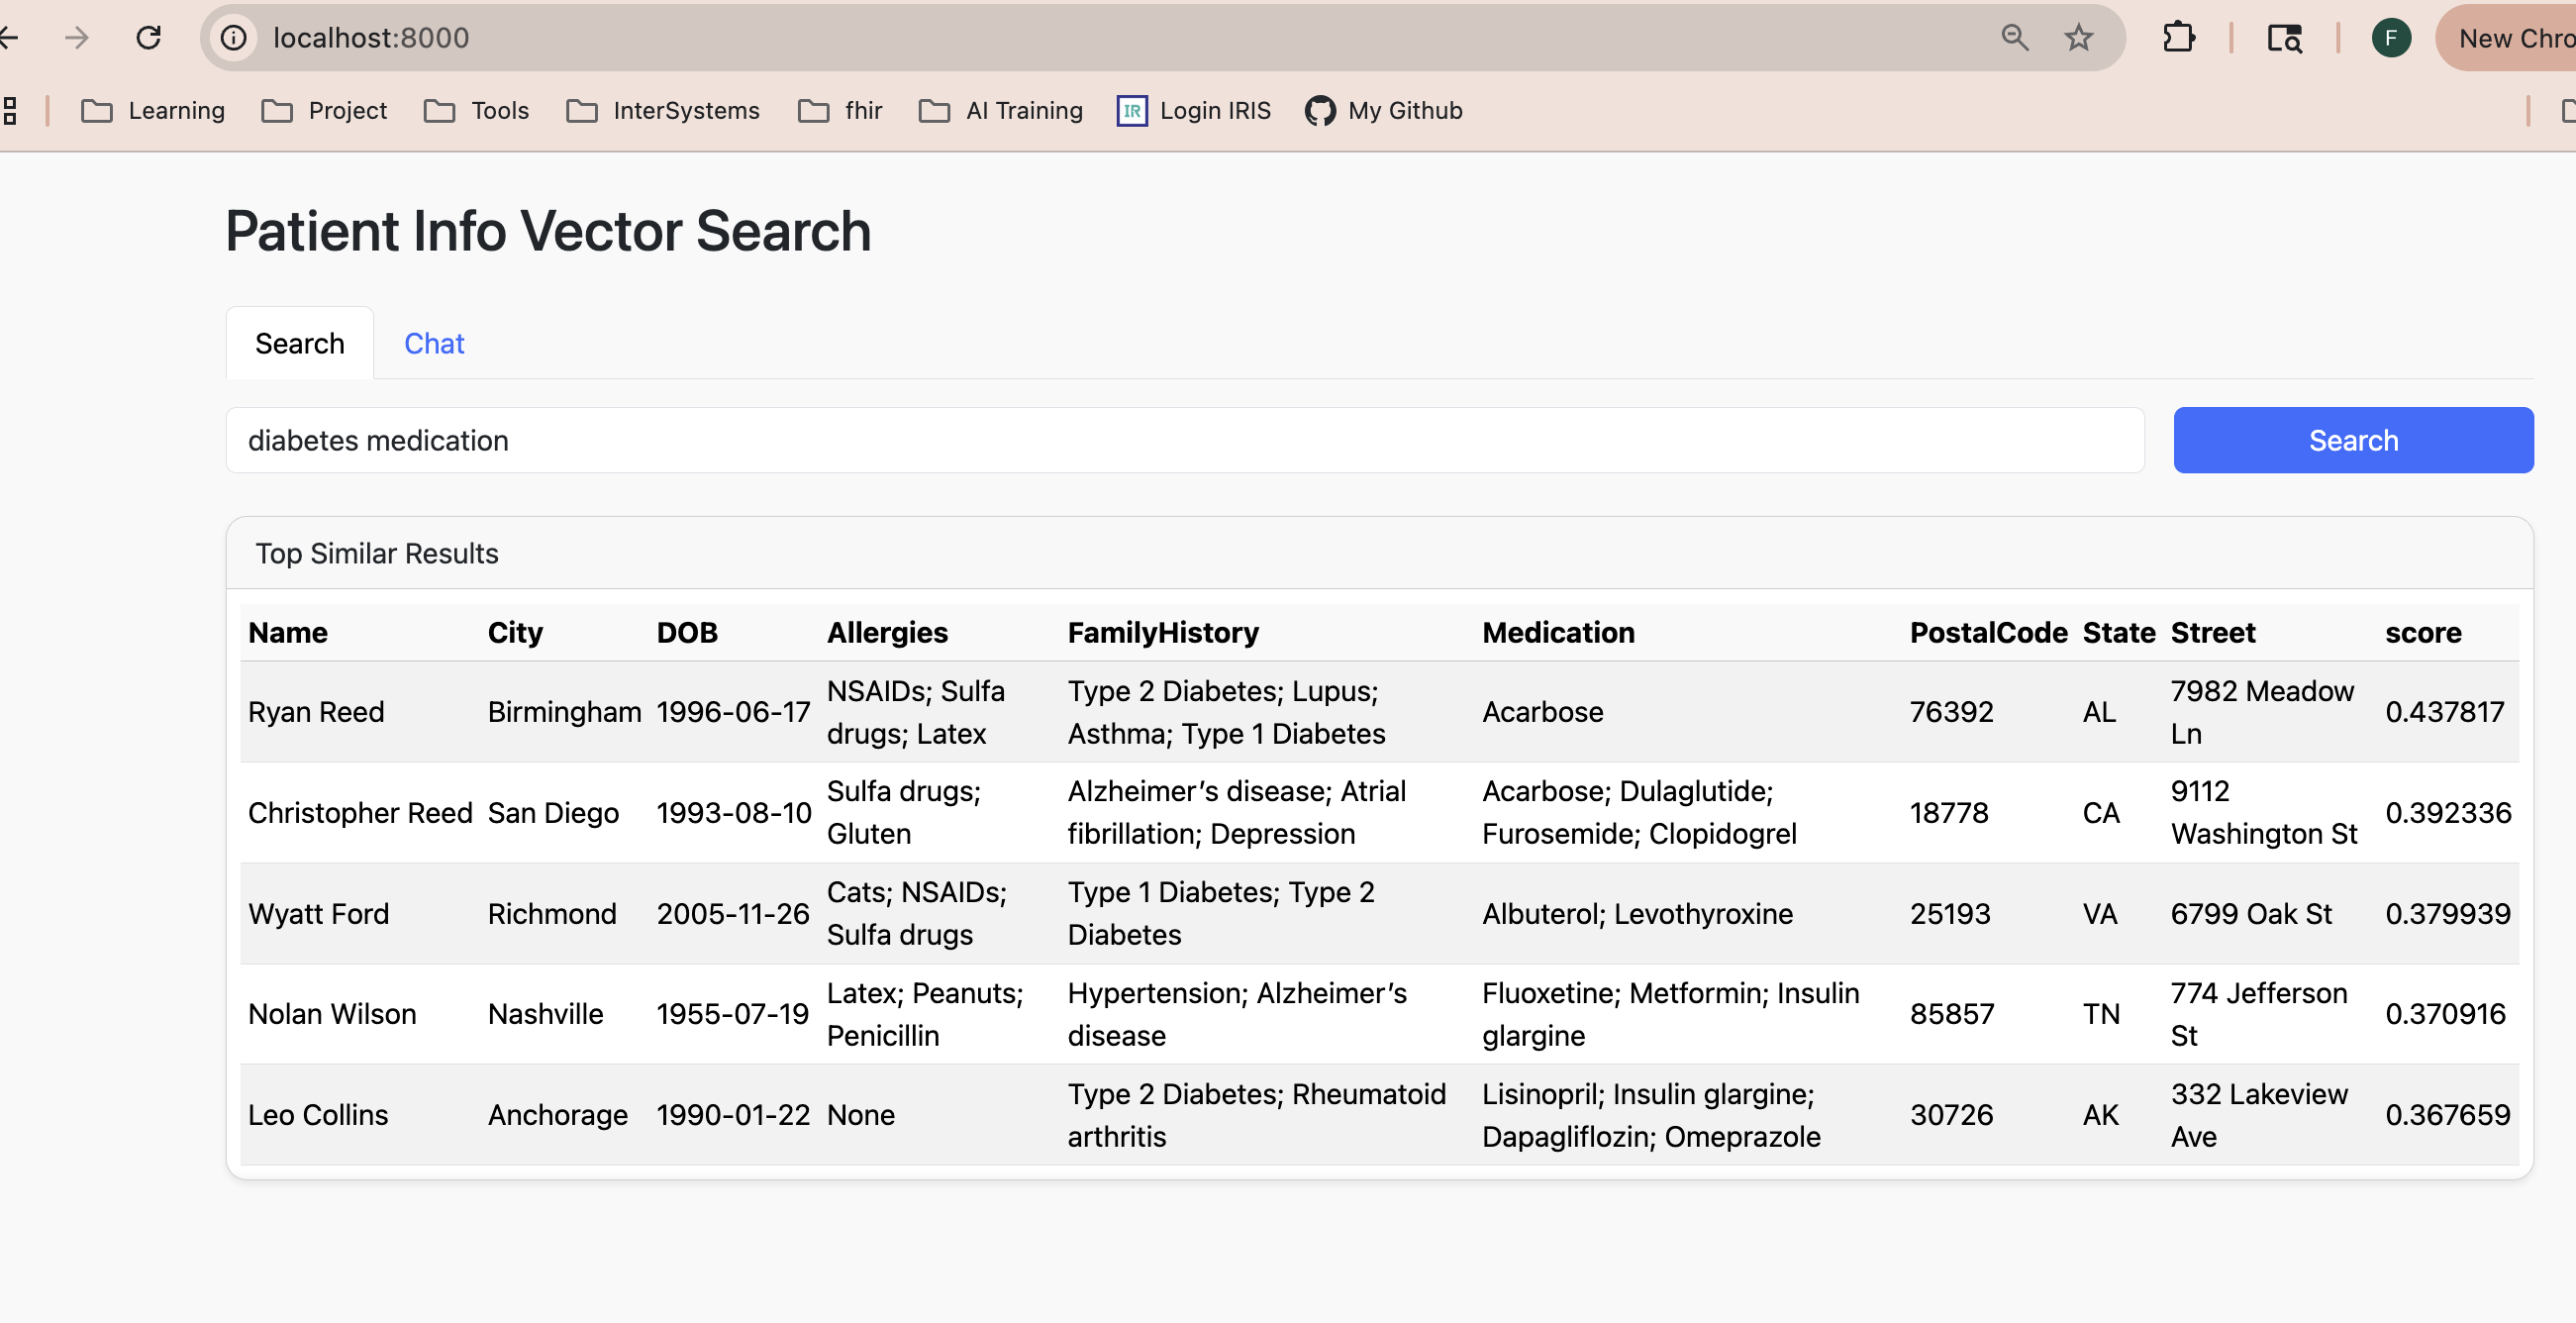
| 4 | FHIR SQL Builder with Vector Search | excellent demo | 5.2 | y | ||
| 5 | DBsizeWatch | useful summary | 5.0 | y | * | |
| 6 | IRISConfigurationDiagrams | impressive graphics | 5.0 | y | y | |
| 7 | IrisOASTestGen | interesting | 4.9 | y | y | |
| 8 | iris-fastjsonschema | interesting exercise | 4.7 | y | ||
| 9 | workshop-openehr | a good starting point | 4.7 | y | ||
| 10 | IrisTest-Fmtserializer | another view of UnitTests | 4.6 | y | ||
| 11 | IRISSystemCheck | incomplete | 4.3 | y | y | |
| 12 | RAGBookRecommender | hackaton is with you | 3.9 | y | ||
| 13 | Testify | room for improvement | 3.6 | y | y | |
| 14 | iris-global-statistics-chart | no result | 3.5 | y | y |
 Open Exchange

 。
。