Understanding free memory on a Linux database server
I am regularly contacted by customers about memory sizing when they get alerts that free memory is below a threshold, or they observe that free memory has dropped suddenly. Is there a problem? Will their application stop working because it has run out of memory for running system and application processes? Nearly always, the answer is no, there is nothing to worry about. But that simple answer is usually not enough. What's going on?
Consider the chart below. It is showing the output of the free metric in vmstat. There are other ways to display a system's free memory, for example, the free -m command. Sometimes, free memory will gradually disappear over time. However, the chart below is an extreme example, but it is a good example to illustrate what's going on.
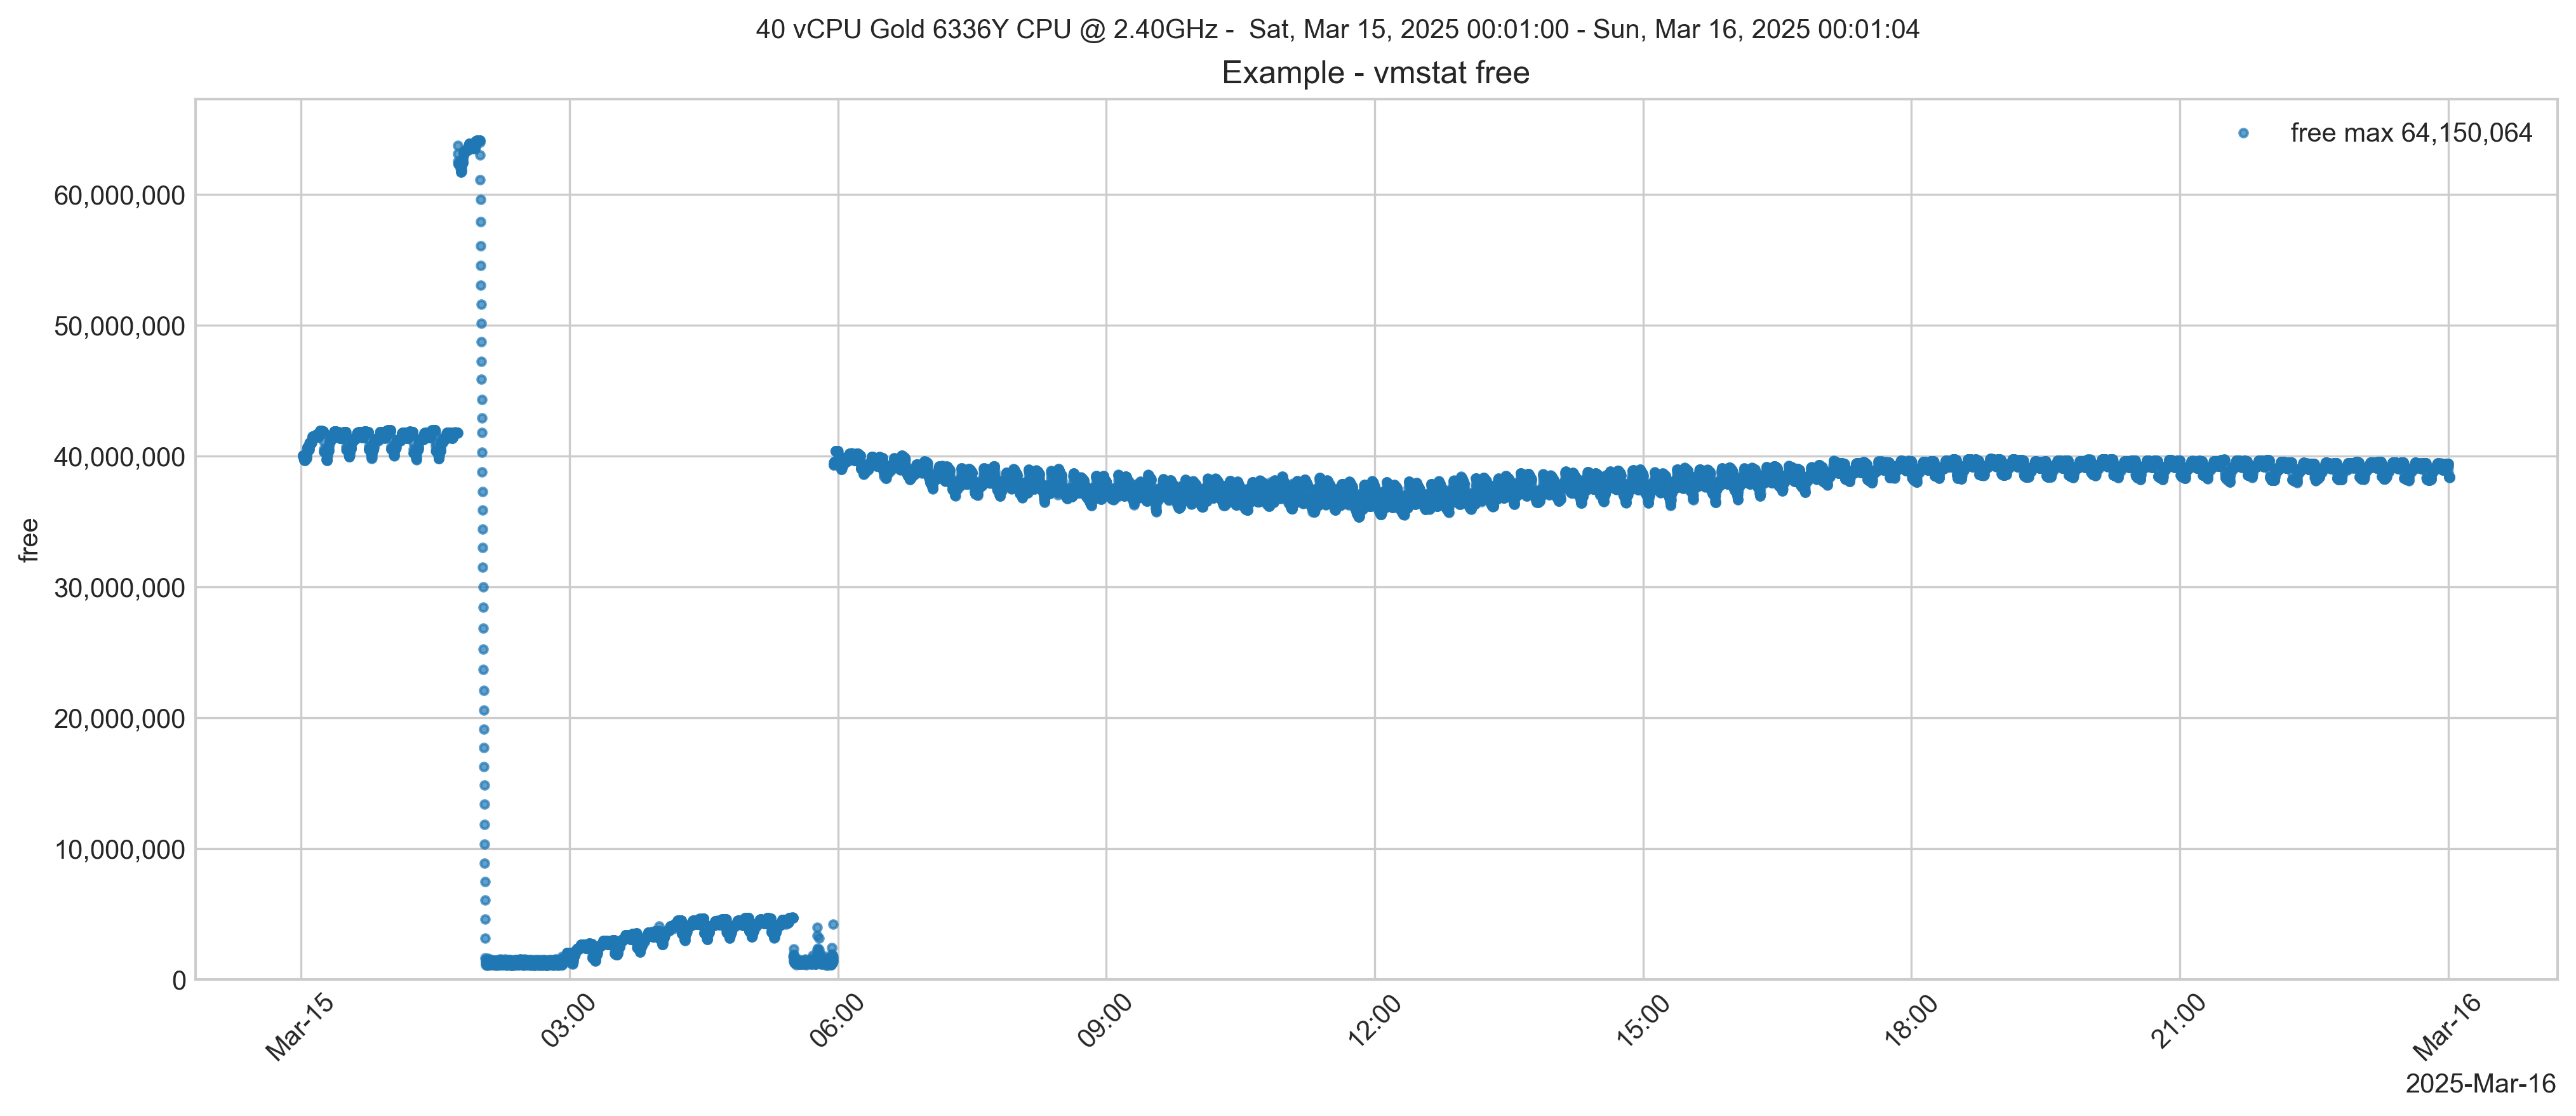
As you can see, at around 2 am, some memory is freed, then suddenly drops close to zero. This system is running the IntelliCare EHR application on the InterSystems IRIS database. The vmstat information came from a ^SystemPerformance HTML file that collects vmstat, iostat and many other system metrics. What else is going on on this system? It is the middle of the night, so I don't expect much is happening in the hospital. Let's look at iostat for the database volumes.
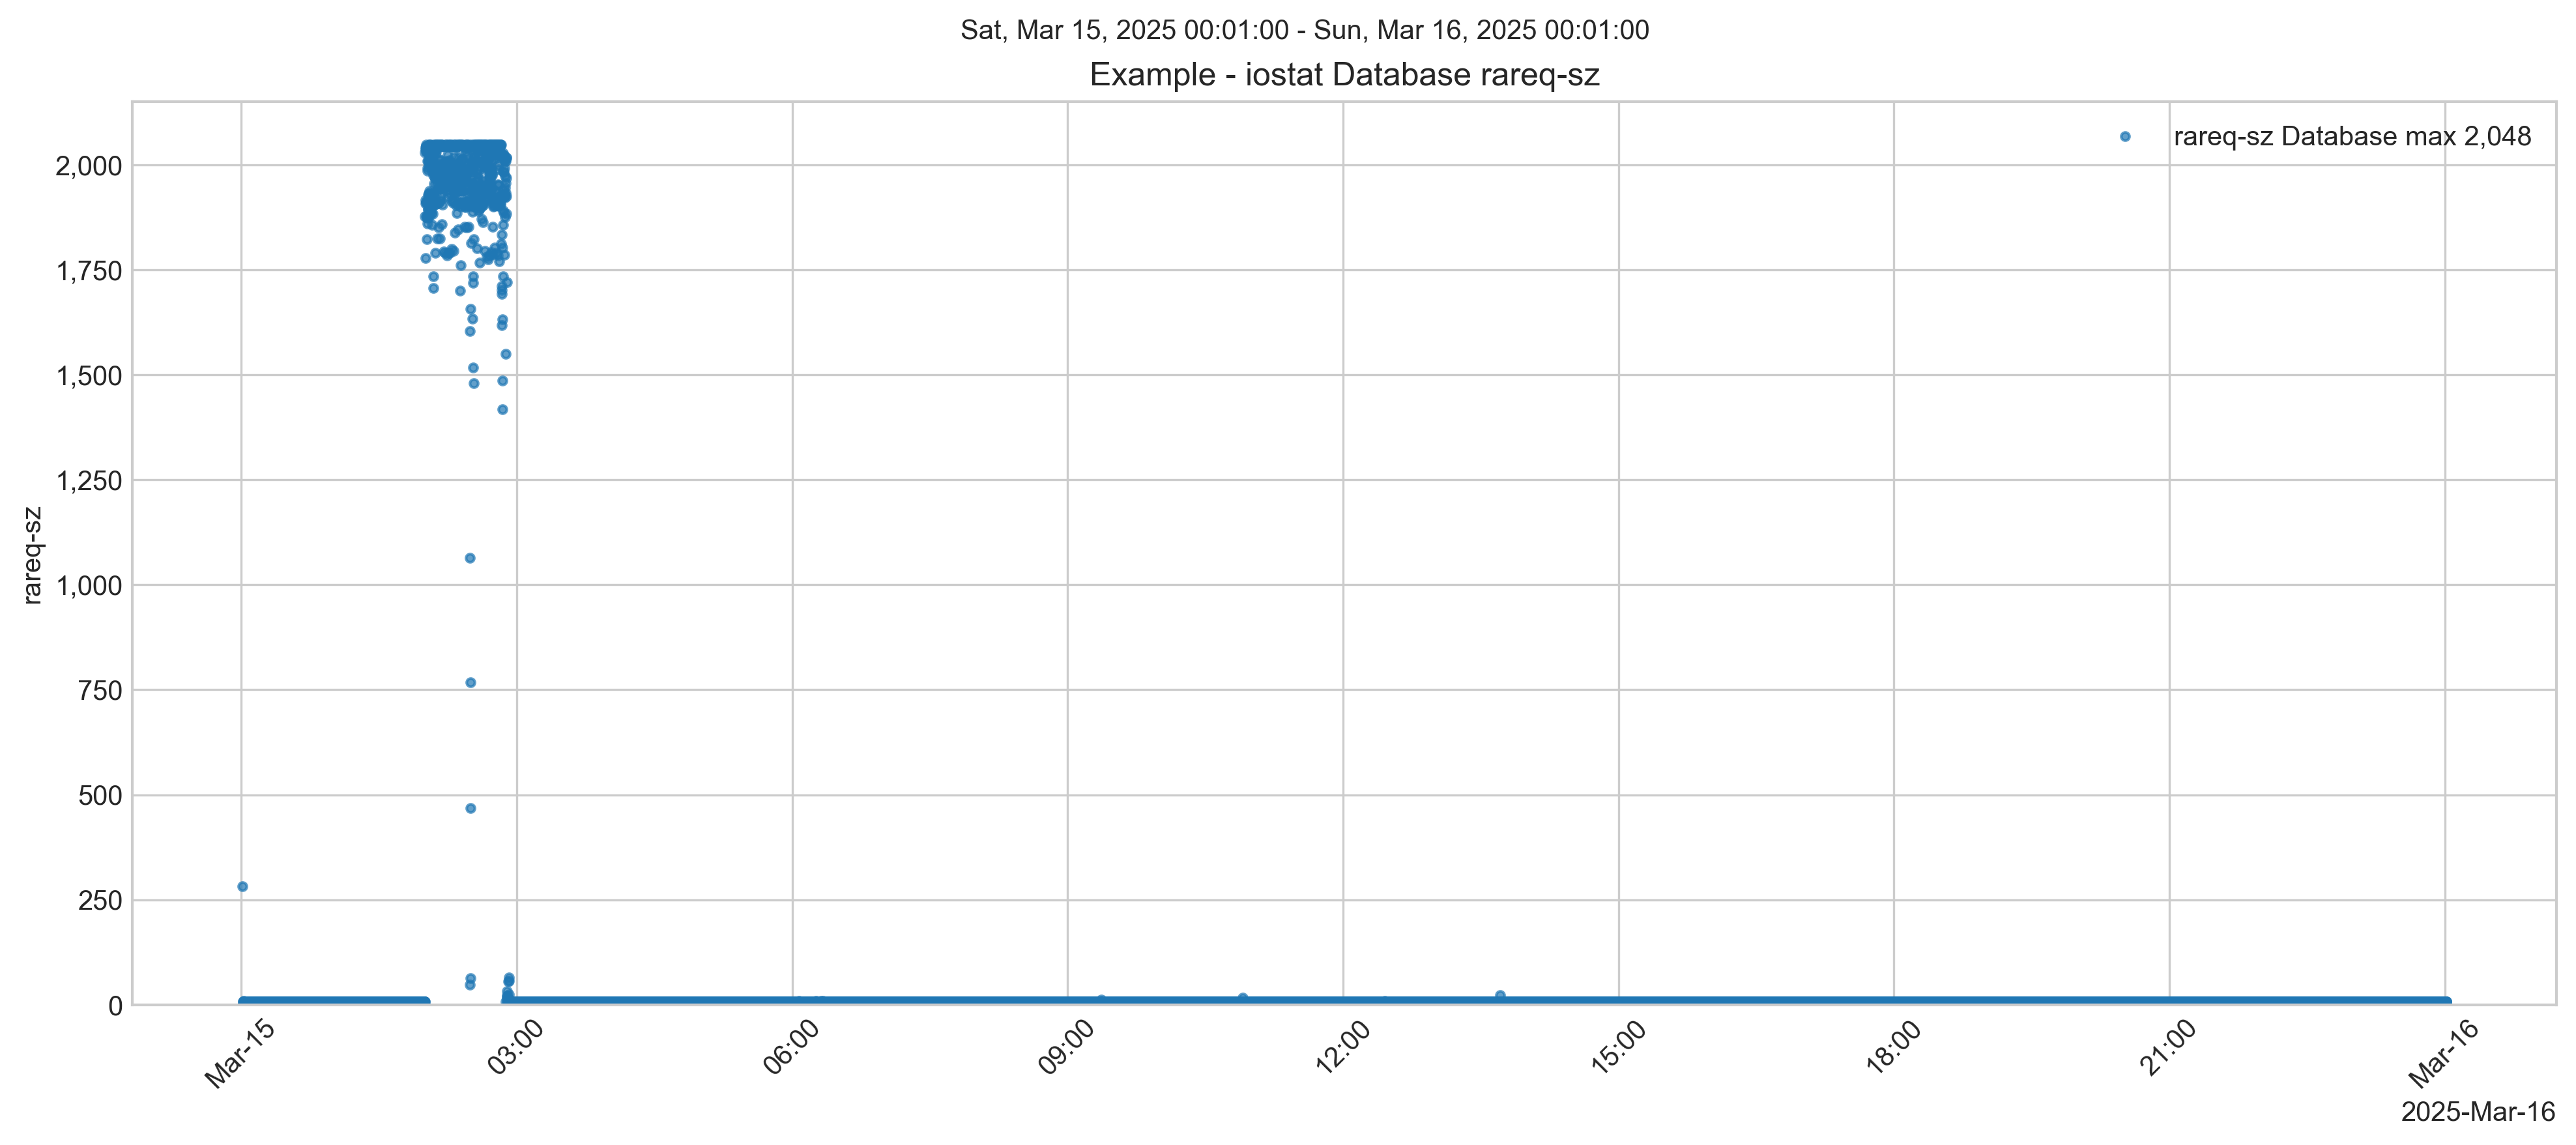
There is a burst of reads at the same time as the free memory drops. The drop in reported free memory aligns with a spike in large block-sized reads (2048 KB request size) shown in iostat for the database disk. This is very likely a backup process or file copy operation. Ok, so correlation isn't causation, but this is worth looking at, and it turns out, explains what's going on.
Let's look at some other output from ^SystemPerformance. The command free -m is run at the same rate as vmstat (for example, every 5 seconds), and is output with a date and time stamp, so we can also chart the counters in free -m.
The counters are:
- Memtotal – Total physical RAM.
- used – RAM in active use (apps + OS + cache).
- free – Completely unused RAM.
- shared – Memory shared between processes.
- buf/cache – RAM used for buffers & cache, reclaimable if needed.
- available – RAM still usable without swapping.
- swaptotal – Total swap space on disk.
- swapused – Swap space currently in use.
- swapfree – Unused swap space.
Why does free memory drop at 2 am?
- The large sequential reads fill the filesystem page cache, temporarily consuming memory that appears as "used" in
free -m. - Linux aggressively uses otherwise idle memory for caching I/O to improve performance.
- Once the backup ends (≈ 03:00), memory is gradually reclaimed as processes need it.
- Around 6 am, the hospital starts to get active, and memory is used for IRIS and other processes.
Low free memory is not a shortage, but rather the system utilising "free" memory for caching. This is normal Linux behaviour! The backup process is reading large amounts of data, which Linux aggressively caches in the buffer/cache memory. The Linux kernel converts "free" memory into "cache" memory to speed up I/O operations.
Summary
The filesystem cache is designed to be dynamic. If a process requires memory, it will be immediately reclaimed. This is a normal part of Linux memory management.
Does Huge Pages have an impact?
For performance and to reserve memory for IRIS shared memory, the best practice for production IRIS deployments on servers with large memory is to use Linux Huge Pages. For IntelliCare, a rule of thumb I use is to use 8 GB memory per core and around 75% of memory for IRIS shared memory -- Routine and Global buffers, GMHEAP, and other shared memory structures. How shared memory is divided up depends on application requirements. Your requirements could be completely different. For example, using that CPU to memory ratio, is 25% enough for your application IRIS processes and OS processes?
InterSystems IRIS uses direct I/O for database and journal files, which bypasses the filesystem cache. Its shared memory segments (globals, routines, gmheap, etc.) are allocated from Huge Pages.
- These huge pages are dedicated to IRIS shared memory and do not appear as "free" or "cache" in
free -m. - Once allocated, huge pages are not available for filesystem cache or user processes.
This explains why the free -m metrics look "low" even though the IRIS database itself is not starved of memory.
How is the free memory for a process calculated?
From above, in free -m, the relevant lines are:
- free – Completely unused RAM.
- available – RAM still usable without swapping.
Available is a good indicator — it includes reclaimable cache and buffers, showing what’s actually available for new processes without swapping. What processes? For a review, have a look at InterSystems Data Platforms and Performance Part 4 - Looking at Memory . A simple list is: Operating system, other non-IRIS application processes, and IRIS processes.
Let's look at a chart of the free -m output.
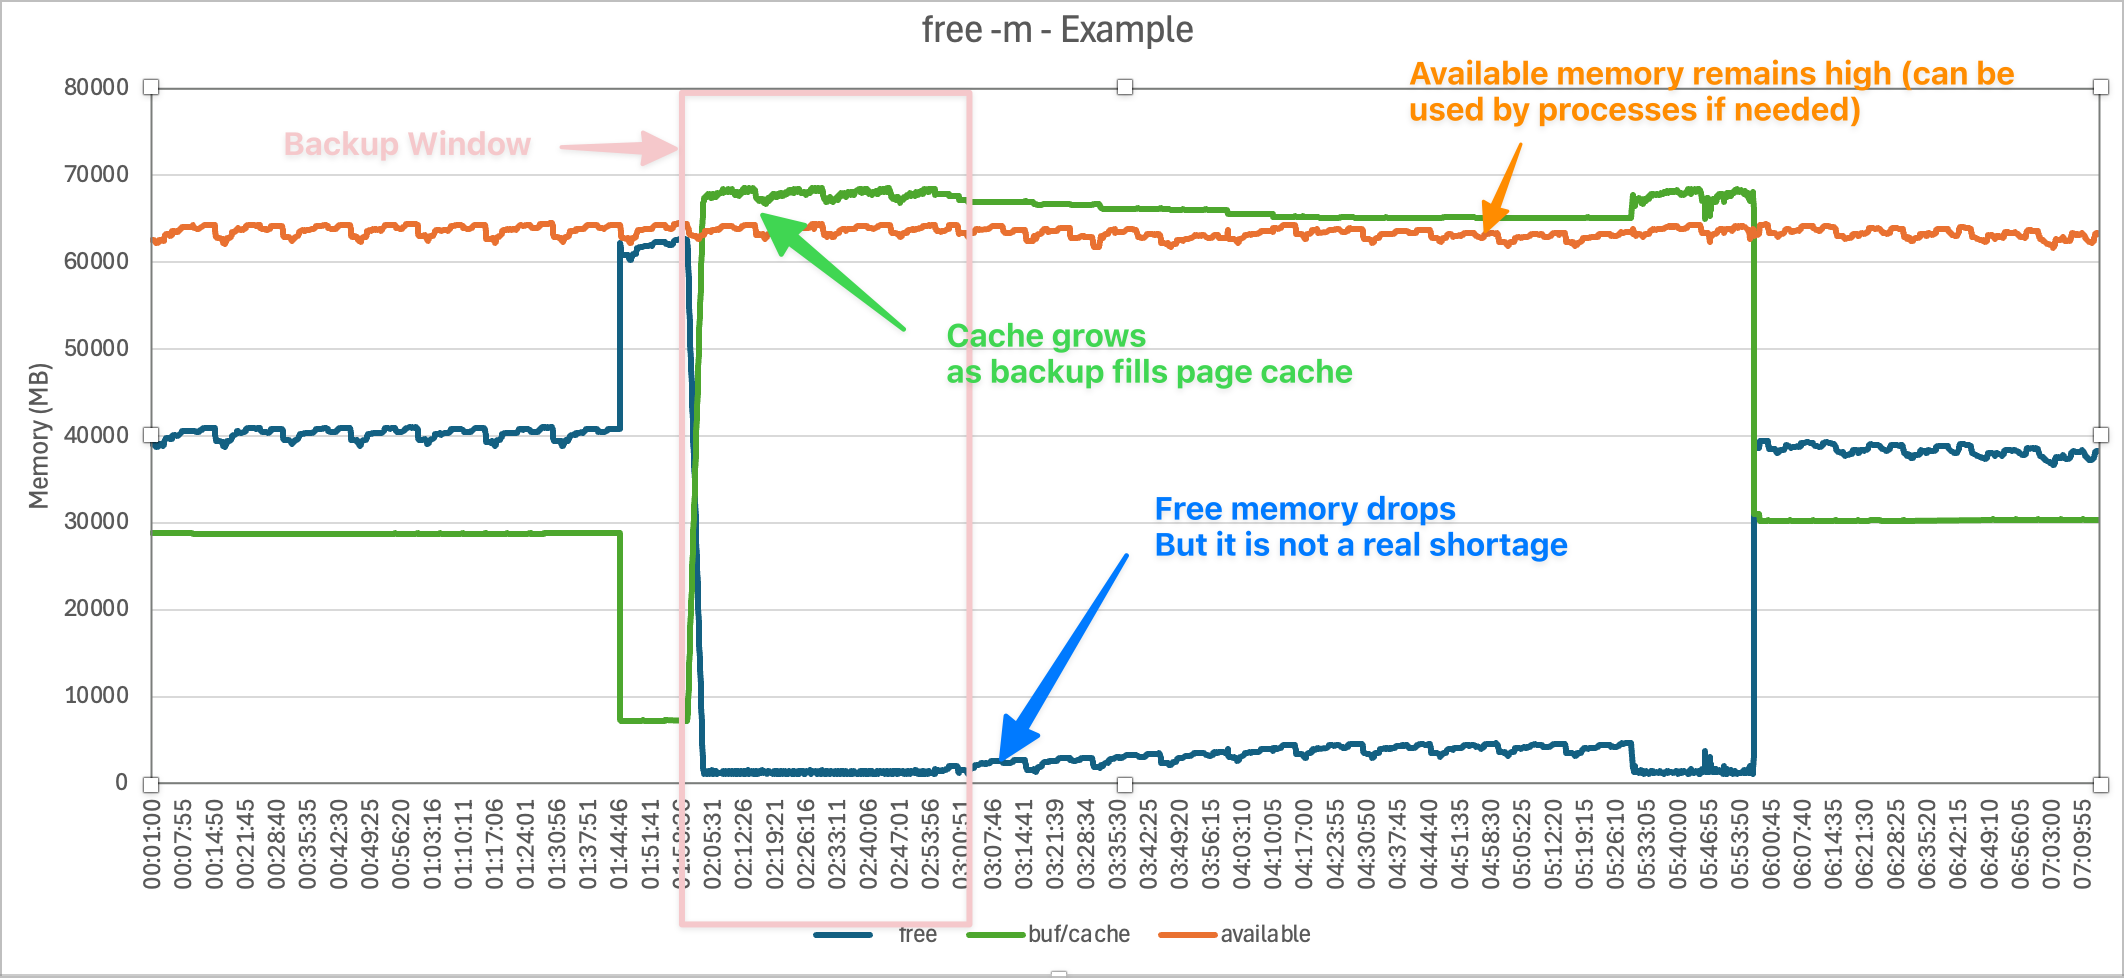
Although free drops near zero during the backup, available remains much higher (tens of GB). That means the system could provide that memory to processes if needed.
Where do huge pages appear in free?
By default, free -m does not show huge pages directly. To see them, you need /proc/meminfo entries like HugePages_Total, HugePages_Free, and Hugepagesize.
Because the OS reserves huge pages at startup, they are effectively invisible to
free -m. They are locked away from the general memory pool.
Summary
- The low "free memory" seen around 02:00 is caused by the Linux page cache being filled by backup reads. This is expected behaviour and does not indicate a memory shortage.
- Huge pages reserved for IRIS are unaffected and continue serving the database efficiently.
- The actual memory available to applications is best measured by the
availablecolumn, which shows the system still has sufficient headroom.
But wait, what about if I don't use Huge Pages?
It is common not to use Huge Pages on non-production or systems with limited memory -- performance gains of Huge Pages are usually not significant under 64 GB, although it is still best practice to use Huge Pages to protect IRIS shared memory.
Sidebar. I have seen sites get into trouble by allocating Huge Pages smaller than shared memory, which causes IRIS to try and start with very small global buffers or fail to start if memlock is used (consider memlock=192 for production systems).
Without Huge Pages, IRIS shared memory segments (globals, routines, gmheap, etc.) are allocated from normal OS memory pages. This would show up under “used” memory in free -m. It would also contribute to “available” going lower, because that memory can’t easily be reclaimed.
- used – Much higher, reflecting IRIS shared memory + kernel + other processes.
- free – Likely lower, because more RAM is permanently allocated to IRIS in the regular pool.
- buf/cache – Would still rise during backups, but the apparent headroom for processes would look tighter because IRIS memory is in the same pool.
- available – Closer to the true “free + reclaimable cache” minus IRIS memory. This would look smaller than in your Huge Pages setup.
So, should you use Huge Pages on production systems?
YES!
For memory protection. IRIS shared memory is protected from:
- Swap out during memory pressure.
- Competition with filesystem operations like backups and file copies, as we have seen in this example.
Other notes - into the weeds...
How is the data collected?
The command used in ^SystemPerformance for a 24-hour collection (17280 seconds) with 5 second tick is:
free -m -s 5 -c 17280 | awk '{now=strftime(""%m/%d/%y %T""); print now "" "" $0; fflush()}' > ","/filepath/logs/20250315_000100_24hours_5sec_12.log
Comments
Great overview, I have had plenty of discussions with IT departments who don't understand that Linux, and Windows, will use available resources, especially for IO, and it is only an issue if it is persistent or unusual, and obviously if there are performance/stability issues.
Being able to provide metrics over time and proving it is "normal" usually helps.
Hi Murray,
Your (yet another) excellent overview inspired me for a small question.
InterSystems IRIS uses direct I/O for database and journal files, which bypasses the filesystem cache.
Our in-house IRIS starts with messages:
Startup of InterSystems IRIS [IRIS for UNIX (Ubuntu Server 20.04 LTS for x86-64) 2022.1.3 (Build 668U) Fri Apr 7 2023 12:46:56 EDT]
	in /vol/IRIS/bin/
	with mgr: /vol/IRIS/mgr
	with wij: /vol/IRIS/mgr/IRIS.WIJ
	from: /vol/IRIS/mgr/
  OS=[Linux], version=[#236-Ubuntu SMP Fri Apr 11 19:53:21 UTC 2025], release=[5.4.0-216-generic], machine=[x86_64]
  nodename=[irisunicodefull.myhome.com].
  numasyncwijbuf: 2, wdwrite_asyncio_max: 64, wijdirectio: on, synctype: 3
  System Initialized.
Are there some signs that direct i/o is used for database access?
If not, how can one recognize which type of i/o (direct or async) is used for each kind of IRIS i/o (database, WIJ, journal)?
💡 This article is considered InterSystems Data Platform Best Practice.