Visualizing the data jungle -- Part III. Excursion to heat maps based on %SYS.MONLBL
Code coverage and performance optimization of code has come up a bunch of times already, so most of you should already be aware of the SYS.MONLBL utility. Often a visual approach to looking at code is much more intuitive than pure numbers, which is pretty much the whole point of this article series. This time we will take a slight excursion away from python and its tools and are going to explore generating heatmaps from ^%SYS.MONLBL reports.
As a quick reminder a heatmap is just a specific visualization tool, which gives us an overview of data where colors represent a certain value. In our case the data is going to be lines of code, with the time being spent in them mapped to colors.
^%SYS.MONLBL
For details about running the line-by-line monitor, check out the documentation. In short, are going to work with the full output of an analysis as CSV file. It is a lot more useful if we actually have the sourcecode to the code we are trying to analyse. Be sure to compile your code with the k flag (keep source).
Prepare the output
As targe output we are going to use a prepared html file. This will just include the very basic layout and a little javascript function to do the final coloring.
        <!-- Place favicon.ico and apple-touch-icon.png in the root directory -->
        <link rel="apple-touch-icon" href="apple-touch-icon.png">

        <link rel="stylesheet" href="https://cdnjs.cloudflare.com/ajax/libs/normalize/4.2.0/normalize.min.css">

        <!--<link rel="stylesheet" href="css/main.css"> -->


    </head>

    <body onload="colorize()">
        <!--[if lt IE 8]>
            <p class="browserupgrade">You are using an <strong>outdated</strong> browser. Please <a href="http://browsehappy.com/">upgrade your browser</a> to improve your experience.</p>
        <![endif]-->


<table id="data">
<tr><th>Routine</th><th>Line</th><th>Total Time</th><th>Code</th></tr>
<!--output-->
</table>
Parsing and putting it together
Getting the relevant information out of the generated CSV and putting it into our template is being done by the following scripts:
monlbl.sh
#!/bin/bash

cat $1|grep -vi totals| awk -F"," 'FNR>1 {out="<tr><td>"$1"</td>" "<td>" $2 "</td><td>" $54 "</td><td><pre>"; for(i=55;i<=NF;i++){out=out$i","}; out=substr(out, 1, length(out)-1) "</pre></td></tr>"; print out }'
gen-heatmap.sh
#!/bin/bash
./monlbl.sh $1 > /tmp/temp.data
sed -e '/<!--output-->/r/tmp/temp.data' template.html
Which we call like this:
./gen-heatmap.sh /tmp/report.csv > heatmap.html
The final output
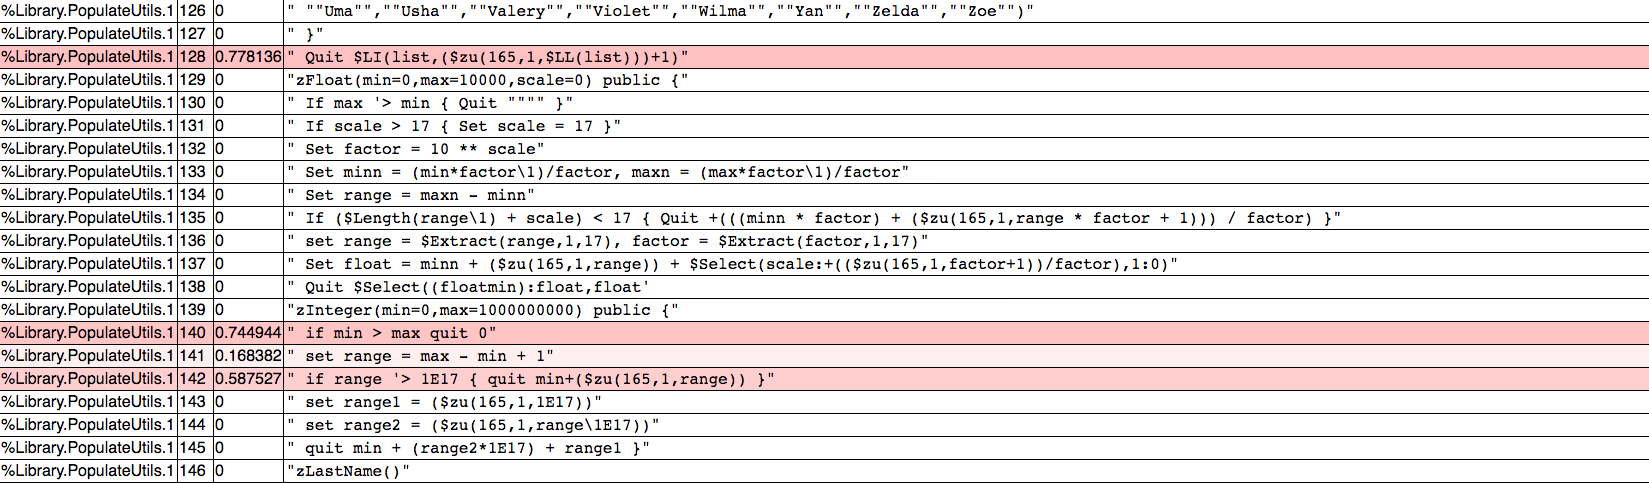
Adjustables
If you take a closer look at the colouring function in our template, you'll see I'm not using a linear mapping for the times:
    function colorize() {
        var rows=$("#data tr")
        var max=Math.max.apply(Math,rows.slice(1,rows.length).map(function(){ return this.childNodes[2].textContent}))
        for (i=1;i<rows.length;i++){
            var val=rows[i].childNodes[2].textContent;
            var c=(Math.pow(1-val/max,3))*255;
            var col=rgba(255,c,c,0.7);
            console.log(col);
            rows[i].style.backgroundColor=col;
        }
    }
I found this to work fairly well with the examples I tested, but your mileage may vary. Obviously you can increase the exponent to push it more into the red, or vice versa.
Code
You can find all of the relevant files here