[Fixed] How to enable the visual trace for HTTP Operation
Hi,
I have a HealthShare HealthConnect operation which uses the EnsLib.HTTP.OutboundAdapter. It is using a custom Operation class to send HTTP Post request. The request data that is sent to the operation and the response back from the operation is not displayed on the visual trace. Is there anyway to display this data in the trace?
.png)
Thank you for your help.
Comments
.jpg)
Under settings, select the "Log Trace Events" and "Archive IO".

I hope this helps?
Its already enabled but Thank you Richard
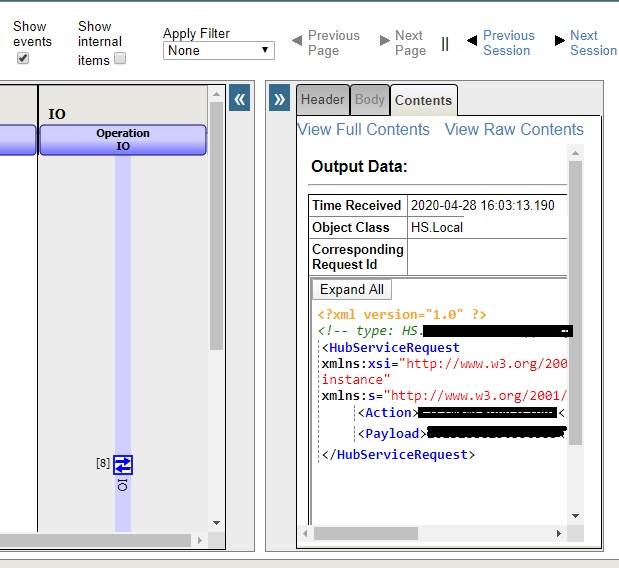
That is odd... I see a blue diamond in the "IO" lane, and when I select it, it shows the "Output Data" to the right... I don't see the "IO" lane in your snip at all... so it must be something else?
From your screenshot, I see you're using a custom message class ORMFARM.amplitudeHTTPRequest. Have you extended the class to include Ens.Request?
I recently had a similar project and to get the request and response message bodies to show in trace, I had to include Ens.Request and Ens.Response (respectively) in my class definition:
Class MyRequestClassExample Extends (Ens.Request, Ens.Util.MessageBodyMethods, %JSON.Adaptor)
{
Property Example As %String;
}
Thank you @Craig Regester
I tried to extend the Ens.Requset class but its still not showing the trace.
Can you paste in the full class definition for ORMFARM.amplitudeHTTPRequest?
Thank you all for your help with this query. I got this resolved now.
I had property defined with Content -> MIXED.
Property MessageStream As %GlobalCharacterStream(CONTENT = "MIXED");
Removing the content seems to fix the issue.
Thanks
Mary