Why does InterSystems have no out-of-the-box ESB solution? Let’s try to fix it!
I was really surprised that such a flexible integration platform with a rich toolset specifically for app connections has no out-of-the-box Enterprise Service Bus solution. Like Apache ServiceMix, Mule ESB, SAP PI/PO, etc, what’s the reason? What do you think? Has this pattern lost its relevance completely nowadays? And everybody moved to message brokers, maybe?
Wiki time: An enterprise service bus (ESB) implements a communication system between mutually interacting software applications in a service-oriented architecture (SOA) ... Its primary use is in enterprise application integration (EAI) of heterogeneous and complex service landscapes.
Anyway, I googled "IRIS ESB" and found this topic in the documentation. But it looks a little weird to me. Like ESB means only Service Registry and pass-through services. And if Service Registry is a really good feature (not only for ESB), pass-through services, in my opinion, are completely not about ESB. Yes, we can use a Bus for pass-through data flows for some reasons, at least for centralized logging. But pass-through is contrary to the major ESB sense - to centralize integration implementation. Like in an ERP application, we wanna to fuse accounting, order management, manufacturing, HR, and so on. ESB it's the way to put together integration code into one platform. Even though this task can't be done 100%, using this pattern gives real advantages in heterogeneous IT environments. Especially if connected applications are hard/expensive to extend.
And I'm not talking about a bunch of other great features. Such as monitoring of everything that happens between apps, reusing data from data flows, and code between integrations. Garanty delivery for all flows and simple investigation of data transfer issues in a one-window UI. Fast and cheap replacement of ecosystem members through high standardization of the integration code. A ready-to-use platform for enterprise API, as it already connects to any apps in your landscape, and many other great features! I'm a big fan of the ESB pattern, as you might guess!
So, I wanna to show you one of my pet projects - IRIS ESB. It's a try to implement some typical ESB features on the InterSystems IRIS Data Platform, such as:
- Centralize integration code in one place
- Message management (message broker) with guaranteed delivery based on Pub/Sub architecture
- Message validation against the Data Model (Data Schema)
- Flexible API to receive any message types (using payload container)
- Centralized monitoring and alerting control
This project contains three main modules. Let us take a look at them.
Message Broker (Broker.*)
Message Broker is designed to keep messages and create separate message consumers, each of which can be independently subscribed to a message queue. It means all consumers have their own inbound queue by message type (not literally). Messages have statuses: NEW, PENDING (processing in progress), ERROR, and OK (message successfully processed). The main function of this Message Broker is to guarantee the delivery of messages. The message will be resending again and again until one of two events happens: successful message processing or the end of message lifetime (message expired).
IRIS ESB uses a slightly improved version of the Kafka algorithm. Kafka maintains the offset of the last processed message to facilitate moving forward on the message queue. Here, we keep all processed message IDs, which allows us not to stop consuming when we have some "troubled" messages in the queue. So, IRIS ESB can restore data flows after the temporary unavailability of external systems (or if we got some "bad data") - without manual actions.
I have not used an external broker, as the same Kafka, for not to lose the coolest IRIS feature - possible to see all that happens with the messages in visual traces. Also, Kafka does not have a message guarantee delivery (usually it is based on retries) out of the box.
How to add data flow in Message Broker?
First of all, your Production must have a Broker.Process.MessageRouter business host. He is responsible for routing messages to handlers and setting message statuses. Just add MessageRouter to Production, no need for any additional settings here. It will be common for all data flows.
Next, you need a handler for the message that extends Broker.Process.MessageHandler. It is a place for your custom code for message processing: mapping and transforming to other message formats, sending to external systems via business operations, and so on.
Finally, create a consumer. It is a business service instance of a Broker.Service.InboxReader class. It will read messages from the queue and transfer them to the handler. Set up its Settings, where:
MessageHandler- Your handler aboveMessageType- On what kind of message do we wanna subscribe to? It is a full analogy topic in the KafkaMessageLifetime- When will the message expire? It can be different for each consumer
Inbox REST API (Inbox.*)
Each ESB should have a universal way to receive messages from external systems. Here it's a REST API. Universal means you can send any JSON payload to this API. The received JSON text will be deserialized into the Cache class and placed in the Inbox queue. IRIS ESB works with class objects, not %DynamicObject, for example, becouse validation of messages is one more important feature of the ESB pattern. And importing JSON text to the class, I believe, is the best way for it.
So, to add a new custom message type, you need to create a class (or import it from some schema) that extends Inbox.Message.Inbound and describes the structure of your message (see samples in the Sample.Message.* package). When you send a message to the Inbox API, set the name of this class as the import_to parameter.
Inbox API testing
There are two endpoints for this API:
GET http://localhost:9092/csp/rest/healthcheck- just a simple health check. Should return 200 OK if all is set up the right wayPOST http://localhost:9092/csp/rest/v1/inbox- put a new message into ESB
To put into the ESB a new sample of "Customer Order", you need to make the following request via CURL or Postman:
curl --location 'http://localhost:9092/csp/rest/v1/inbox?import_to=Sample.Message.CustomerOrder.Order' \
--header 'Content-Type: application/json' \
--data '{
    "CreatedAt": "2021-01-01T00:00:00.000Z",
    "OrderId": 1,
    "OrderStatus": "NEW",
    "Customer": {
        "FirstName": "John",
        "LastName": "Doe"
    },
    "Items": [
        {
            "ProductId": 1,
            "ProductName": "Product 1",
            "Quantity": 2
        },
        {
            "ProductId": 2,
            "ProductName": "Product 2",
            "Quantity": 1
        }
    ]
}'
And one more sample for "Array of Strings" message:
curl --location 'http://localhost:9092/csp/rest/v1/inbox?import_to=Sample.Message.SomeArray.Root' \
--header 'Content-Type: application/json' \
--data '[
"111",
"222",
"333"
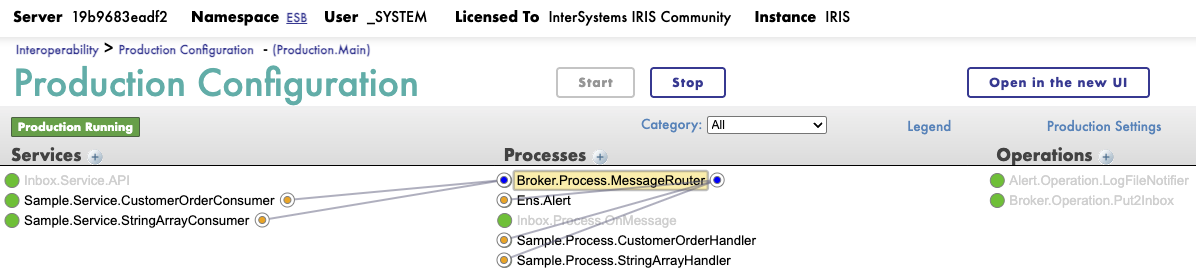
]'Visual traces for these requests can be seen in the messages of the Inbox.Service.API business service. Check: Interoperability > Production Configuration - (Production.Main).
In Production, configured two test consumers, one for "Customer Order" and the other for "Array of Strings" message types. After messages are received by the Inbox API, you can see that them were processed in the Sample.Service.CustomerOrderConsumer or Sample.Service.StringArrayConsumer services.
Monitoring and Alerting (Alert.*)
In IRIS ESB, we have a flexible alerting module to set up subscriptions and ways to deliver alerts when something goes wrong in our data flows.
How alerting works
You should create a process in Production based on the Alert.Process.Router class and call it Ens.Alert. The process, with this name, will automatically collect all alerts from Production items for which the Alert on Error flag has been raised. It is the default way to create an alert processor, described in the documentation here.
Next, you need to fill Lookup Tables names by notifier types. For example, table names can be like Alert.Operation.EmailNotifier, Alert.Operation.SMSNotifier, and so on (you can add your own notifier implementations to the Alert.Operation.* package). It must be the names of Operations in our Production. I strongly recommend using class names for Production config item names, always when it is possible.
For each of these tables, Key means the source of the exception (name of Production business host). Value means contact ID (e-mail address for EmailNotifier, for example). Value can be empty when we use the notifier without forwarding the alert to a specific address.
For testing alerts, you can just raise the ThrowError flag in one of the test handlers. In Production, already set up LogFileNotifier, so alerts will be written to /tmp/alerts.log file.
Metrics
During message processing, IRIS ESB collects various metrics, including performance sensors such as the minimum, maximum, and average time of message processing (by consumers). Additionally, collecting statistics by message status: OK, ERROR, and PENDING counters.
These metrics are published via API (see GET http://localhost:9092/api/monitor/metrics endpoint), collected by Prometheus, and visualised by Grafana. Web UI for these applications is available at:
http://localhost:9090- Prometheushttp://localhost:3000- Grafana
Added custom metrics have a tag esb_broker.
Try it
You must have installed Docker Desktop and Git on your local PC. Clone the repository and run Docker containers:
git clone https://github.com/ogurecapps/iris-esb.git
cd iris-esb
docker-compose up -d
Interoperability Production will be available on the URL (use default credentials _systemSYS for login): http://localhost:9092/csp/esb/EnsPortal.ProductionConfig.zen?$NAMESPACE=ESB
Send test messages as described in the Inbox API testing paragraph. You can see traces of receiving messages in the Inbox.Service.API and traces of processing messages in the Sample.Service.CustomerOrderConsumer.
Open Grafana at http://localhost:3000 (default credentials are adminadmin).
- Add a data source: choose Prometheus as data source type and enter Server URL as
http://host.docker.internal:9090 - Add dashboard: select "New > Import" and take a ready-to-use dashboard JSON config file from this Developer Community article, for example
Enjoy! Now you have an ESB with API and monitoring. Now it remains only to add your own message types and data flow implementations.
What about real use cases?
Yeah, I have one. I built probably the biggest ESB solution on the IRIS Data Platform using similar algorithms as described above. I don't want to reveal the company name (who knows, he knows), but I can share some counters. My IRIS ESB instance has around 800 data flows. When I say data flow, I mean sync/async point-to-point messages flow with protocol and format transformations, and optionally data enrichment. It's 50 or more combined systems, such as ERP, DWH, CRM, POS software, mobile, and e-commerce solutions. As for protocols, mostly historically uses SOAP, but the REST part grows fast. Also, we have many OData flows (just local specifics). The system does not receive a high volume of inbound requests, with a maximum of 300-350 RPS (Requests Per Second), but transfers around 3 TB of messages per week. I believe this is not so few. The server has several namespaces with a total count of business hosts in Interoperability Productions equal to 2041. Yep, I accurately calculated them.
Conclusion
That's all, Folks! Thanks for your attention. Forgive my mistakes, it's my first article for the Dev Community portal. Feel free to fork, rate my repo, and ask any questions.
Comments
I like this a lot, great write-up at the bottom about your secret customer. :-)