Two big changes for the TestCoverage open source tool: Embedded Python support, and a new UI
Embedded Python
Previously, TestCoverage could only track unit test coverage for code written in ObjectScript. It would ignore code written in other languages like Python in the coverage statistics.
As more and more IRIS application code is being written in Embedded Python instead of just ObjectScript, it's critical that TestCoverage can include coverage results for Embedded Python code. Customers (through the TestCoverage GitHub issues) as well as others in InterSystems have expressed interest in seeing Embedded Python support.
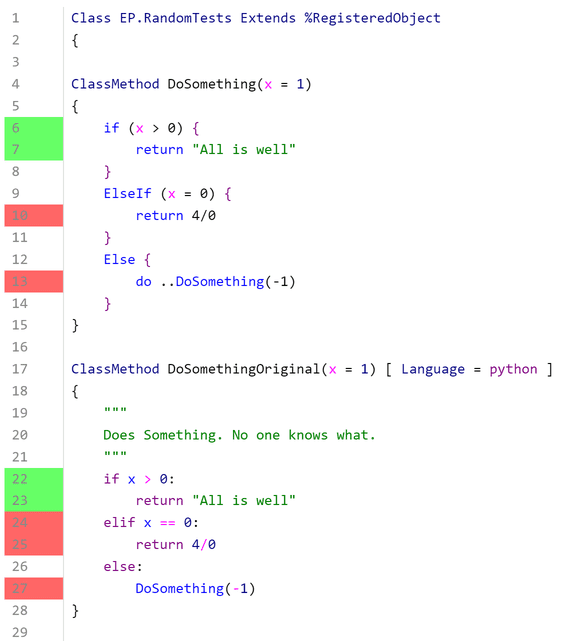
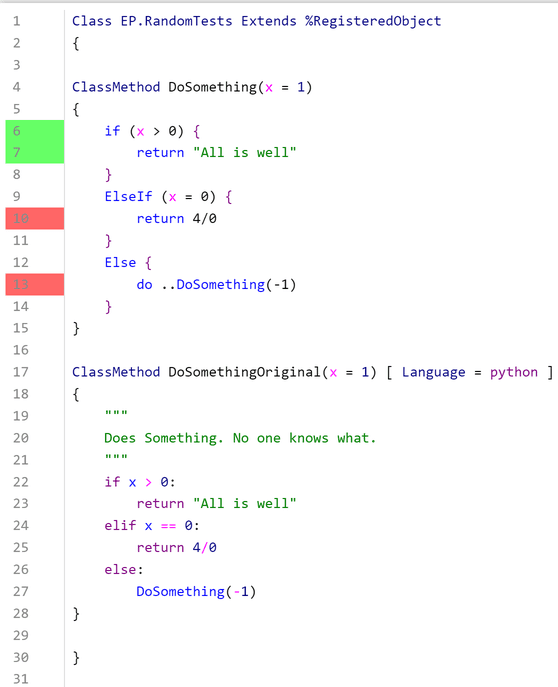
The user still installs and runs TestCoverage the same way as before, as described on the TestCoverage GitHub. The coverage results for Embedded Python code now get included in the aggregate coverage statistics as well as the individual line coloring, as displayed in the above example.
Under the hood, the Embedded Python coverage is tracked using Python's sys.settrace tracer, independently of ObjectScript's %Monitor.System.LineByLine, and then the results are combined and displayed together. This can cause very minor discrepancies in which lines are marked as executable (i.e. can be run at all). For instance, in the above picture, Python considers the elif statement as executable, but ObjectScript does not consider the ElseIf statement as executable. At the end of the day, any line of code marked red was not covered, and any line of code marked as green was still covered; this just slightly affects which lines of code we ignore, which doesn't cause any problems.
New TestCoverage UI
The previous TestCoverage UI was an old Zen UI that didn't surface many of the useful statistics that TestCoverage tracks. In addition, TestCoverage could only be run from the command line.
To solve these problems, we've created a new Angular UI building off of isc.perf.ui, the existing UI for interacting with the Line-By-Line Monitor (^%SYS.MONLBL). The web application comes with an accompanying REST API and WebSocket connection to retrieve data from the IRIS server. It also fixes the previous user authentication for isc.perf.ui, so that it now uses standard IRIS login/logout. This is also publicly available on the Open Exchange, under the name isc-perf-ui. Below are some of the new UI's features and uses.
Installation
There are some additional steps for installing isc.perf.ui if you want to use the new TestCoverage features. On Windows only, you need to enable the IIS WebSocket protocol. On any OS, you need to give a specific user (usually CSPSystem) a resource permission (usually %DB_User) in the IRIS management portal. These steps are described on the isc-perf-ui GitHub page.
Test Coverage Page
On the Test Coverage page, you can select the parameters that you want to run TestCoverage on your unit tests with.
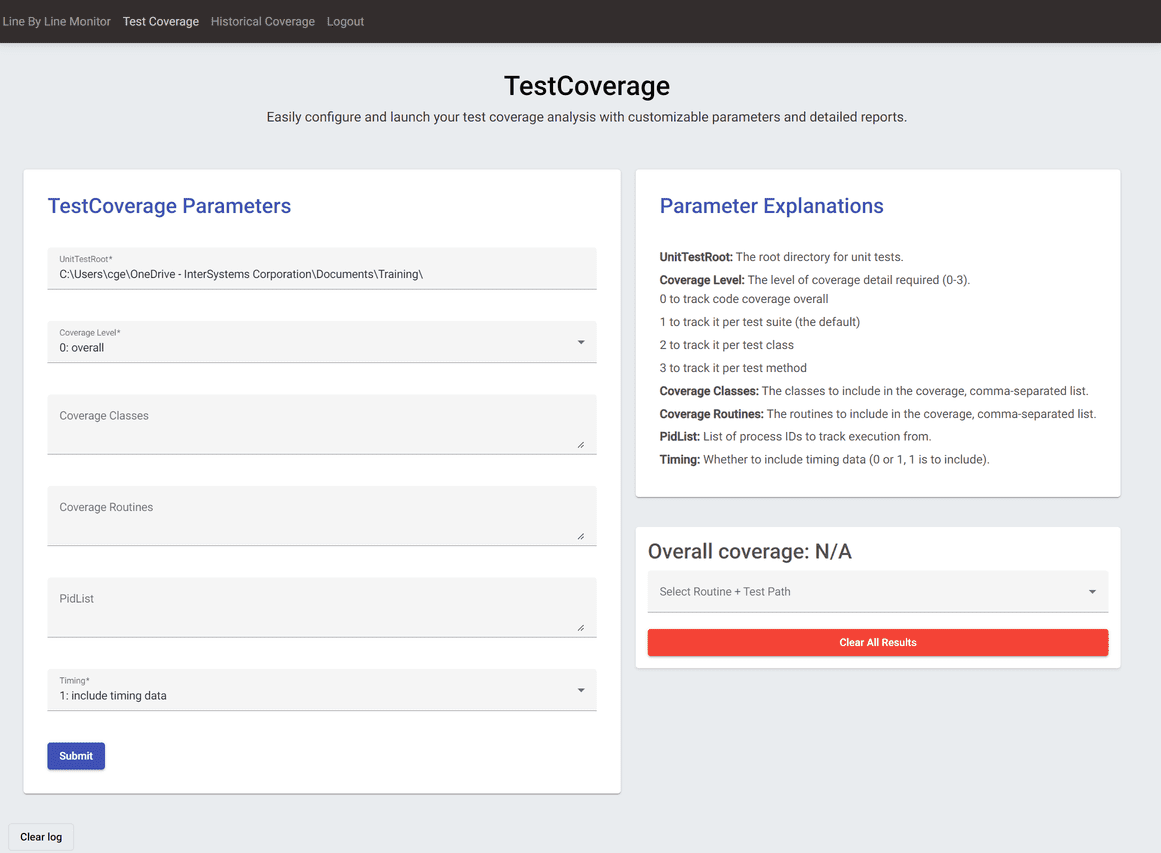
The parameter explanations include descriptions of what each of these parameters control. You can also click into an input box to see a sample value, and there's input validation to make sure that your inputs are in a valid format.
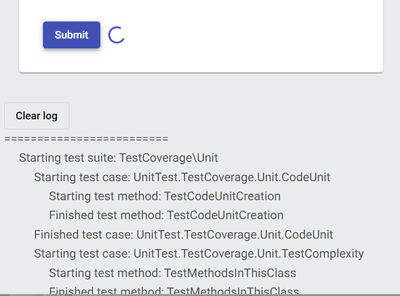
After you press submit, the call to run TestCoverage will begin, and you'll see live progress of your unit tests in the log at the bottom of the page.
After the tests have finished running, the dropdown select menu on the right should open with a list of routine + test path combinations, as well as the overall coverage percentage for your code and the link to the results of the unit tests themselves.
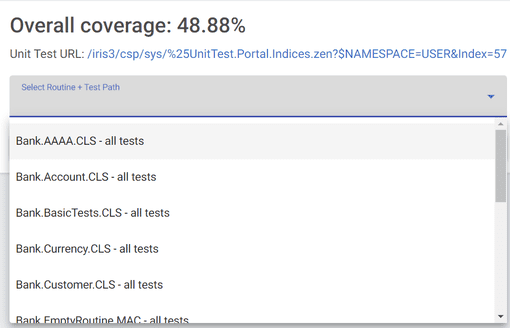
Click on any to be taken to the coverage results page for that routine under that unit test directory.
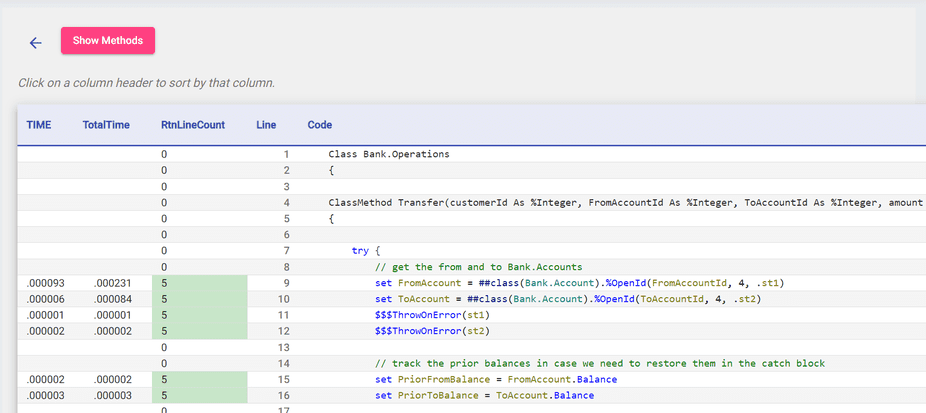
Here, you can see which lines of code were covered by your unit tests according to TestCoverage. There are also additional metrics like TotalTime, which tracks the amount of time the code spent on a certain line of code from its start to finish.
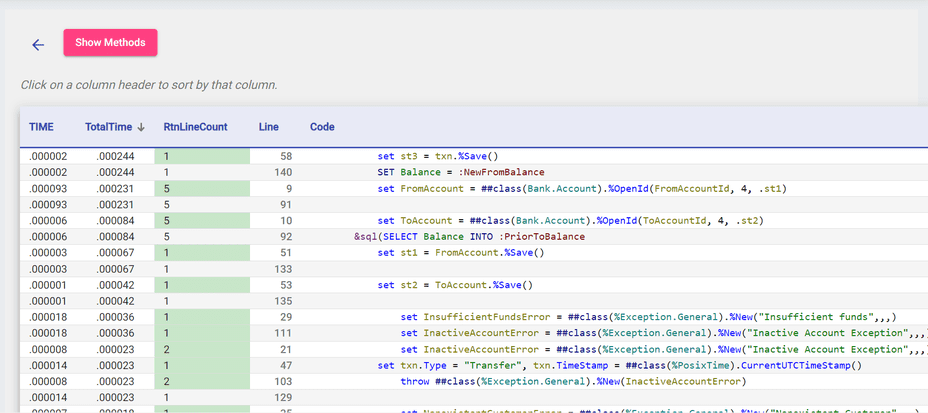
You can further sort in ascending or descending order by clicking on the arrows next to the headers; this is a useful way to see which lines of code take the longest.
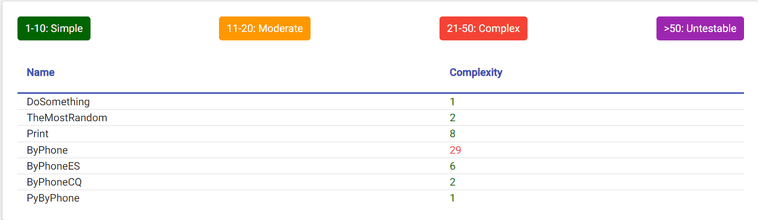
Finally, the Show Methods button opens up a table with the cyclomatic complexity of each of your methods, showing which methods are the most complex and vulnerable to bugs.
When you're done, can click the back button to go back to the launcher page. The red clear results button lets you clear all your test coverage runs.
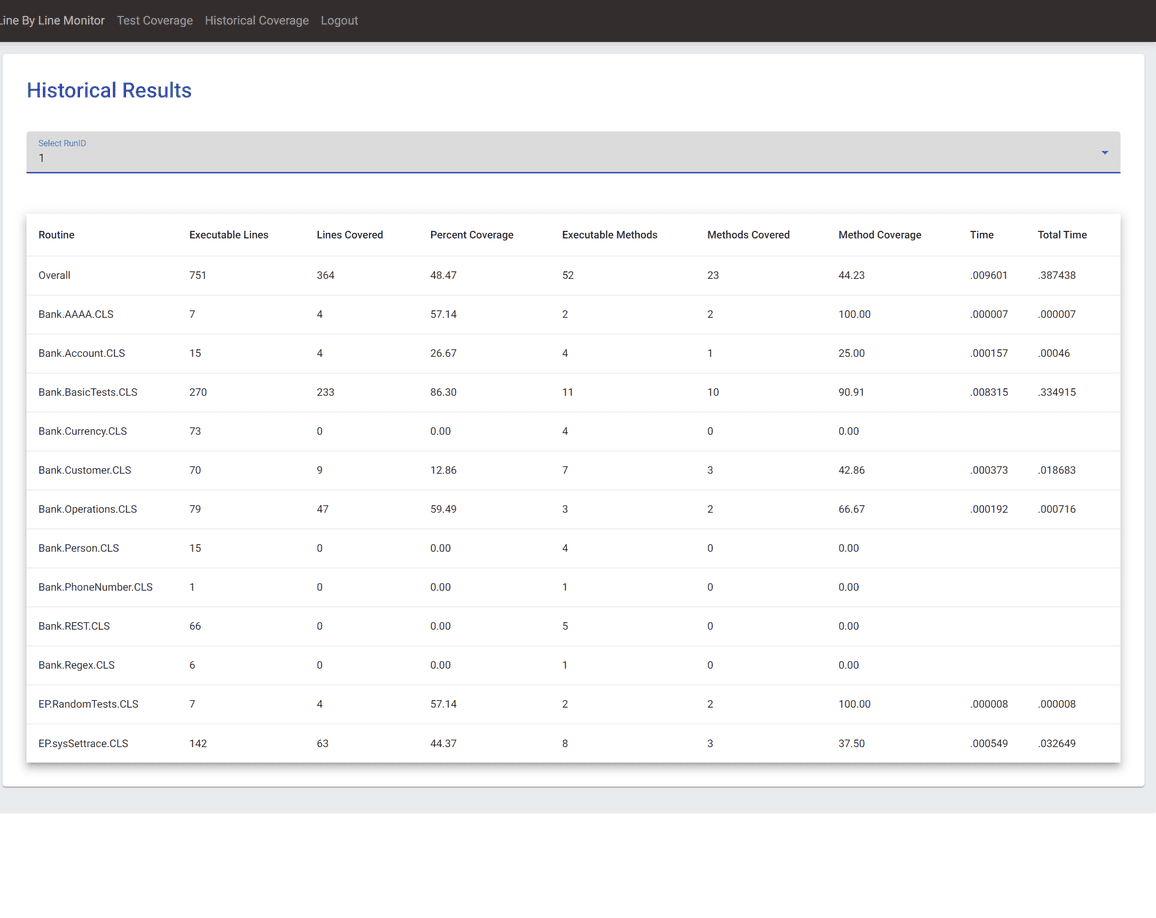
Historical Coverage Page
After clicking on a specific past Run ID, you can view the class-level coverage results (line coverage, method coverage, timing) for all the classes in that run. This is the same data as the main results page from TestCoverage. This table is also sortable by each column.
Again, both tools are available on the InterSystems Open Exchange (isc-perf-ui and Test Coverage Tool) and on GitHub. Good testing to everyone!
 Open Exchange