Profile ObjectScript with more power
InterSystems IRIS offers various ways how to profile your code, in most cases it produces enough information to find the places where the most time is spent or where the most global sets. But sometimes it's difficult to understand the execution flow and how it ended at that point.
To solve this, I've decided to implement a way to build a report in a way, so, it's possible to dive by stack down
.png)
Installation and usage
zpm "install zprofile"
#; run trace
Do ##class(caretdev.zprofile.main).Trace("Do ##class(Some.Class).Method()")")
Do ##class(caretdev.zprofile.main).Trace("Do Some^Routine")
This command has to be called from the terminal, it's the only way it can get trace, due to the limitation of ZBreak command used in the project
Go to http://localhost:52773/zprofile/index.html, and select execution
- It allows going by an execution stack, showing the executed lines and lines in between.
- The bottom line shows the total values for each metric
- Each cell visually shows the percentage of the value out of the total, which helps to easily find lines that took more time
- It's possible to run the same command again when changing some code, to see the result, just switch to another execution it will stay on the same stack level if possible
(1).gif)
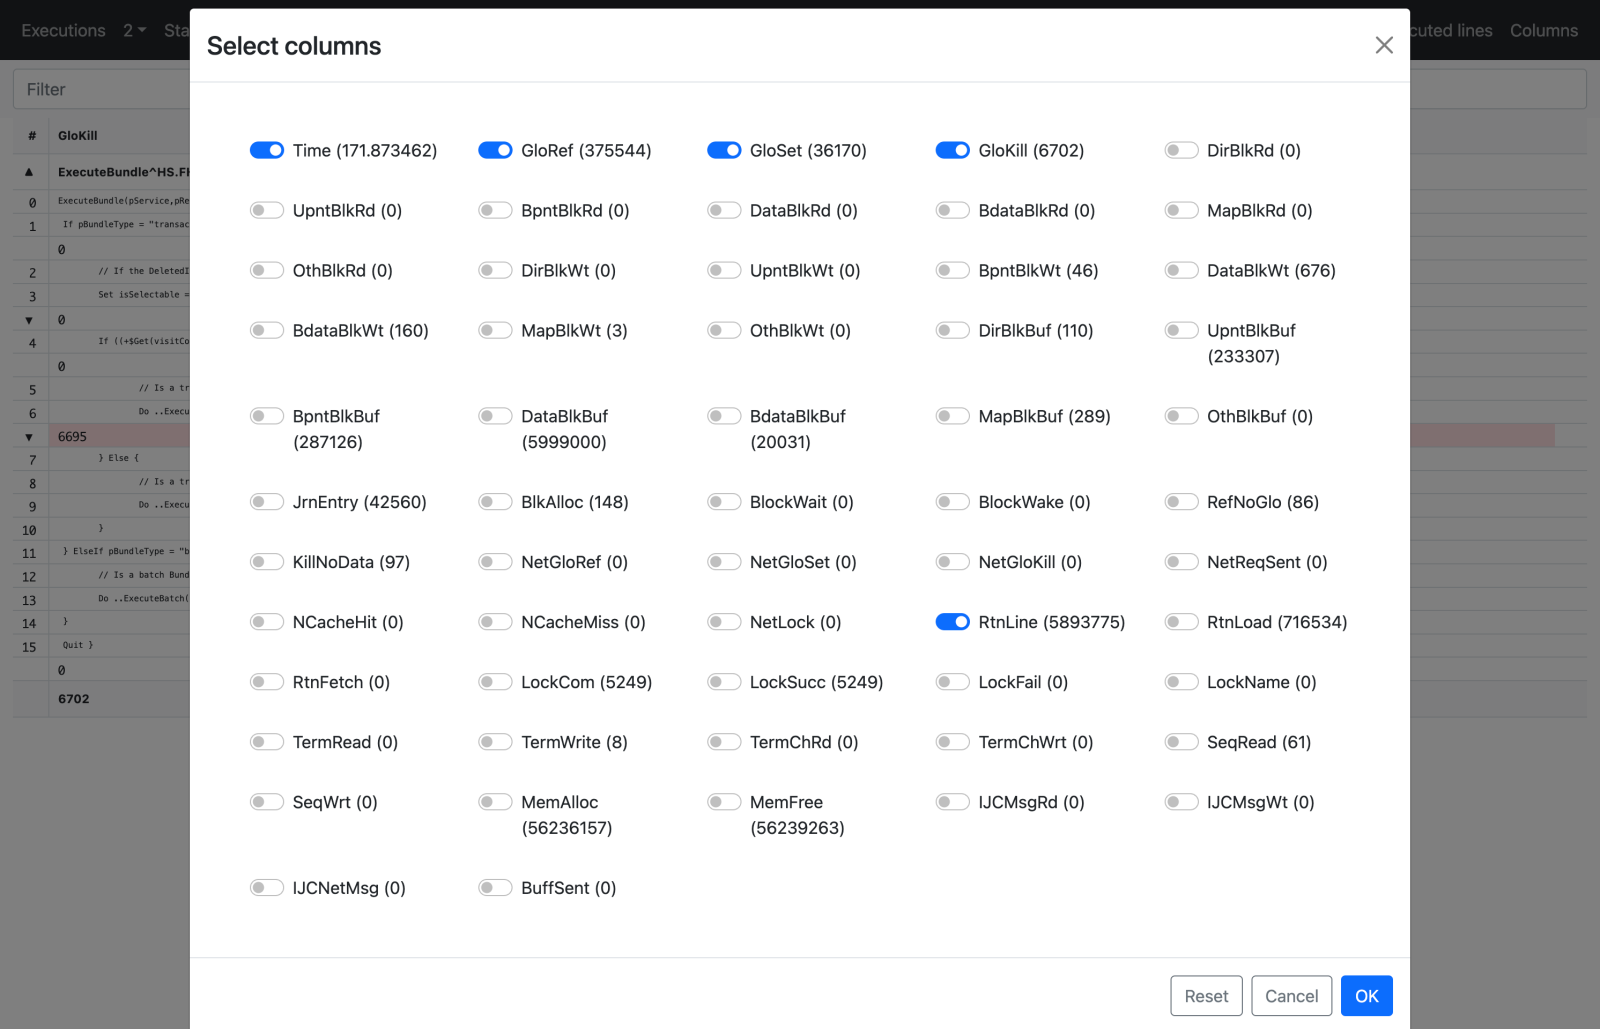
It is also possible to select columns to display
 If you find this project useful please vote on the contest
Comments
I like this very much.
Worked in terminal.
But I was not able to capture any useful profiling data when calling ##class(caretdev.zprofile.main).Trace() from within REST API (using postman).
Also "job ##class(caretdev.zprofile.main).Trace("Do ##class(Some.Class).Method()")" does not capture any profiling data.
Is it possible to make it work in those scenarios?
Yes, I forgot to mention, that it will work only from terminal, real one (with any webterminal will not work too).
It's the limitation of ZBreak, which is used in this project
So, the only case is to wrap needed in classmethod which will be possible to call from terminal
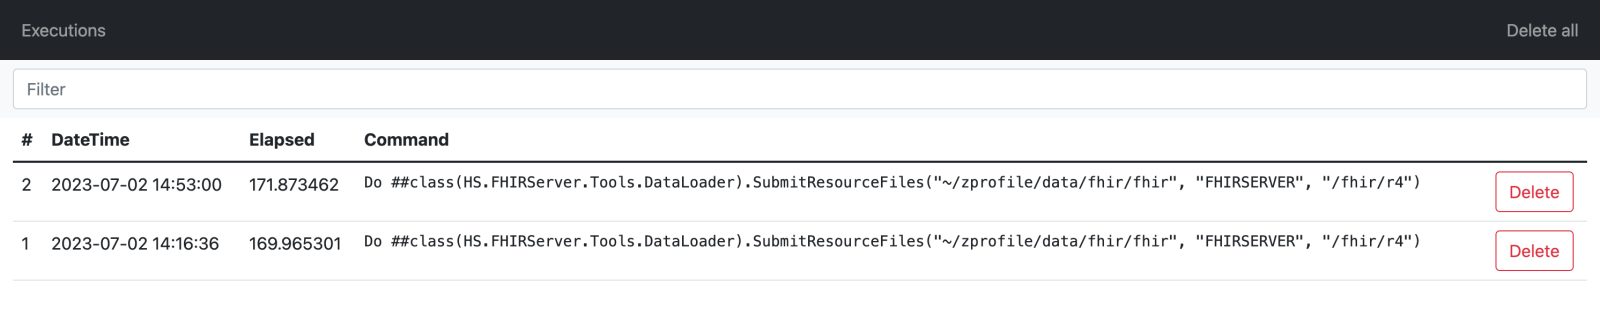
I've published online demo, where you could play with two executions of FHIR Load for two different patients.
.png)
This uncovers some interesting discoveries, like, about 40% of the time is spent on IndexResource
.png)
And about 20% to ValidateResource
.png)
Of course, this can't be very accurate, but can help to understand what actually happens during the process, and at what moment. Including finding places, where it's not just reads of globals, but sets or even kills. Something like, 17% of GloKills are happening during CommitTransactionBundle
.png)