InterSystems IRIS® CloudSQL Metrics to Google Cloud Monitoring
If you are a customer of the new InterSystems IRIS® Cloud SQL and InterSystems IRIS® Cloud IntegratedML® cloud offerings and want access to the metrics of your deployments and send them to your own Observability platform, here is a quick and dirty way to get it done by sending the metrics to Google Cloud Platform Monitoring (formerly StackDriver).
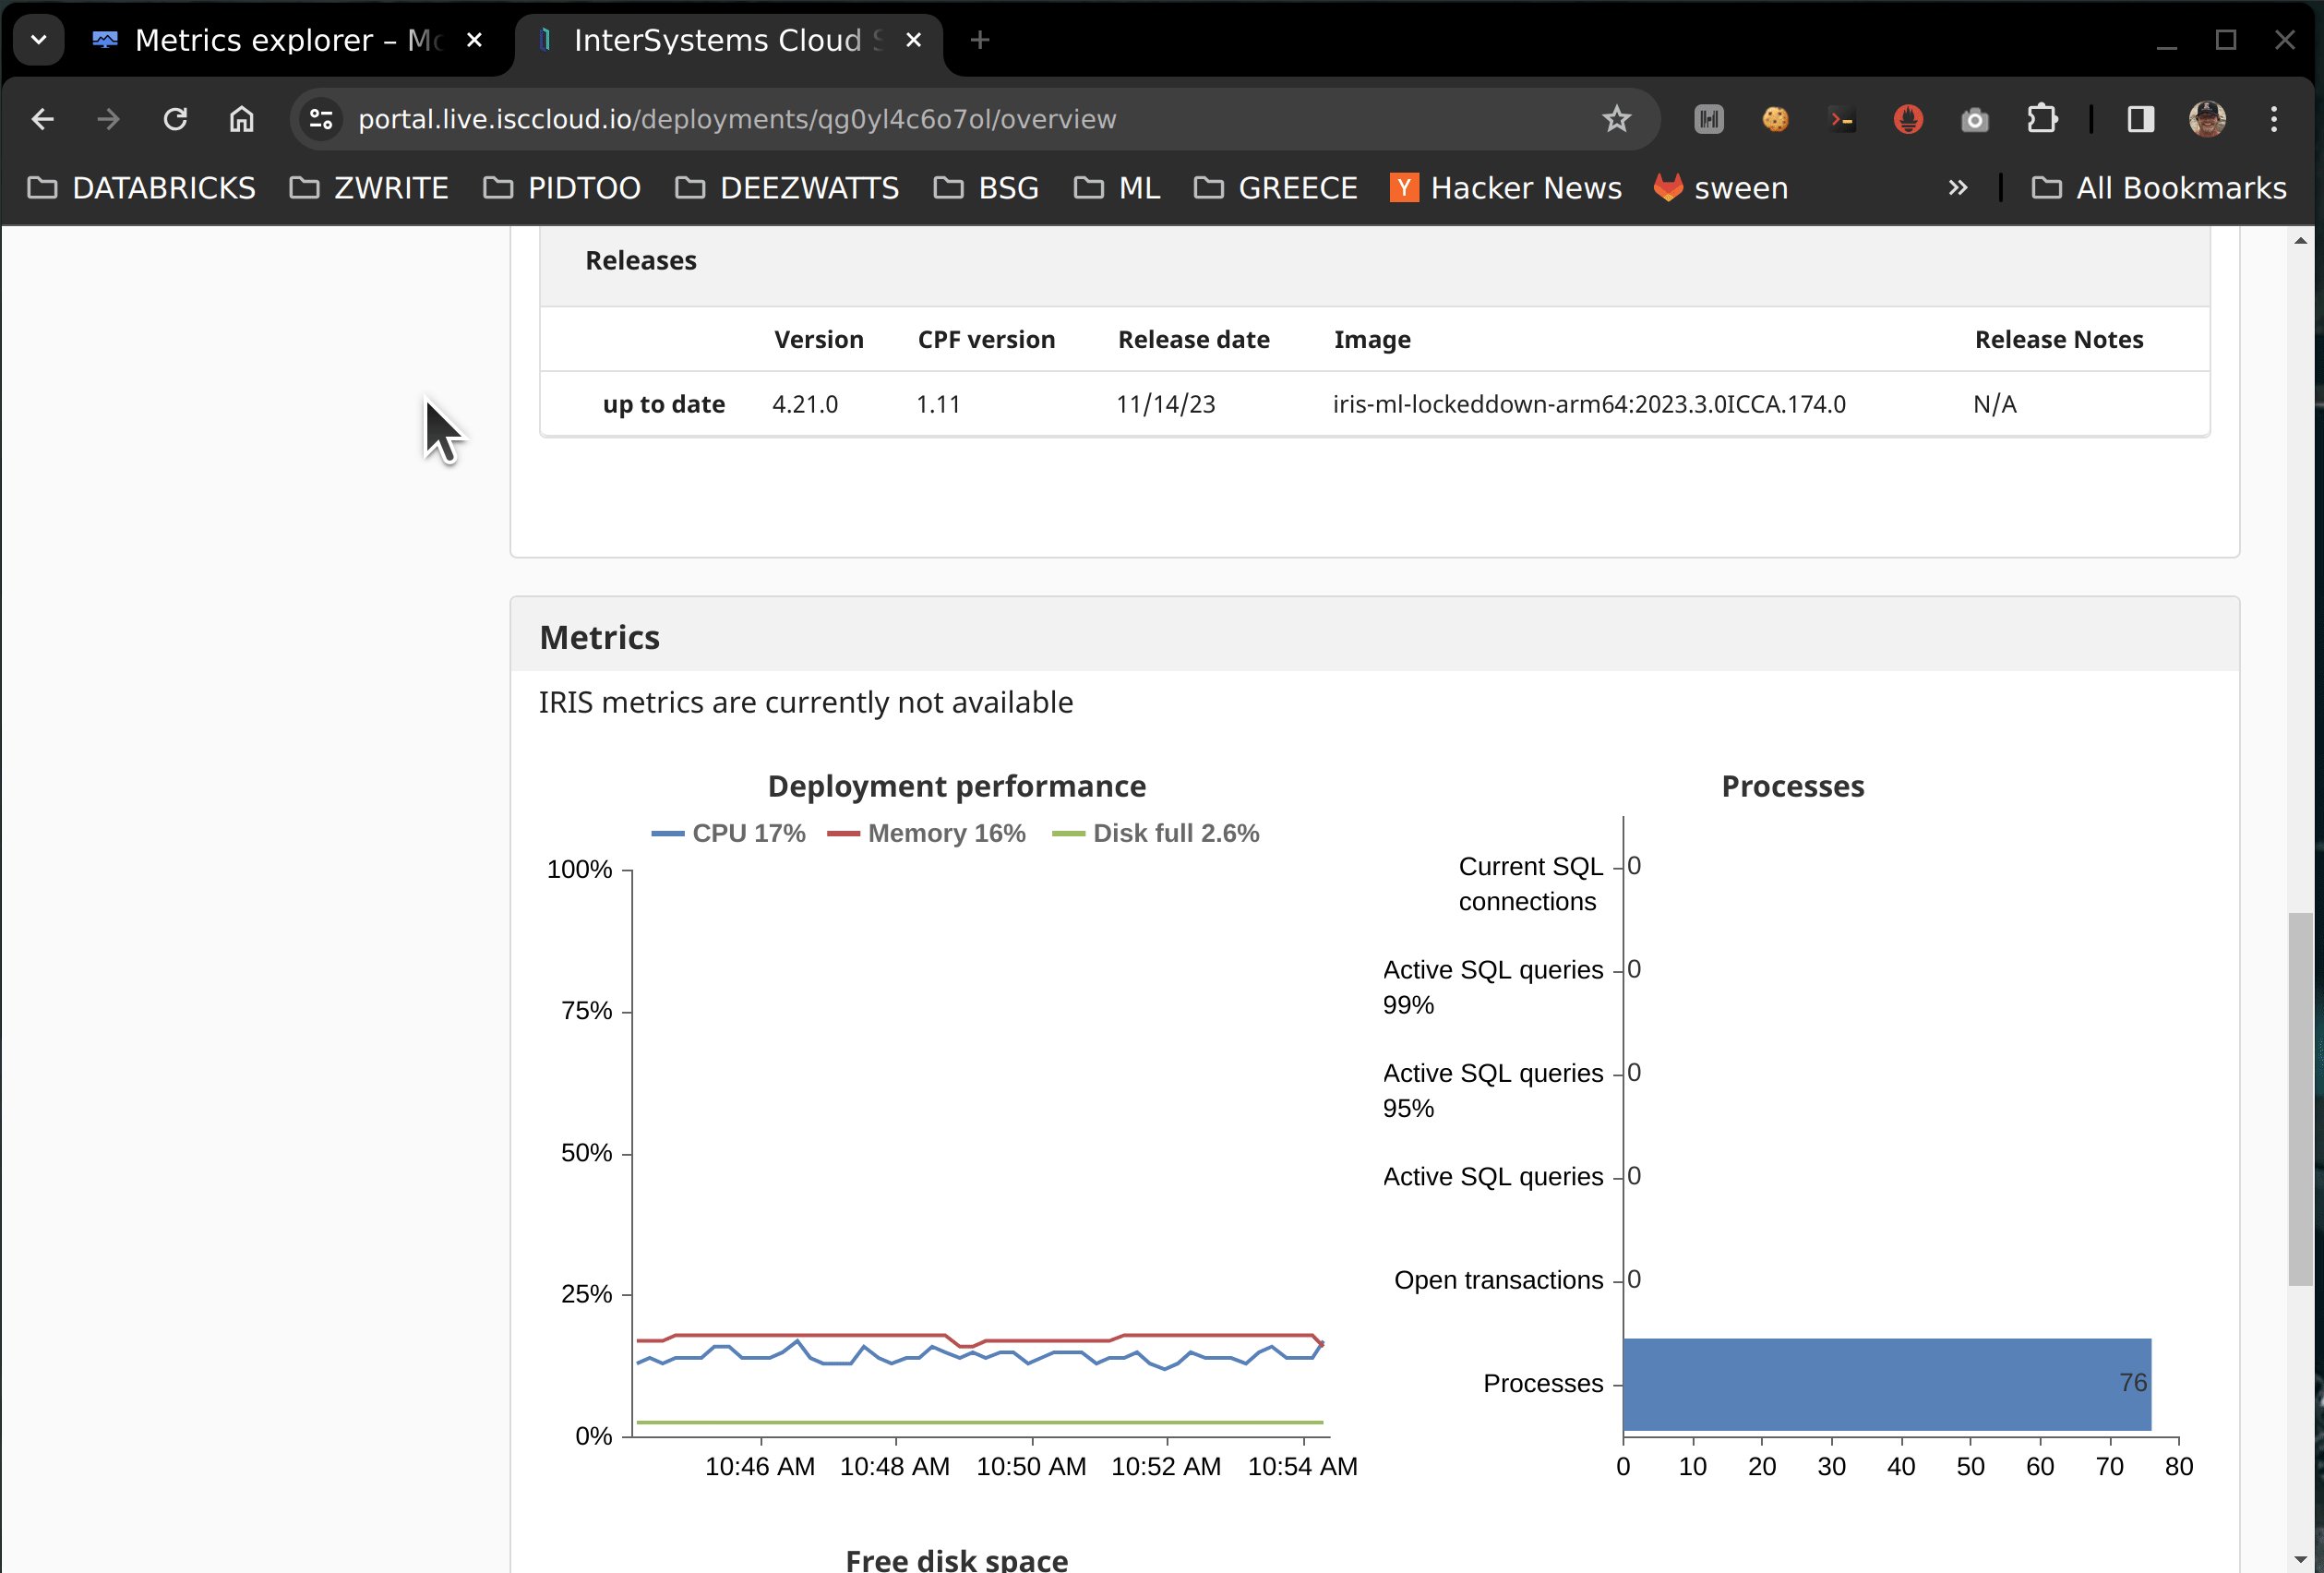
The Cloud portal does contain a representation of some top level metrics for at-a-glance heads up metrics, which is powered by a metrics endpoint that is exposed to you, but without some inspection you would not know it was there.
🚩 This approach is most likely taking advantage of a "to be named feature", so with that being said, it is not future-proof and definitely not supported by InterSystems.
.png) |
.png) |
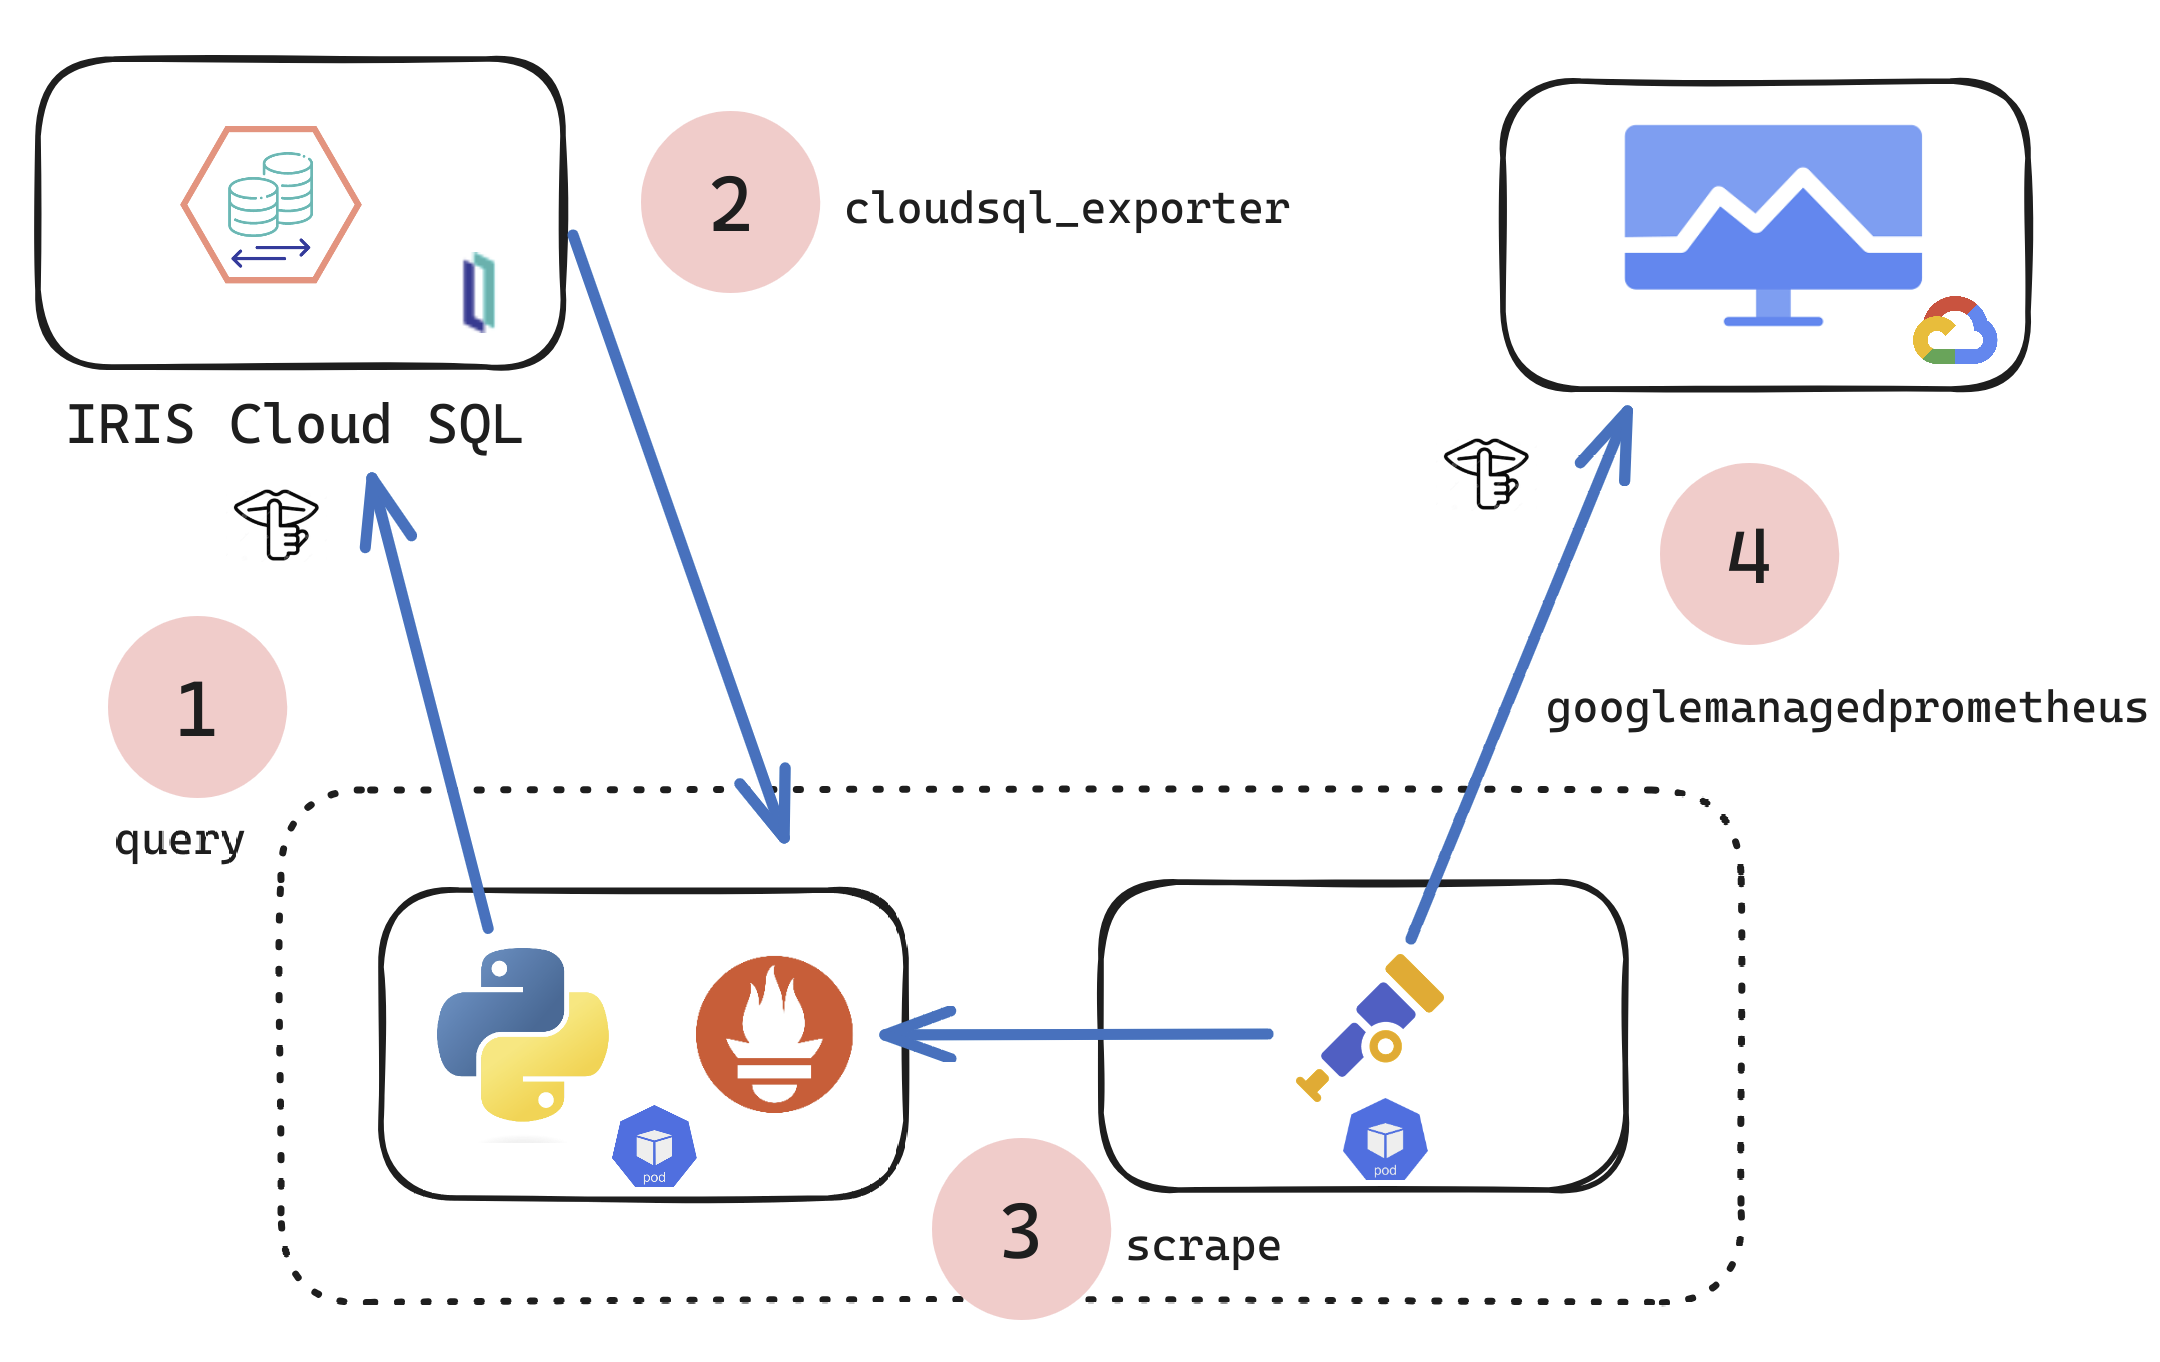
So what if you wanted a more comprehensive set exported? This technical article/example shows a technique to scrape and forward metrics to observability, it can be modified to suit your needs, to scrape ANY metrics target and send to ANY observability platform using the Open Telemetry Collector.
The mechanics leading up to the above result can be accomplished in many ways, but for here we are standing up a Kubernetes pod to run a python script in one container, and Otel in another to pull and push the metrics... definitely a choose your own adventure, but for this example and article k8s is the actor pulling this off with Python.
Steps:
- Prereqs
- Python
- Container
- Kubernetes
- Google Cloud Monitoring
Prerequisites:
- An active subscription to IRIS® Cloud SQL
- One Deployment, running, optionally with Integrated ML
- Secrets to supply to your environment
Environment Variables
Obtain Secrets
ENV IRIS_CLOUDSQL_USER 'user'
ENV IRIS_CLOUDSQL_PASS 'pass'
☝ These are your credentials for https://portal.live.isccloud.io
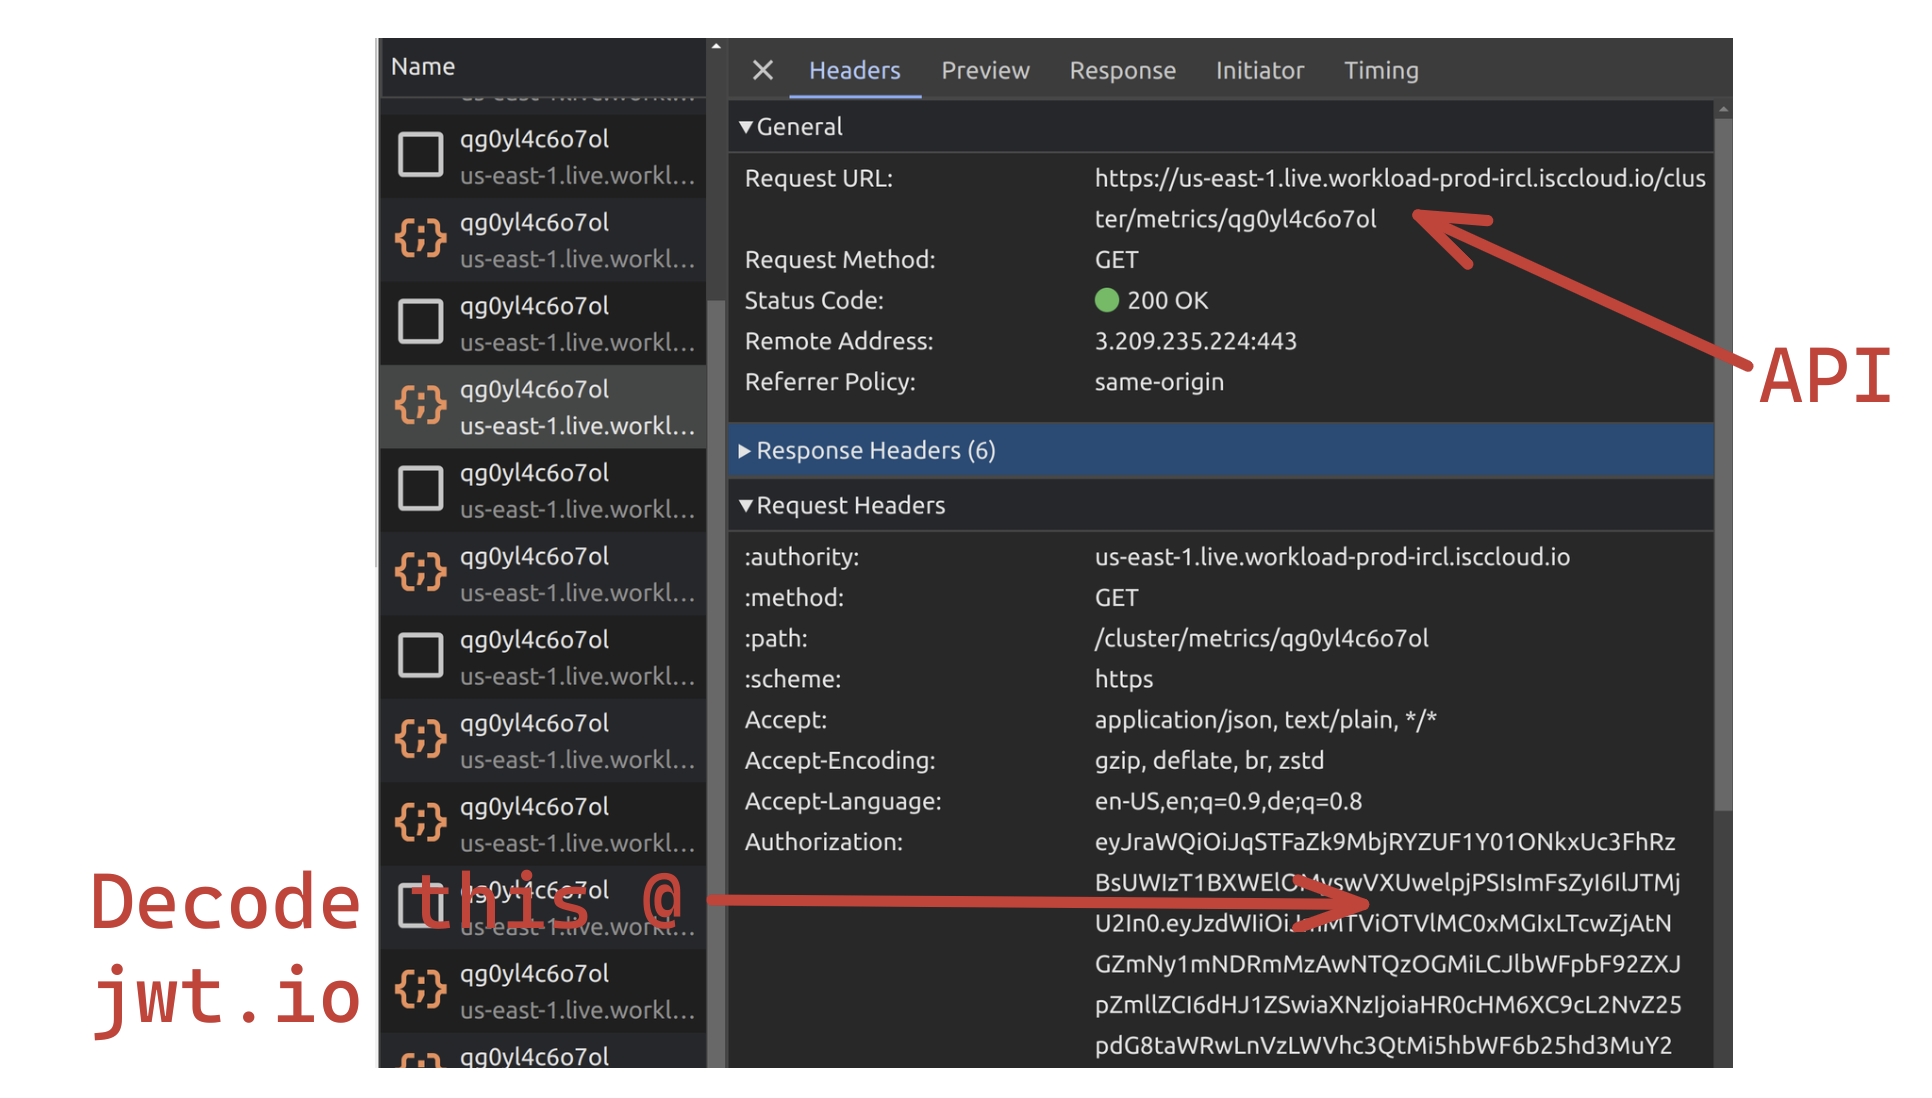
ENV IRIS_CLOUDSQL_USERPOOLID 'userpoolid'
ENV IRIS_CLOUDSQL_CLIENTID 'clientid'
ENV IRIS_CLOUDSQL_API 'api'
☝ These you have to dig out of development tools for your browser.
- `aud` = clientid
- `userpoolid`= iss
- `api` = request utl
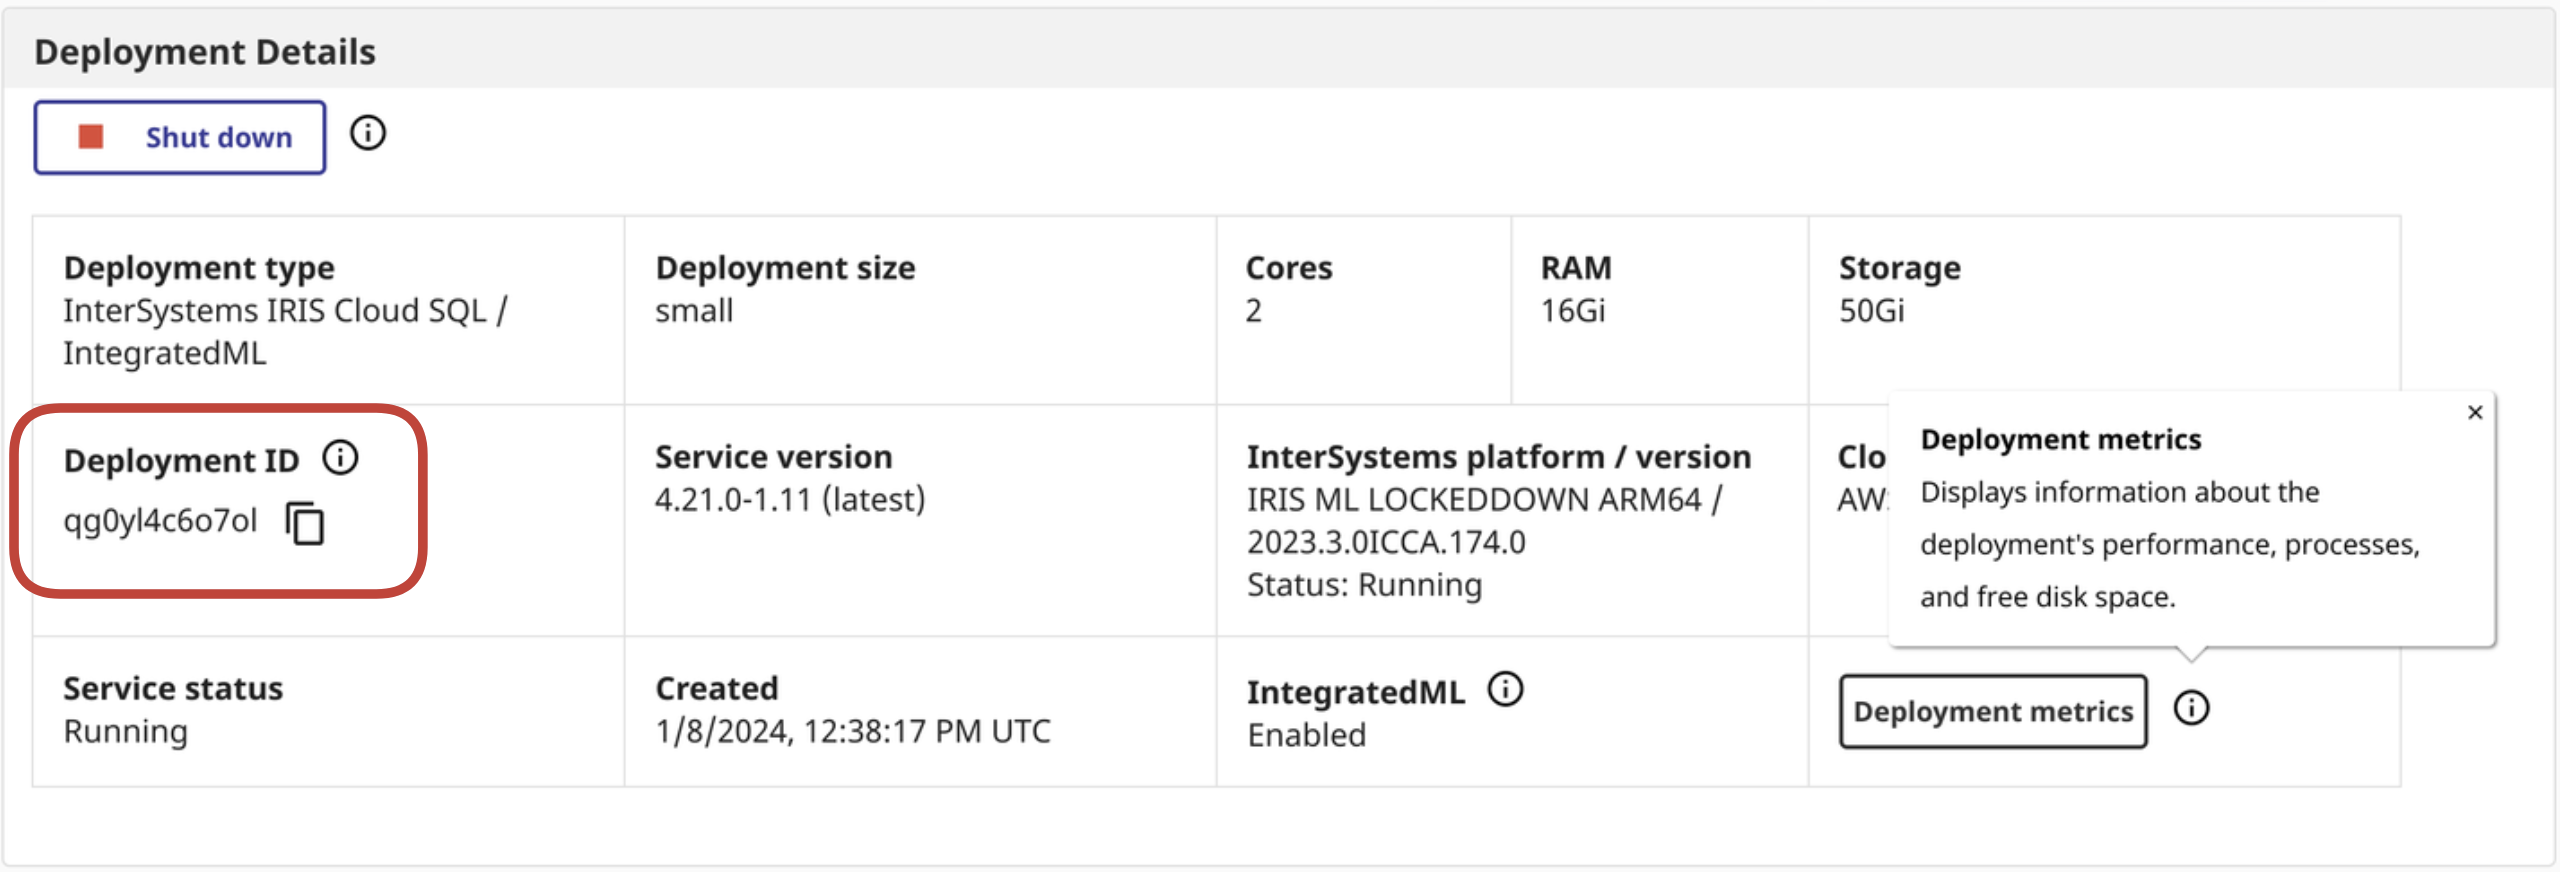
ENV IRIS_CLOUDSQL_DEPLOYMENTID 'deploymentid'
☝ This can be derived from the Cloud Service Portal
Python:
Here is the python hackery to pull the metrics from the Cloud Portal and export them locally as metrics for the otel collector to scrape:
iris_cloudsql_exporter.py
import time
import os
import requests
import json

from warrant import Cognito
from prometheus_client.core import GaugeMetricFamily, REGISTRY, CounterMetricFamily
from prometheus_client import start_http_server
from prometheus_client.parser import text_string_to_metric_families

class IRISCloudSQLExporter(object):
    def __init__(self):
        self.access_token = self.get_access_token()
        self.portal_api = os.environ['IRIS_CLOUDSQL_API']
        self.portal_deploymentid = os.environ['IRIS_CLOUDSQL_DEPLOYMENTID']

    def collect(self):
        # Requests fodder
        url = self.portal_api
        deploymentid = self.portal_deploymentid
        print(url)
        print(deploymentid)

        headers = {
            'Authorization': self.access_token, # needs to be refresh_token, eventually
            'Content-Type': 'application/json'
        }

        metrics_response = requests.request("GET", url + '/metrics/' + deploymentid, headers=headers)
        metrics = metrics_response.content.decode("utf-8")

        for iris_metrics in text_string_to_metric_families(metrics):
            for sample in iris_metrics.samples:

                labels_string = "{1}".format(*sample).replace('\'',"\"")
                labels_dict = json.loads(labels_string)
                labels = []

                for d in labels_dict:
                    labels.extend(labels_dict)
                if len(labels) > 0:
                    g = GaugeMetricFamily("{0}".format(*sample), 'Help text', labels=labels)
                    g.add_metric(list(labels_dict.values()), "{2}".format(*sample))
                else:
                    g = GaugeMetricFamily("{0}".format(*sample), 'Help text', labels=labels)
                    g.add_metric([""], "{2}".format(*sample))
                yield g

    def get_access_token(self):
        try:
            user_pool_id = os.environ['IRIS_CLOUDSQL_USERPOOLID'] # isc iss
            username = os.environ['IRIS_CLOUDSQL_USER']
            password = os.environ['IRIS_CLOUDSQL_PASS']
            clientid = os.environ['IRIS_CLOUDSQL_CLIENTID'] # isc aud
            print(user_pool_id)
            print(username)
            print(password)
            print(clientid)

            try:
                u = Cognito(
                    user_pool_id=user_pool_id,
                    client_id=clientid,
                    user_pool_region="us-east-2", # needed by warrant, should be derived from poolid doh
                    username=username
                )
                u.authenticate(password=password)
            except Exception as p:
                print(p)
        except Exception as e:
            print(e)

        return u.id_token

if __name__ == '__main__':

    start_http_server(8000)
    REGISTRY.register(IRISCloudSQLExporter())
    while True:
        REGISTRY.collect()
        print("Polling IRIS CloudSQL API for metrics data....")
        #looped e loop
        time.sleep(120)
Docker:
Dockerfile
FROM python:3.8
ADD src /src

RUN pip install prometheus_client
RUN pip install requests

WORKDIR /src

ENV PYTHONPATH '/src/'
ENV PYTHONUNBUFFERED=1
ENV IRIS_CLOUDSQL_USERPOOLID 'userpoolid'
ENV IRIS_CLOUDSQL_CLIENTID 'clientid'
ENV IRIS_CLOUDSQL_USER 'user'
ENV IRIS_CLOUDSQL_PASS 'pass'
ENV IRIS_CLOUDSQL_API 'api'
ENV IRIS_CLOUDSQL_DEPLOYMENTID 'deploymentid'
RUN pip install -r requirements.txt

CMD ["python" , "/src/iris_cloudsql_exporter.py"]
docker build -t iris-cloudsql-exporter . docker image tag iris-cloudsql-exporter sween/iris-cloudsql-exporter:latest docker push sween/iris-cloudsql-exporter:latest
Deployment:
k8s; Create us a namespace:
kubectl create ns iris
k8s; Add the secret:
kubectl create secret generic iris-cloudsql -n iris \
    --from-literal=user=$IRIS_CLOUDSQL_USER \
    --from-literal=pass=$IRIS_CLOUDSQL_PASS \
    --from-literal=clientid=$IRIS_CLOUDSQL_CLIENTID \
    --from-literal=api=$IRIS_CLOUDSQL_API \
    --from-literal=deploymentid=$IRIS_CLOUDSQL_DEPLOYMENTID \
    --from-literal=userpoolid=$IRIS_CLOUDSQL_USERPOOLID
otel, Create Config:
apiVersion: v1
data:
  config.yaml: |
    receivers:
      prometheus:
        config:
          scrape_configs:
          - job_name: 'IRIS CloudSQL'
              # Override the global default and scrape targets from this job every 5 seconds.
            scrape_interval: 30s
            scrape_timeout: 30s
            static_configs:
                    - targets: ['192.168.1.96:5000']
            metrics_path: /

    exporters:
      googlemanagedprometheus:
        project: "pidtoo-fhir"
    service:
      pipelines:
        metrics:
          receivers: [prometheus]
          exporters: [googlemanagedprometheus]
kind: ConfigMap
metadata:
  name: otel-config
  namespace: iris
k8s; Load the otel config as a configmap:
kubectl -n iris create configmap otel-config --from-file config.yaml
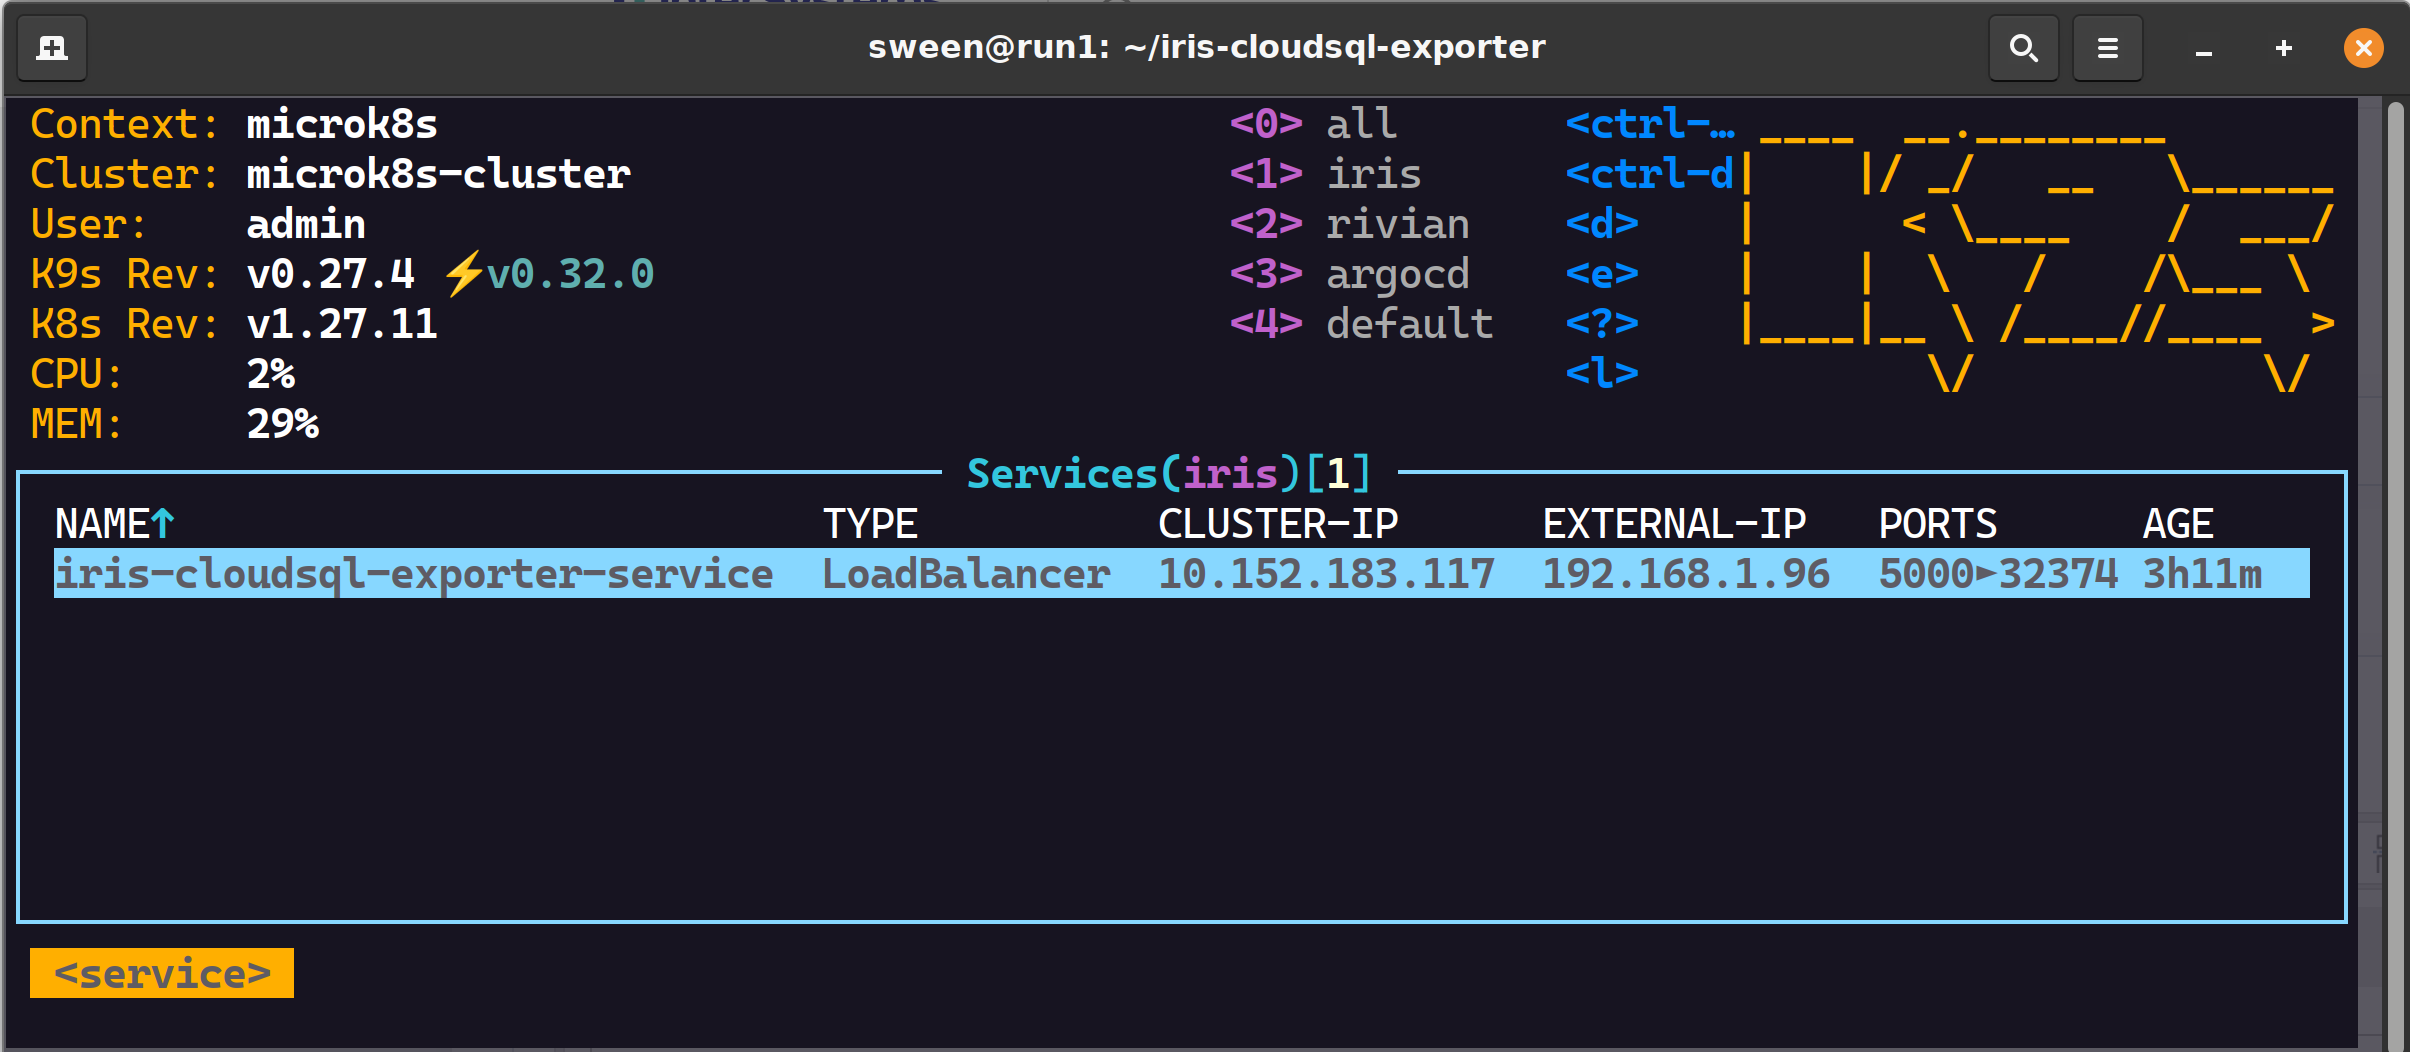
k8s; deploy load balancer (definitely optional), MetalLB. I do this to scrape and inspect from outside of the cluster.
cat <<EOF | kubectl apply -f -n iris -
apiVersion: v1
kind: Service
metadata:
  name: iris-cloudsql-exporter-service
spec:
  selector:
    app: iris-cloudsql-exporter
  type: LoadBalancer
  ports:
  - protocol: TCP
    port: 5000
    targetPort: 8000
EOF
gcp; need the keys to google cloud, the service account needs to be scoped
roles/monitoring.metricWriter
kubectl -n iris create secret generic gmp-test-sa --from-file=key.json=key.json
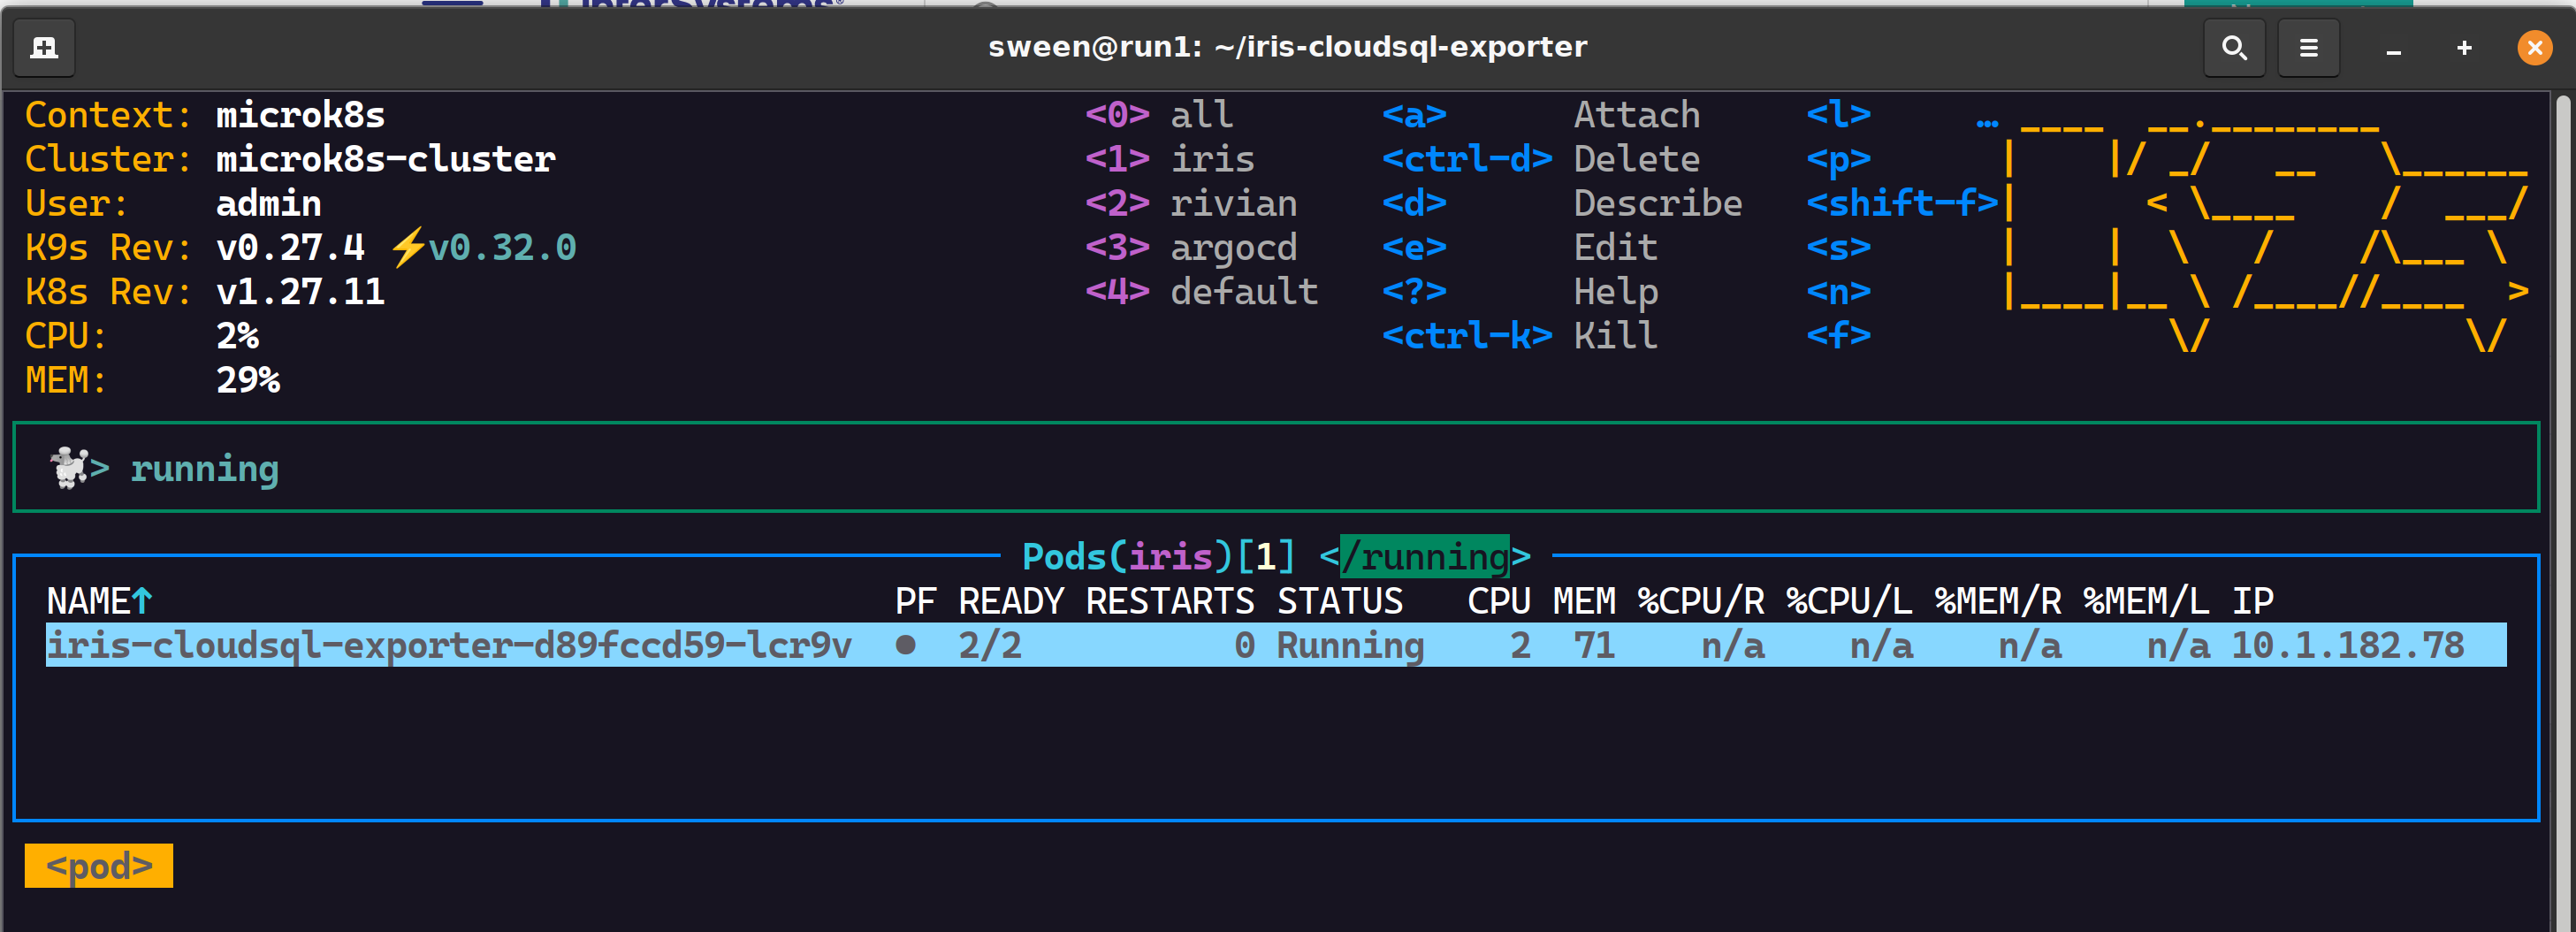
k8s; the deployment/pod itself, two containers:
deployment.yaml
kubectl -n iris apply -f deployment.yaml
Running
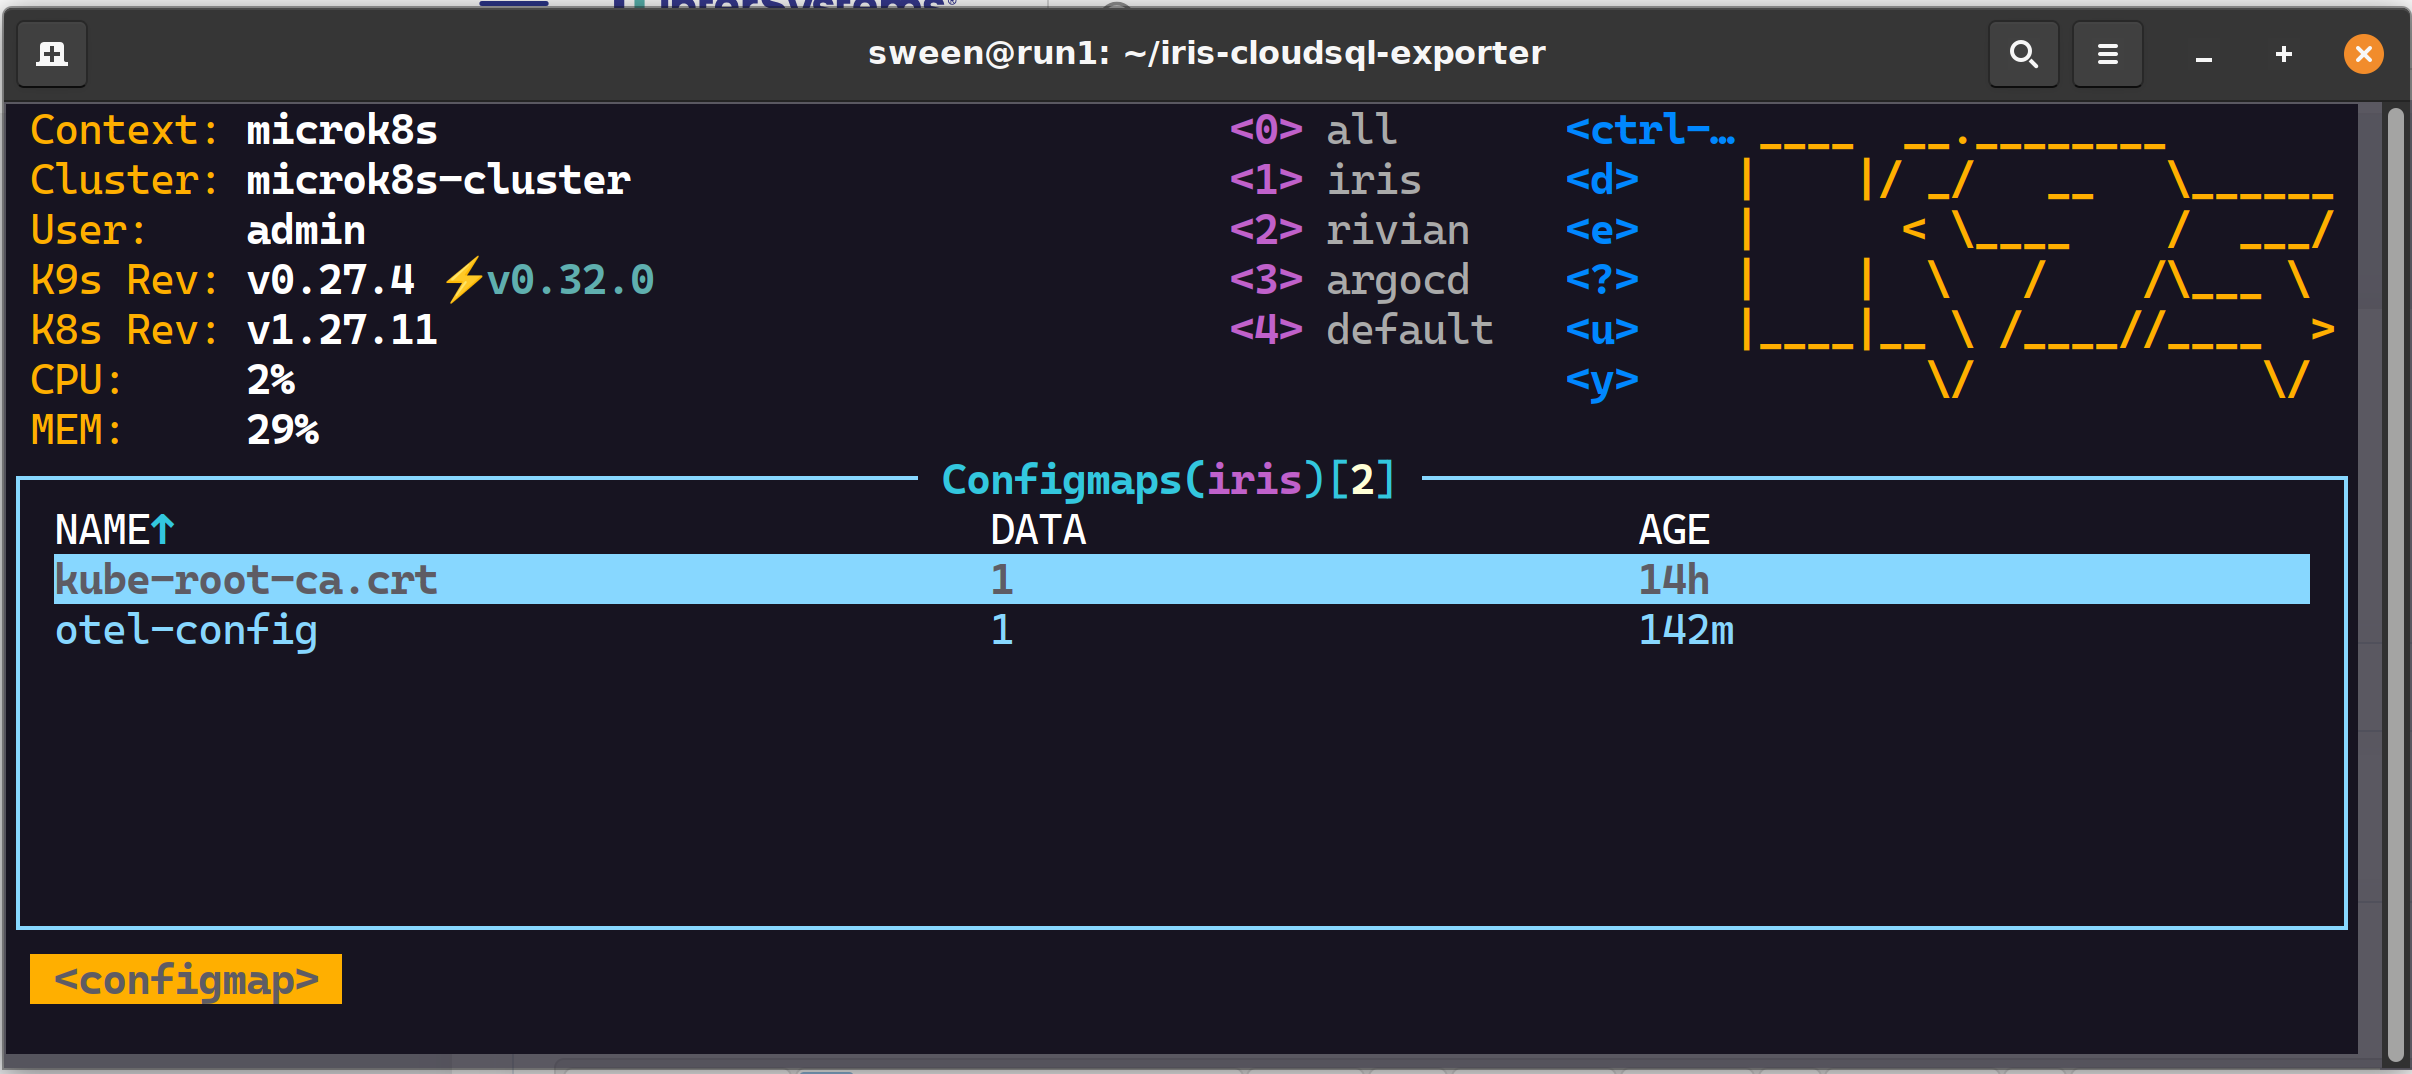
Assuming nothing is amiss, lets peruse the namespace and see how we are doing.
✔ 2 config maps, one for GCP, one for otel
✔ 1 load balancer
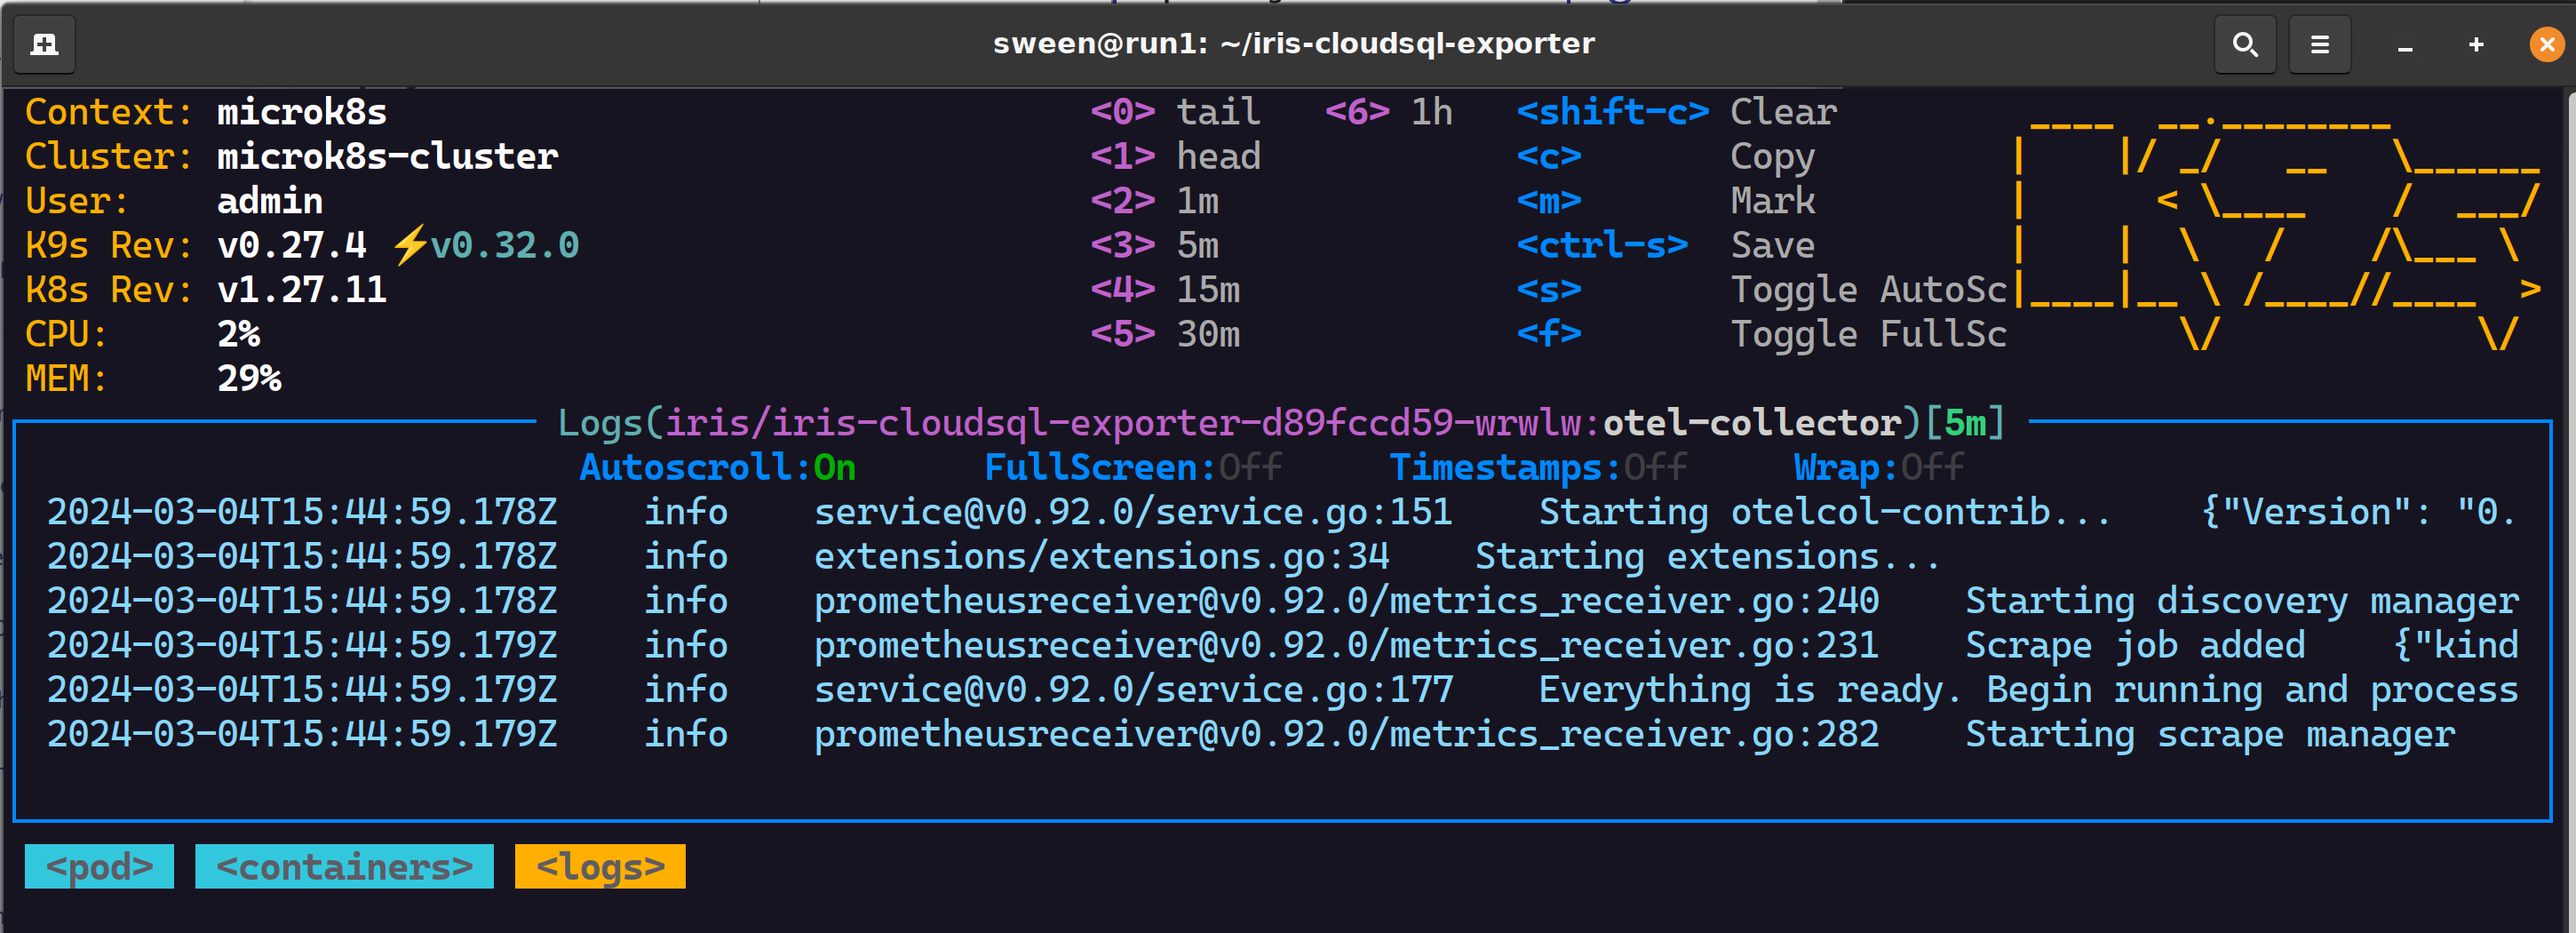
✔ 1 pod, 2 containers successful scrapes
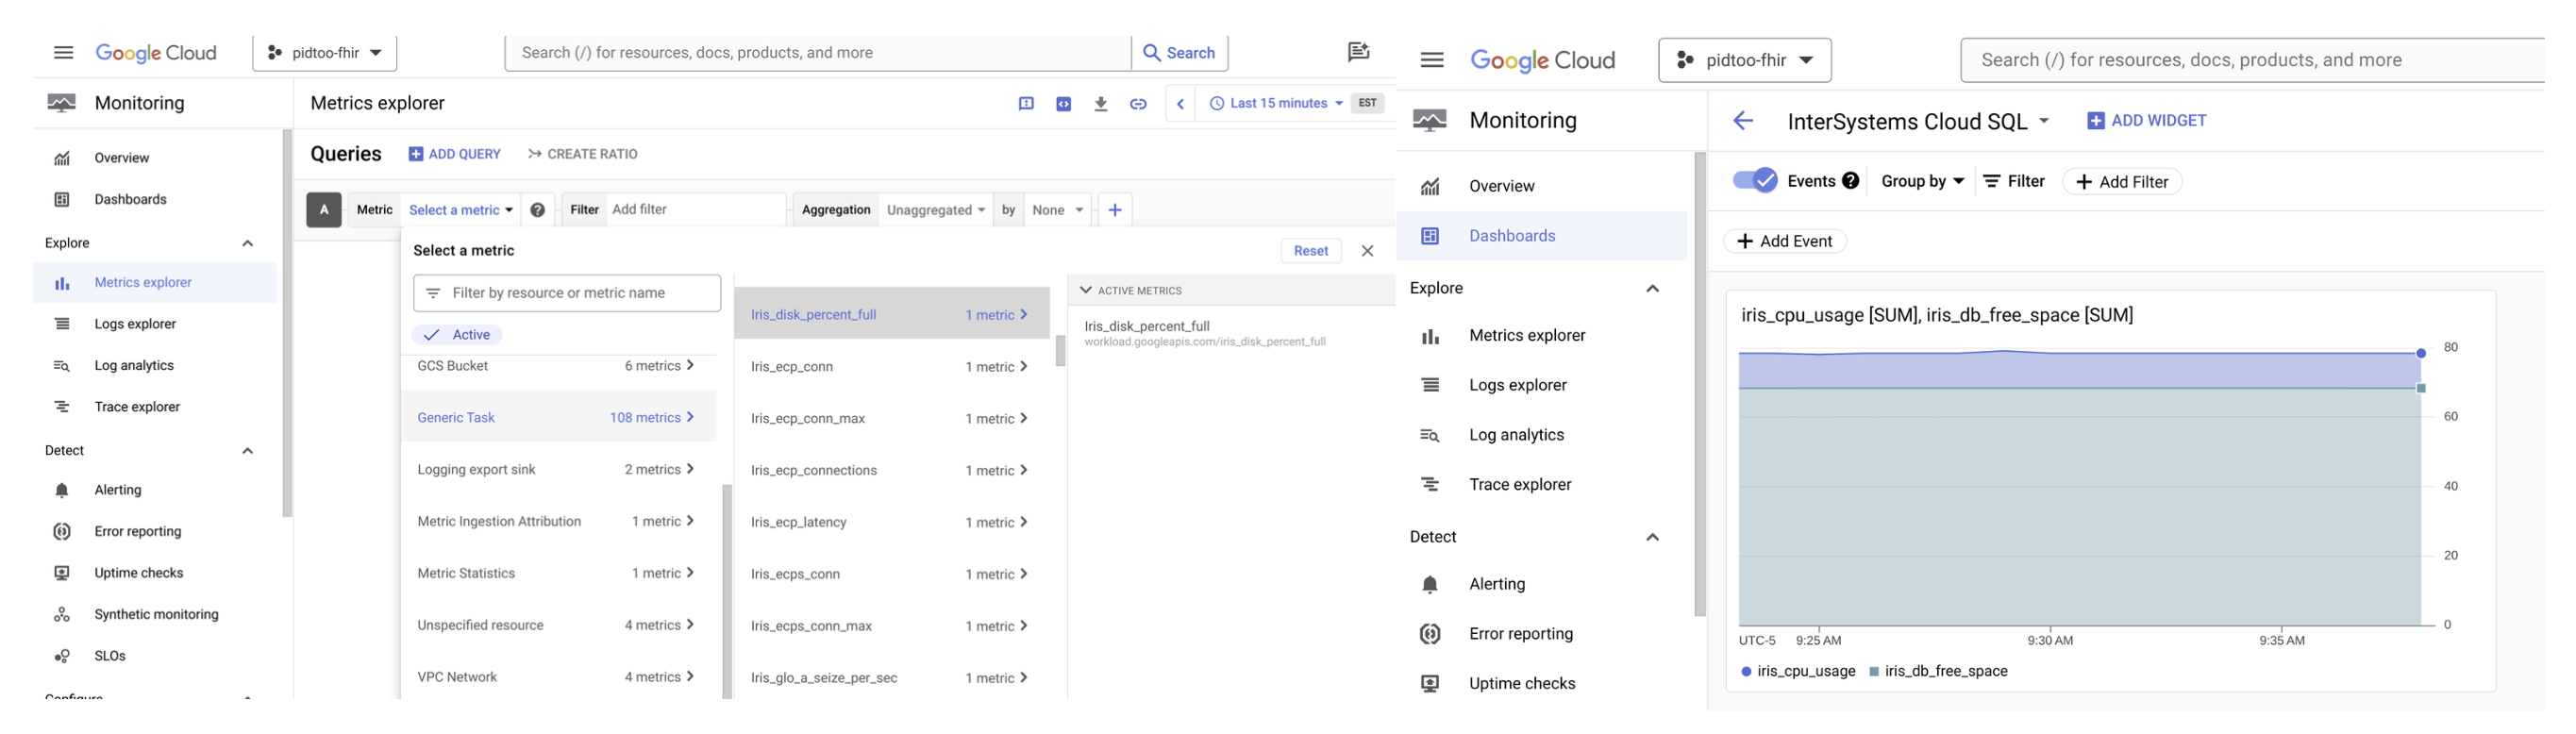
Google Cloud Monitoring
Inspect observability to see if the metrics are arriving ok and be awesome in observability!
Comments
💡 This article is considered InterSystems Data Platform Best Practice.