Display Management Portal Dashboard by using Python Flask web and Bootstrap Frameworks with the help of embedded python
Hi Community,
In this article I will explain how to display management portal dashboard by using Python Flask web and Boostrap framework with the help of embedded python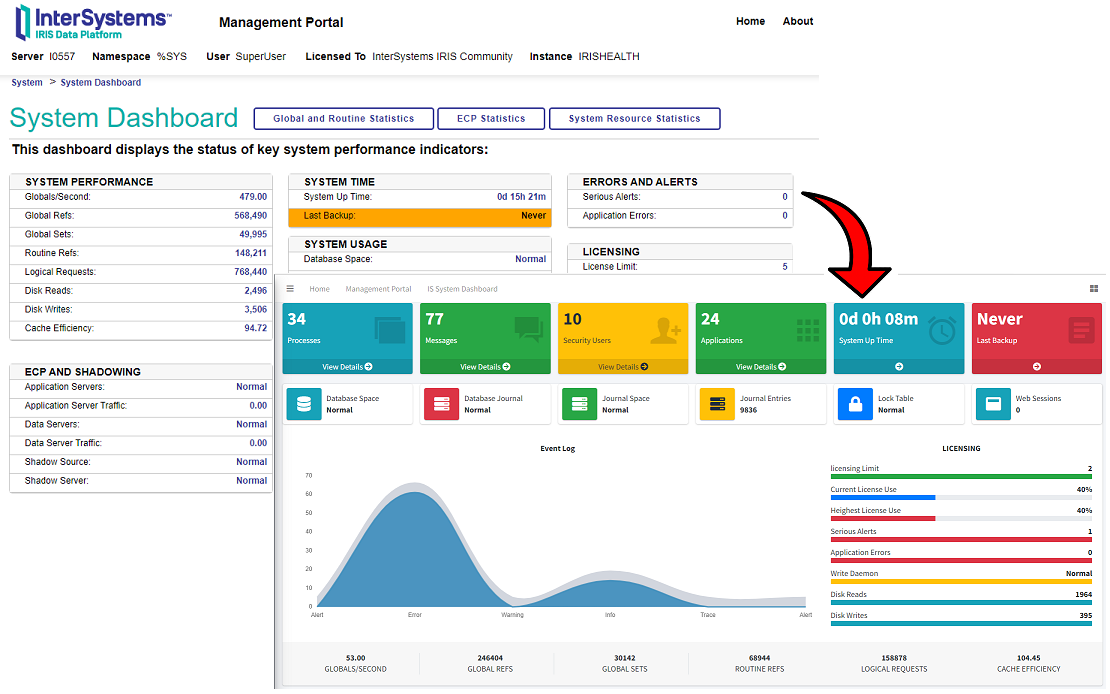
Accessing management portal system dashboard
Below are the steps to access system dashboard information:
- Step1 : Change Namespace to %SYS
- Step2 : Import iris python module and instantiate "SYS.Stats.Dashboard" class
- Step3 : Access instantiated class properties
So Let's start
Step1 : Change Namespace to %SYS
In order to get system dashboard information we need to access "SYS.Stats.Dashboard" class from %SYS namespace.
If not in the %SYS namespace then we have to change namespace.
Create Embedded.Utils class to get or set namespace:
///This class will be used to get or set Namespace
Class Embedded.Utils
{
//Get Namespace
ClassMethod GetNameSpace() As %Status
{

    Return $namespace
}
//Set Namespace
ClassMethod SetNameSpace(pNameSpace) As %Status
{
    zn pNameSpace
    Return $namespace
}

}
From the Python code write below script to change the namespace
#Import iris liabrary
import iris

#Set Namespoace to %SYS if current namespace is not %SYS
if iris.cls("Embedded.Utils").GetNameSpace() !=  "%SYS":
        iris.cls("Embedded.Utils").SetNameSpace("%SYS")
Step2 : Import iris python module and instantiate class
Now we can access properties of "SYS.Stats.Dashboard" by calling class method 'Sample':
#Import iris liabrary
import iris

#Set Namespoace to %SYS if current namespace is not %SYS
if iris.cls("Embedded.Utils").GetNameSpace() !=  "%SYS":
        iris.cls("Embedded.Utils").SetNameSpace("%SYS")
#A class may be instantiated by calling the class method 'Sample', and then the current value of each property can be accessed.
ref = iris.cls("SYS.Stats.Dashboard").Sample()Step3 : Access instantiated class properties
This class contains below properties which can be accessed by using below code:.png)
We will get below information by using SYS.Stats.Dashboard class:
ApplicationErrors: Number of application errors that have been logged
CSPSessions: Most recent number of CSP sessions
CacheEfficiency: Most recently measured cache efficiency (Global references / (physical reads + writes))
DatabaseSpace: Indicates whether there is a reasonable amount of diskspace available for database files. Possible values are "Normal", "Warning" (<5MB) or "Troubled" (<2MB)
DiskReads: Number of physical block read operations since system startup
DiskWrites: Number of physical block write operations since system startup
ECPAppServer: Summary status of ECP application servers connected to this system
ECPAppSrvRate: Most recently measured ECP application server traffic in bytes/second
ECPDataServer: Summary status of ECP data servers this system is connected to
ECPDataSrvRate: Most recently measured ECP data server traffic in bytes/second
GloRefs: Number of Global references since system startup
GloRefsPerSec: Most recently measured number of Global references per second
GloSets: Number of Global Sets and Kills since system startup
JournalEntries: Number of entries written to the system journal since system startup
JournalSpace: Indicates whether there is a reasonable amount of diskspace available for journal files. Possible values are "Normal", "Warning" (<250MB) or "Troubled" (<50MB)
JournalStatus: Indicates the current status of the database journaling. Possible values are "Normal", "Disabled", "Suspended", "Frozen", "Paused", "Unknown".
LastBackup: Date and time of last system backup
LicenseCurrent: Current count of license units being used
LicenseCurrentPct: License usage as a percentage of available license units
LicenseHigh: Highest count of license units used
LicenseHighPct: Highest license usage as a percentage of available license units
LicenseLimit: Maximum allowed license units for this system
LicenseType: Text description of license type for this system
LockTable: Indicates the current status of the system Lock Table based on percentage used. Possible values are "Normal", "Warning" (>85%) or "Troubled" (>95%)
LogicalReads: Number of logical block requests since system startup
Processes: Most recent number of running processes
RouRefs: Number of routine loads and saves since system startup
SeriousAlerts: Number of serious alerts that have been raised
ShadowServer: Summary status of shadows configured on this shadow server. Values from SYS.Shadowing class queries
ShadowSource: Summary status of shadow connections on this data source. Values from SYS.Shadowing class queries
SystemUpTime: Elapsed time since this system was started
WriteDaemon: Indicates the current status of the system Write Daemon. Possible values are "Normal" or "Troubled" (based on lack of movement in queue)
Below is the code to get Application errors and CSP Session data:
#Import iris liabrary
import iris
#Set Namespoace to %SYS if current namespace is not %SYS
if iris.cls("Embedded.Utils").GetNameSpace() != "%SYS":
iris.cls("Embedded.Utils").SetNameSpace("%SYS")
#A class may be instantiated by calling the class method 'Sample', and then the current value of each property can be accessed.
ref = iris.cls("SYS.Stats.Dashboard").Sample()
#display ApplicationErrors
print(ref.ApplicationErrors)
#display CSP Sessions
print(ref.CSPSessions)For more details please check openexchange iris-python-apps application

Display cache table data on the web page with the help of jquery datatable
Below are the steps to display Security.Users table on web page
- Step1 : Change Namespace to %SYS
- Step2 : Import iris python module and use iris.sql.exec() function to run an SQL SELECT statement to get resultset
- Step3 : Get dataframe by calling resultset dataframe function
- Step4 : Get header and columns JSON data from dataframe and pass to the web
- Step5 : Display data to jquery datatable
So Let's start
Step1 : Change Namespace to %SYS
Same above Embedded.Utils class can be used to get or set Namespace
#Import iris liabrary
import iris
#Set Namespoace to %SYS if current namespace is not %SYS
if iris.cls("Embedded.Utils").GetNameSpace() != "%SYS":
iris.cls("Embedded.Utils").SetNameSpace("%SYS")Step2 : Import iris python module and use iris.sql.exec() function to run an SQL SELECT statement to get resultset
After importing iris module we will use iris.sql.exec() to run an SQL SELECT statement and get resultset,
import iris

statement =  '''SELECT
ID, AccountNeverExpires, AutheEnabled, ChangePassword, CreateDateTime AS DateCreated, Enabled, ExpirationDate, Flags, Name
FROM Security.Users'''
#Calling embedded python iris.sql.exec class to get result set
resultSet = iris.sql.exec(mySql)
Step3 : Get dataframe by calling resultset dataframe function
 #Get dataframe by calling resultset dataframe function
 dataframe = statement.dataframe()
Step4 : Get header and columns JSON data from dataframe and pass to the web
 #Convert and data to Json by using to_json dataframe method and json loads function
 my_data=json.loads(dataframe.to_json(orient="split"))["data"]
 #Get columns details
 my_cols=[{"title": str(col)} for col in json.loads(df.to_json(orient="split"))["columns"]]
 #render html by passing my_data and my_cols variables which will be used to generate datatable
 return render_template('tablesdata.html',  my_data = my_data, my_cols = my_cols)
Step5 : Display data to jquery datatable
Define table with id "myTable" and use javascript to populate passed header and columns data
  <table id="myTable" class="table table-bordered table-striped">
   </table>
<script>
$(document).ready(function() {
// parse the data to local variable passed from app.py file
let my_data = JSON.parse('{{ my_data | tojson }}');
let my_cols = JSON.parse('{{ my_cols | tojson }}');
$('#myTable').DataTable( {
"data": my_data,
"columns": my_cols,"} );
} );
That's it. For more details please check openexchange iris-python-apps application
Read related documentations Embedded Python Overview.
Thanks
Comments
💡 This article is considered as InterSystems Data Platform Best Practice.