Analyzing IRIS ^PERFMON Runtime Performance Using the Java Native SDK
Technical Documentation — Quarkus IRIS Monitor System
1. Purpose and Scope
This module enables integration between Quarkus-based Java applications and InterSystems IRIS’s native performance monitoring capabilities.
It allows a developer to annotate methods with @PerfmonReport, which triggers IRIS’s ^PERFMON routines automatically around method execution, generating performance reports without manual intervention.
2. System Components
2.1 Annotation: @PerfmonReport
- Defined as a CDI InterceptorBinding.
- Can be applied to methods or classes.
- Directs the framework to wrap method execution with IRIS monitoring logic.
2.2 Interceptor: PerfmonReportInterceptor
-
Intercepts calls to annotated methods.
-
Execution flow:
- Log start event (
LOG.infof("INIT: …")) - Call
monitorSystem.startPerfmon() - Proceed with
context.proceed() - In a
finallyblock:- Call
monitorSystem.generateReportPerfmon(...) - Call
monitorSystem.stopPerfmon() - Log end event with execution time
- Call
- Log start event (
-
Ensures that monitoring is always ended, even if an exception is thrown.
2.3 DAO Bean: MonitorSystem
-
CDI bean annotated with
@ApplicationScoped. -
Holds a single instance of
IRISinitialized at startup. -
Configuration injected via
@ConfigProperty(JDBC URL, user, password). -
Uses
DriverManager.getConnection(...)to obtain a rawIRISConnection. -
Contains methods:
startPerfmon()generateReportPerfmon(String reportName)stopPerfmon()
-
Each calls the appropriate ObjectScript methods in
iris.src.dc.AdapterPerfmonProcviairis.classMethodVoid(...).
2.4 ObjectScript Adapter: iris.src.dc.AdapterPerfmonProc
-
Defines the routines that encapsulate
^PERFMONlogic:Class iris.src.dc.AdapterPerfmonProc Extends %RegisteredObject { ClassMethod start() As %Status { Set namespace = $NAMESPACE zn "%SYS" set status = $$Stop^PERFMON() set status = $$Start^PERFMON() zn namespace return status } ClassMethod generateReport(nameReport As %String = "report.txt") As %Status { Set namespace = $NAMESPACE zn "%SYS" Set tempDirectory = ##class(%SYS.System).TempDirectory() set status = $$Report^PERFMON("R","R","P", tempDirectory_"/"_nameReport) zn namespace return status } ClassMethod stop() As %Status { Set namespace = $NAMESPACE zn "%SYS" Set status = $$Stop^PERFMON() zn namespace return status } } -
Operates in namespace
%SYSto access^PERFMONroutines, then returns to the original namespace.
3. Execution Flow
-
A request enters the Quarkus application.
-
The CDI interceptor detects the
@PerfmonReportannotation and intercepts the method call. -
monitorSystem.startPerfmon()is invoked, triggering IRIS^PERFMONmonitoring. -
The business method executes normally (data access, transformations, logic, etc.).
-
After the method returns or throws an exception, the interceptor ensures:
monitorSystem.generateReportPerfmon(...)is called to create a.txtperformance report.monitorSystem.stopPerfmon()is executed to stop the monitoring session.- The total Java-side execution time is logged using
Logger.infof(...).
-
The generated report file is stored in the IRIS temporary directory, typically:
/usr/irissys/mgr/Temp/- The file name follows the pattern:
.txt
- The file name follows the pattern:
4. Technical Challenges and Solutions
| Challenge | Solution |
|---|---|
ClassCastException when using pooled JDBC connections |
Use DriverManager.getConnection(...) to obtain a native IRISConnection instead of the pooled ConnectionWrapper. |
| Overhead from repeatedly opening connections | Maintain a single IRIS instance within an @ApplicationScoped bean, initialized via @PostConstruct. |
Ensuring ^PERFMON is always stopped even on exceptions |
Use try-finally in the interceptor to call stopPerfmon() and generateReportPerfmon(). |
| Configuration portability | Inject connection settings (jdbc.url, username, password) using @ConfigProperty and application.properties. |
| Managing concurrent monitor sessions | Avoid annotating highly concurrent endpoints. Future versions may implement session-level isolation. |
5. Use Cases and Benefits
- Enables real-time visibility into IRIS runtime activity from Java code.
- Simplifies performance analysis and query optimization for developers.
- Useful for benchmarking, profiling, and system regression testing.
- Can serve as a lightweight performance audit trail for critical operations.
6. Practical Example of Use
The complete source code and deployment setup are available at:
- Open Exchange: https://openexchange.intersystems.com/package/quarkus-iris-monitor-system
- GitHub Repository: https://github.com/Davi-Massaru/quarkus-iris-monitor-system
6.1 Overview
The application runs a Quarkus server connected to an InterSystems IRIS instance configured with the FHIRSERVER namespace.
The ORM layer is implemented using Hibernate ORM with PanacheRepository, allowing direct mapping between Java entities and IRIS database classes.
When the application starts (via docker-compose up), it brings up:
- The IRIS container, hosting the FHIR data model and ObjectScript routines (including
AdapterPerfmonProc); - The Quarkus container, exposing REST endpoints and connecting to IRIS via the native JDBC driver.
6.2 REST Endpoint
A REST resource exposes a simple endpoint to retrieve patient information:
@Path("/patient")
public class PatientResource {

    @Inject
    PatientService patientService;

    @GET
    @Path("/info")
    @Produces(MediaType.APPLICATION_JSON)
    public PatientInfoDTO searchPatientInfo(@QueryParam("key") String key) {
        return patientService.patientGetInfo(key);
    }
}
This endpoint accepts a query parameter (key) that identifies the patient resource within the FHIR data repository.
### 6.3 Service Layer with @PerfmonReport
The PatientService class contains the business logic to retrieve and compose patient information. It is annotated with @PerfmonReport, which means each request to /patient/info triggers IRIS performance monitoring:
@ApplicationScoped
public class PatientService {

    @Inject
    PatientRepository patientRepository;

    @PerfmonReport
    public PatientInfoDTO patientGetInfo(String patientKey) {

        Optional<Patient> patientOpt = patientRepository.find("key", patientKey).firstResultOptional();
        Patient patient = patientOpt.orElseThrow(() -> new IllegalArgumentException("Patient not found"));

        PatientInfoDTO dto = new PatientInfoDTO();
        dto.setKey(patient.key);
        dto.setName(patient.name);
        dto.setAddress(patient.address);
        dto.setBirthDate(patient.birthDate != null ? patient.birthDate.toString() : null);
        dto.setGender(patient.gender);
        dto.setMedications(patientRepository.findMedicationTextByPatient(patientKey));
        dto.setConditions(patientRepository.findConditionsByPatient(patientKey));
        dto.setAllergies(patientRepository.findAllergyByPatient(patientKey));

        return dto;
    }
}
6.4 Execution Flow
A request is made to: GET /patient/info?key=Patient/4
Quarkus routes the request to PatientResource.searchPatientInfo().
The CDI interceptor detects the @PerfmonReport annotation in PatientService.patientGetInfo().
Before executing the service logic:
-
The interceptor invokes
MonitorSystem.startPerfmon(), which calls the IRIS class iris.src.dc.AdapterPerfmonProc.start(). -
The method executes business logic, querying patient data using Hibernate
PanacheRepositorymappings.
After the method completes:
-
MonitorSystem.generateReportPerfmon()is called to create a performance report. -
MonitorSystem.stopPerfmon()stops the IRIS performance monitor.
A .txt report is generated under: usr/irissys/mgr/Temp/
Example filename: PatientService_patientGetInfo_20251005_161906.txt
6.5 Result
The generated report contains detailed IRIS runtime statistics, for example:
                         Routine Activity by Routine

Started: 10/11/2025 05:07:30PM                    Collected: 10/11/2025 05:07:31PM

Routine Name                        RtnLines  % Lines   RtnLoads  RtnFetch  Line/Load Directory
----------------------------------- --------- --------- --------- --------- --------- ---------
Other                                     0.0       0.0       0.0       0.0         0
PERFMON                                  44.0       0.0       0.0       0.0         0 /usr/irissys/mgr/
%occLibrary                         3415047.0      34.1   48278.0       0.0      70.7 /usr/irissys/mgr/irislib/
iris.src.dc.AdapterPerfmonProc.1          7.0       0.0       2.0       0.0       3.5 /usr/irissys/mgr/FHIRSERVER/
%occName                            5079994.0      50.7       0.0       0.0         0 /usr/irissys/mgr/irislib/
%apiDDL2                            1078497.0      10.8   63358.0       0.0      17.0 /usr/irissys/mgr/irislib/
%SQL.FeatureGetter.1                 446710.0       4.5   66939.0       0.0       6.7 /usr/irissys/mgr/irislib/
%SYS.WorkQueueMgr                       365.0       0.0       1.0       0.0     365.0 /usr/irissys/mgr/
%CSP.Daemon.1                            16.0       0.0       1.0       0.0      16.0 /usr/irissys/mgr/irislib/
%SYS.TokenAuth.1                         14.0       0.0       5.0       0.0       2.8 /usr/irissys/mgr/
%Library.PosixTime.1                      2.0       0.0       0.0       0.0         0 /usr/irissys/mgr/irislib/
%SYS.sqlcq.uEXTg3QR7a7I7Osf9e8Bz...      52.0       0.0       1.0       0.0      52.0 /usr/irissys/mgr/
%SYS.SQLSRV                              16.0       0.0       0.0       0.0         0 /usr/irissys/mgr/
%apiOBJ                                 756.0       0.0       0.0       0.0         0 /usr/irissys/mgr/irislib/
FT.Collector.1                            0.0       0.0       0.0       0.0         0 /usr/irissys/mgr/
SYS.Monitor.FeatureTrackerSensor.1        0.0       0.0       0.0       0.0         0 /usr/irissys/mgr/
%SYS.Monitor.Control.1                    0.0       0.0       0.0       0.0         0 /usr/irissys/mgr/
%SYS.DBSRV.1                            252.0       0.0       4.0       0.0      63.0 /usr/irissys/mgr/
%sqlcq.FHIRSERVER.cls12.1                19.0       0.0       0.0       0.0         0 /usr/irissys/mgr/irislocaldata/
%sqlcq.FHIRSERVER.cls13.1                74.0       0.0       0.0       0.0         0 /usr/irissys/mgr/irislocaldata/
%sqlcq.FHIRSERVER.cls14.1                74.0       0.0       0.0       0.0         0 /usr/irissys/mgr/irislocaldata/
%sqlcq.FHIRSERVER.cls15.1                52.0       0.0       0.0       0.0         0 /usr/irissys/mgr/irislocaldata/
%SYS.System.1                             1.0       0.0       0.0       0.0         0 /usr/irissys/mgr/
This data provides precise insight into what routines were executed internally by IRIS during that REST call — including SQL compilation, execution, and FHIR data access.
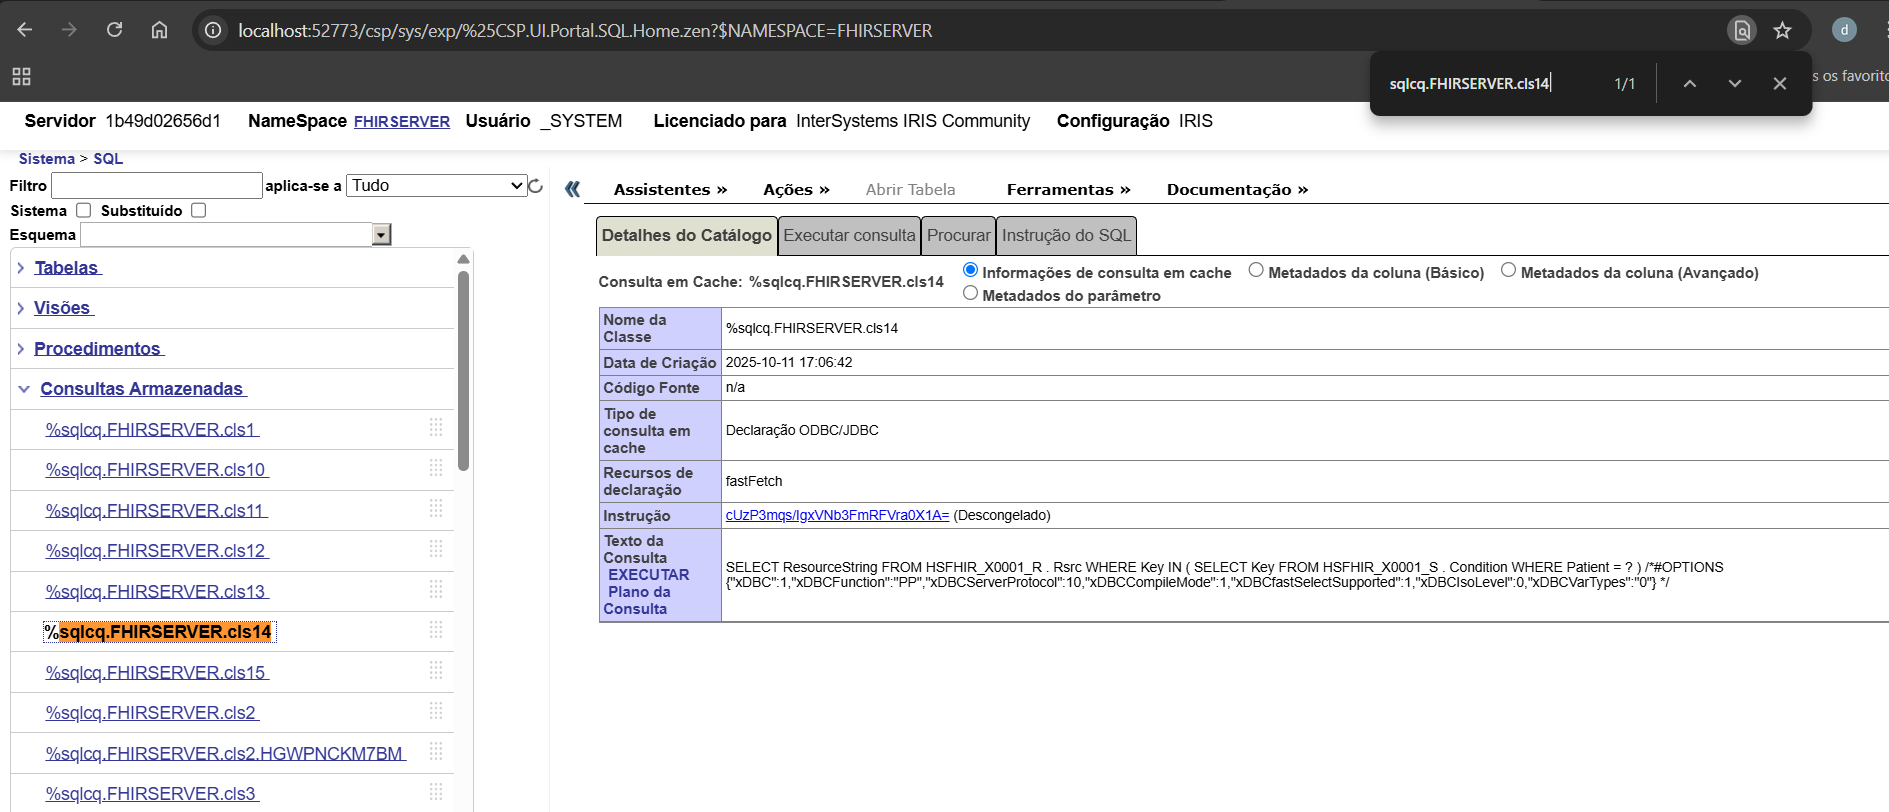
Insight: The
%sqlcq.FHIRSERVER.*routines capture all SQL cache queries executed by Quarkus within the method. Monitoring these routines allows developers to analyze query execution, understand code behavior, and identify potential performance bottlenecks. This makes them a powerful tool for development and debugging of FHIR-related operations.
6.6 Summary
This example demonstrates how a standard Quarkus service can transparently leverage IRIS native monitoring tools using the @PerfmonReport annotation. It combines:
-
CDI interceptors (Quarkus)
-
Hibernate PanacheRepositories (ORM)
-
IRIS native ObjectScript routines (^PERFMON)
The result is a fully automated and reproducible performance profiling mechanism that can be applied to any service method in the application.