Pop Songs Analytics

I really love documentaries! Last weekend I was watching a Netflix documentary called This is Pop, because it was Analytics Contest time and I thought: Why not creating a pop song analytics with InterSystems Iris?
The first challenge was the database. I found on Data World project a CSV file with the Billboard hot 100 songs from 2000 to 2018, created by "Michael Tauberg" @typhon, that fits perfectly.
I was talking to @Henrique Dias and he gave me the idea of using Microsoft Power BI for good looking report with charts.
Which genres were most popular between 2000 and 2018?
Which artists had more songs on Billboard?
Which year had more dance songs?
So let's analyze the data set, with a help of csvgen imported the CSV file.
The data set contains:
Title — Title of the song
Artist — Name of the Artist
Energy — The energy of the Song — higher the value, more energetic
Danceability — higher the value, easier it is to dance to the song
Loudness..dB.. — higher the value, louder the song.
Liveness — higher the value, more likely the song is a live recording.
Valence. — higher the value, more positive mood for the song.
Duration_ms. — The duration of the song in miliseconds.
Acousticness.. higher the value, more acoustic the song
Speechiness. — higher the value, more spoken word the song contains
Lyrics — Song lyric.
Genre — Musical Genre of Song.
On the CSV file the Genre is an array like this [u'dance pop', u'hip pop', u'pop', u'pop rap', u'rap']
My idea was to create a table for Genre and another table to solve the N:N relationship. A simple script on data populates this tables.
After that, just connect the Power BI on InterSystems Iris (here a step-by-step how to do that).
Next step: cool infographics.
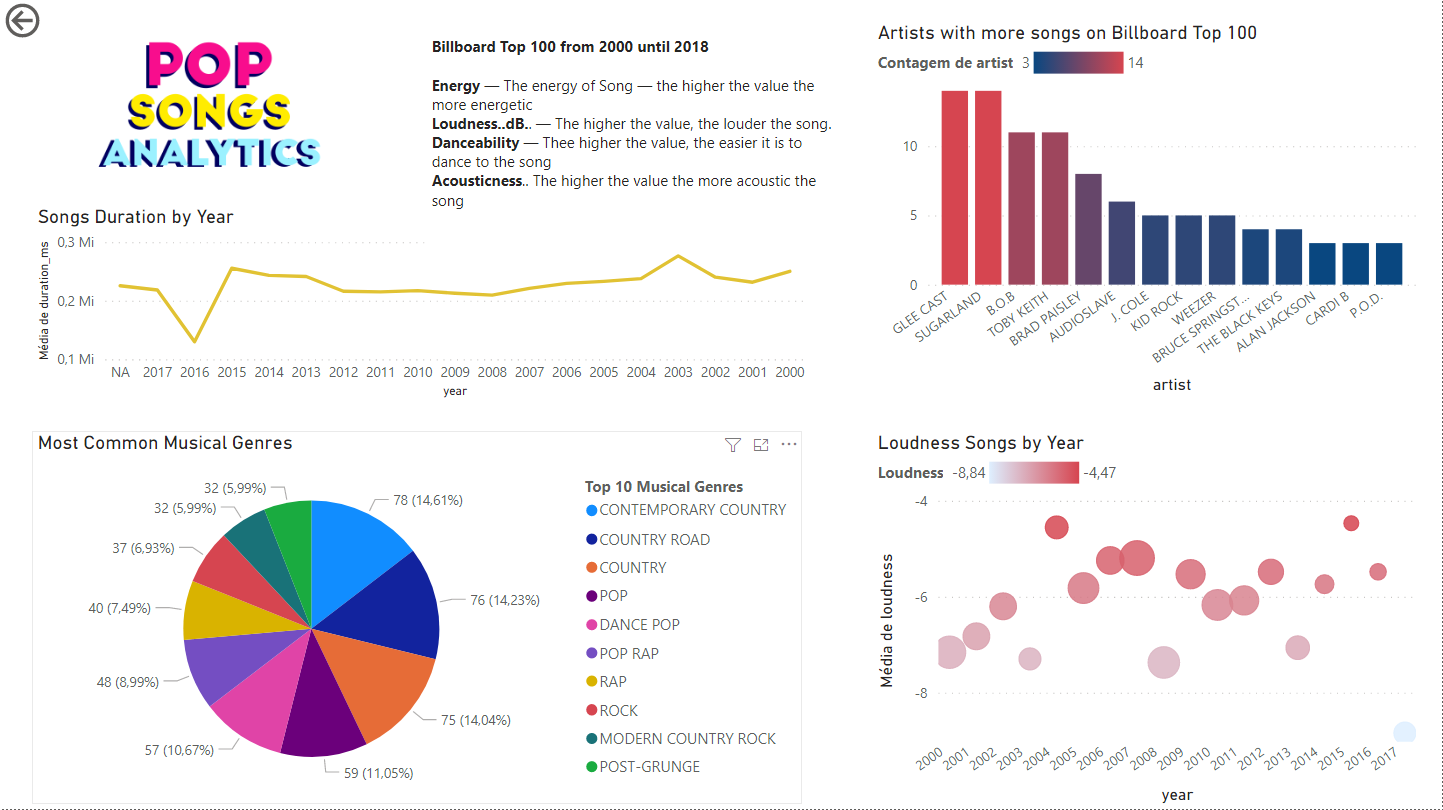
A bar chart to show the count of artists and a line chart for the average duration by year.
A pie chart with the most common genres, for my surprise, contemporary country was the most popular genre.
Has pop music gotten louder over the years? To answer that I use a Scatter plot with the average loudness by songs.
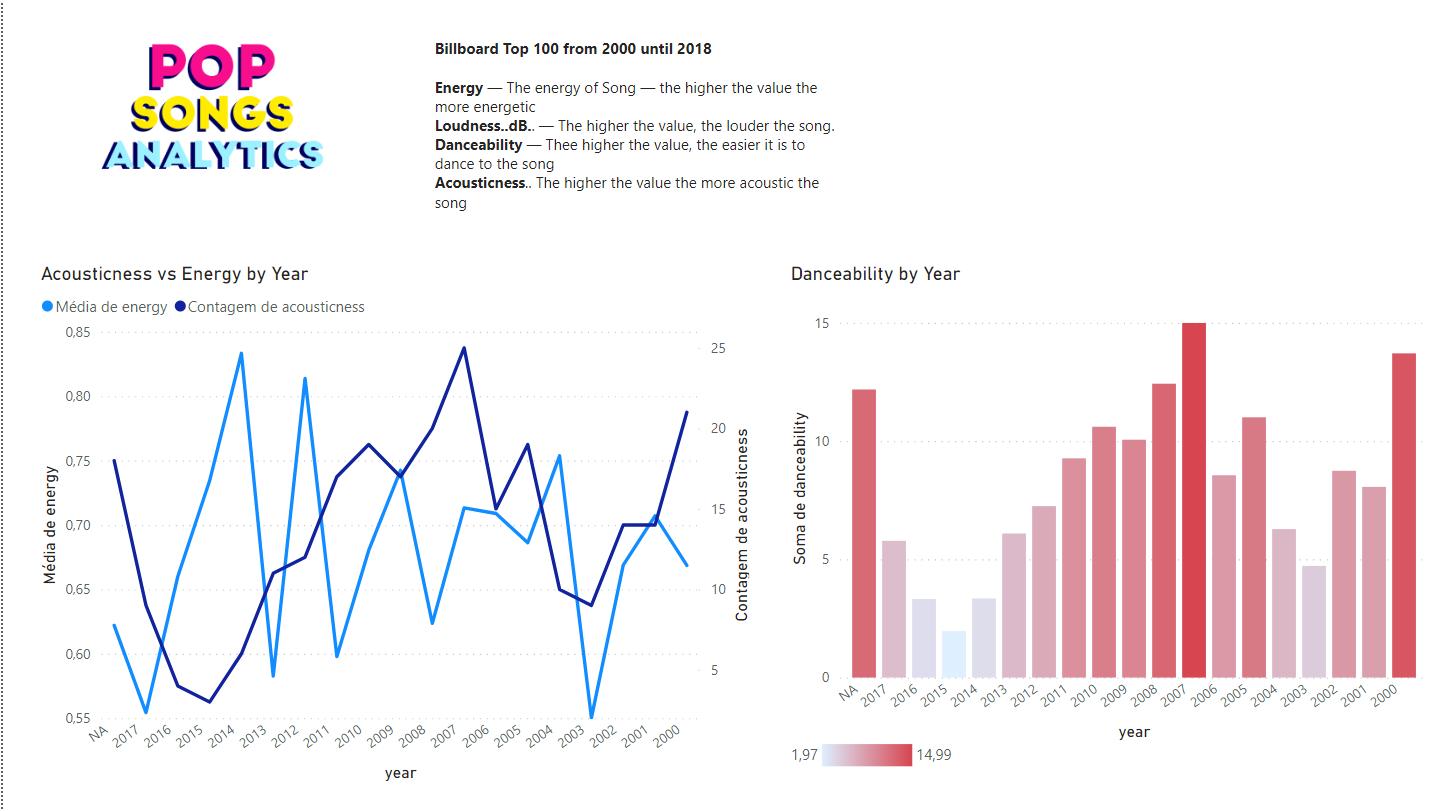
The Pop Songs become less or more danceable?
On the second page a bar chart shows how danceability changed by the years and a relation between energy versus acousticness.
If you liked the idea, please consider voting for the pop-songs-analytics
https://openexchange.intersystems.com/contest/current
Special thanks to @Henrique Dias for the nice chat and support.
Comments
When I downloaded your Repo from GitHub the docker image generated.
But I just see just NOTHING inside the container of the dc.* classes or globals that are in the repo
I couldn't find any cube or pivots or dashboards. Neither in the container nor in the repo.
Not just me, also Power BI just found NOTHING.
What do you expect me to vote for ?
Sorry.
Hi Cemper, thanks for your comment.
I fix the power bi file and I try to figure out my mistake with the globals on the repo.
Here the live demo https://bit.ly/3E5isQ2
The link shows me the following:

no chance. M$ wants a corporate e-mail. I have no corporation.
confirms my personal opinion on M$ products
I can only use the free download version.
Finally, the docker image now builds OK and contains all required classes & all globals.
( + also the bug in dc.script.Genre.cls was fixed)
Connection to local PowerBi now works and shows the expected images.
Thanks for fixing it.
I was somewhat surprised that IRIS Analytics was not required at all since there
was no Cube nor Pivot nor Dashboard. I built it myself just using dc.dc.bi.PopSongs.
OK. PowerBI graphics look better.
But here is not the place to comment on ZEN graphics.
I was somewhat surprised that IRIS Analytics was not required at all since there
was no Cube nor Pivot nor Dashboard. I built it myself just using dc.dc.bi.PopSongs.
Yes, IRIS contains IRIS BI for analytics but it needs additional skills to know it.
We want IRIS users to be able to create analytics solutions if they know PowerBI, Tableau, and Logi and use it vs the data in InterSystems IRIS
Congratulations @henry
I've always liked to see different approaches when using Analytics. Unfortunately, Native Analytics doesn't have the best visual dashboard in the world. This is a fact. 🤷🏻♂️
Showing the possibilities of different connections and tools is always very welcome.
Especially showing the connection with PowerBI, so used by many companies that sometimes they don't know that they can get this connection between InterSystems IRIS and MS PowerBI.