Diagnosing the cause of <PROTECT> errors
If your application is raising <PROTECT> errors and you're finding it hard to work out why, here's a way to get additional information.
First, if auditing is not already enabled, turn it on:
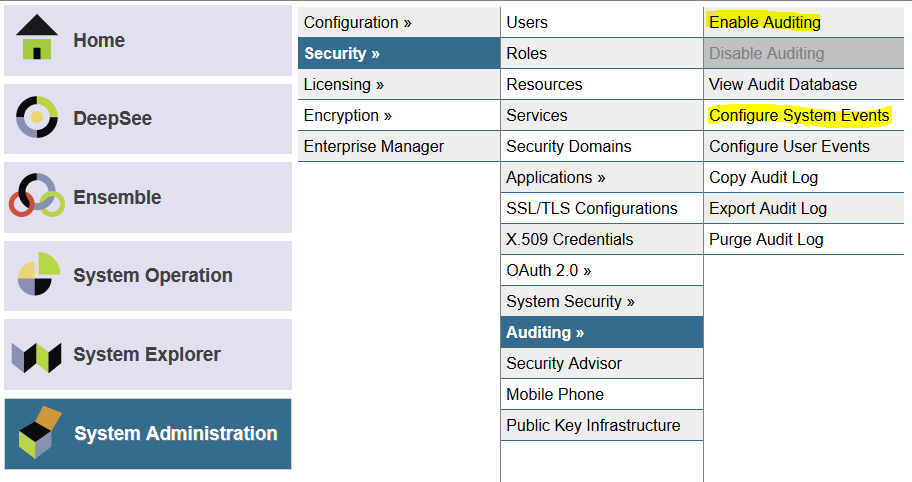
Then use "Configure System Events" (highlighted above) and locate the event named %System/%Security/Protect. In the screenshot below I used the Filter field to do this (type "protect" - highlighted below - and press TAB):
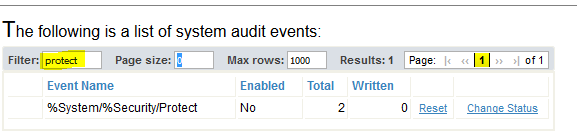
Notice that the Enabled column shows a value "No". By default <PROTECT> errors are not logged in the audit. So though my system has seen a total of 2 of the associated events, 0 have been written.
Use the "Change Status" link to toggle the Enabled value to "Yes".
Now do whatever causes your application to raise a <PROTECT> error.
Back in Portal, use the View Audit Database option and search for Protect events:
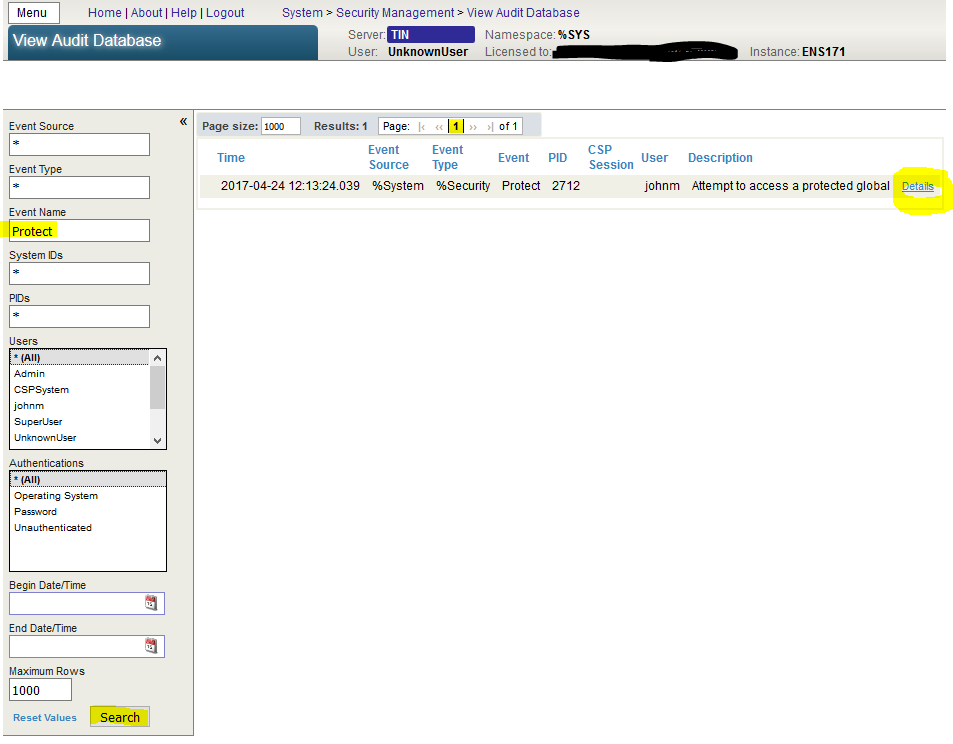
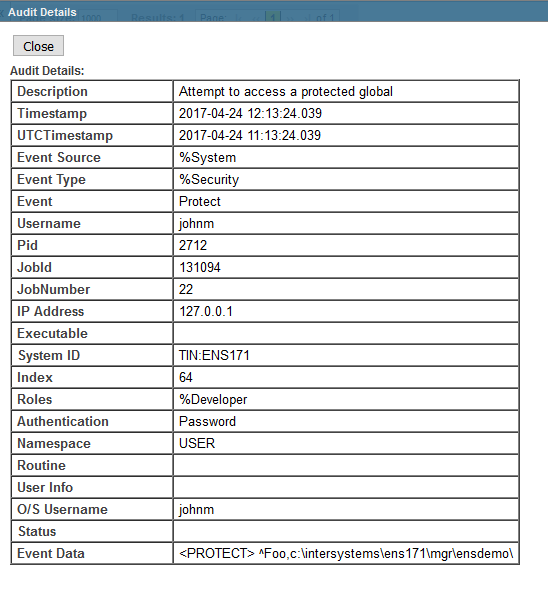
The Details link reveals more:
Afterwards you may want to put things back to how they were, disabling logging of %System/%Security/Protect events, and turning off auditing entirely if it wasn't previously enabled.
Comments
Thank you, John, for this reminder, while I prefer to deliberately enable auditing of all events for the simple reason: a few added-on disk IOPS, as well as 1GB+ of disk space for audit database (even on high loaded Caché instances) do not seem to be a great price for an ability to trace not predicted cases in production.
We even met a prospect's requirement that any audit database write failure should be dealt as a critical error with a notification of admins by all means, even with shutting the Caché down!