 Open Exchange
Application Errors Analytics
Hi Developers!
As you know the application errors live in ^ERRORS global. They appear there if you call:
d e.Log() in a Catch section of Try-Catch.
With @Robert.Cemper1003's approach, you can now use SQL to examine it.
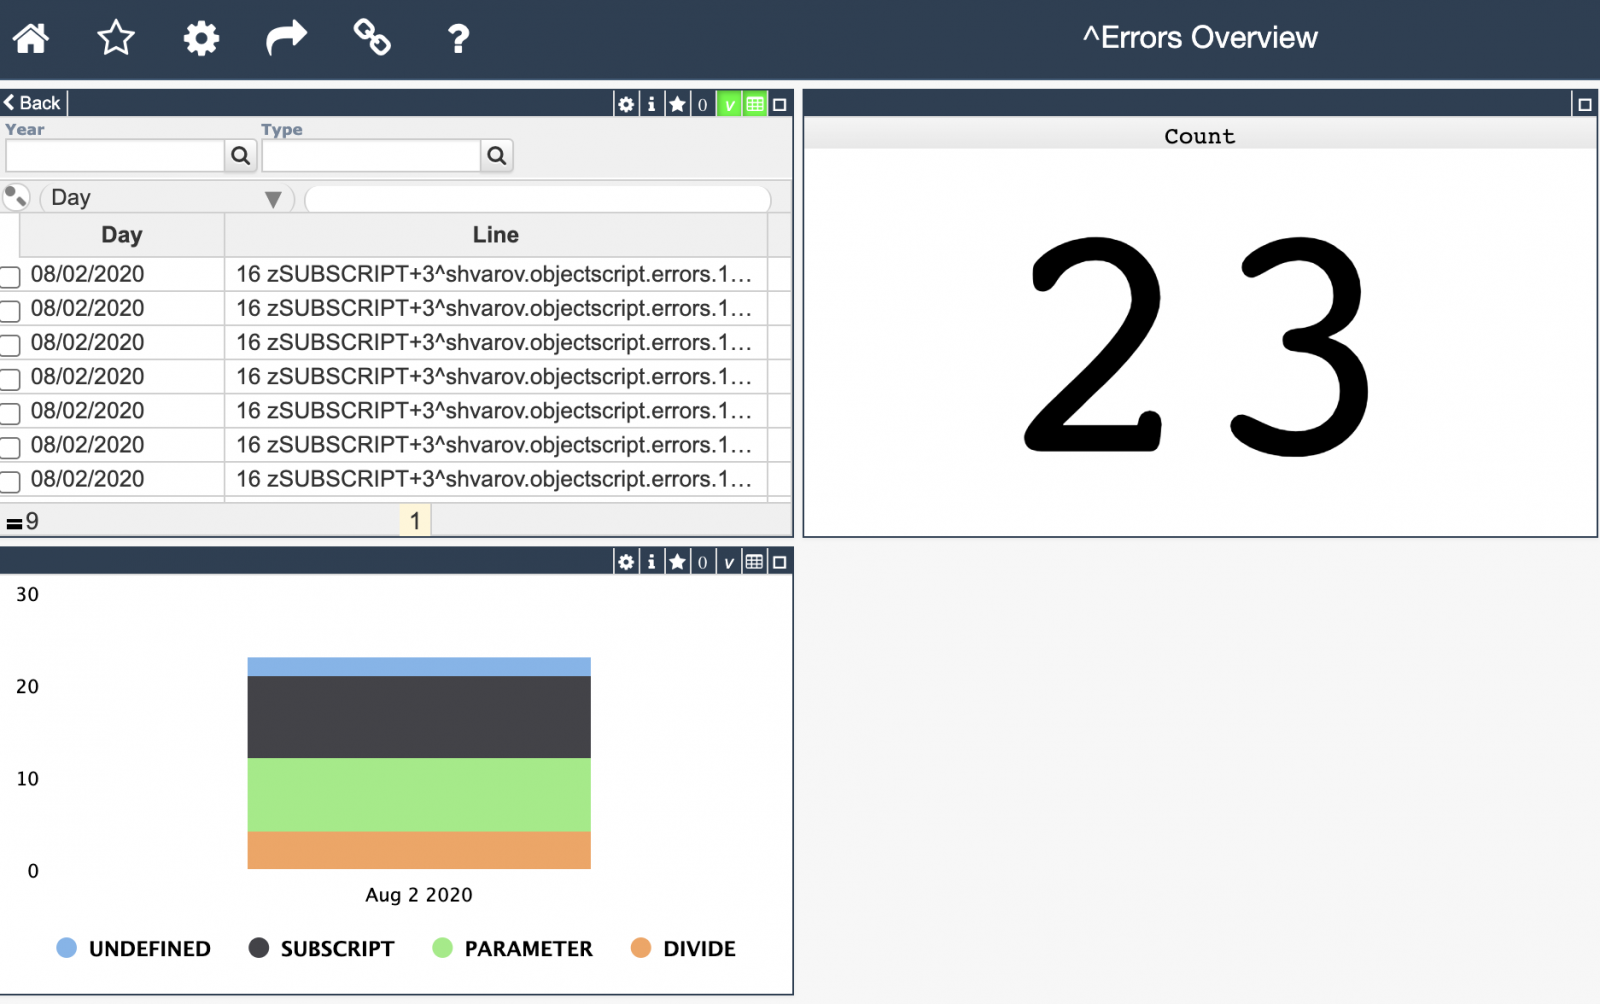
Inspired by Robert's module I introduced a simple IRIS Analytics module which shows these errors in a dashboard:

And you can drill to lines if click on the charts:
How to use it?
You can install the module with the following ZPM command:
USER>zpm "install objectscript-errors-analytics"
If you have errors in this namespace (e.g. in USER) you can check the dashboard in browser:
http://localhost:yourport/dsw/index.html#!/d/Errors/Overview.dashboard?ns=USER
And you can generate some random errors with the following command:
do ##class(shvarov.objectscript.errors.analytics.setup).GenerateErrors()
And to refresh the data and rebuild the cube:
do ##class(shvarov.objectscript.errors.analytics.setup).Run()
What is cool about this project, that it uses a new feature of 0.2.5 ZPM version to deploy IRIS Analytics resources.
Looking for your feedback and collaboration!