Using Cloud Monitoring to Monitor IRIS-Based Applications Deployed in GKE
In this article, we’ll look at one of the ways to monitor the InterSystems IRIS data platform (IRIS) deployed in the Google Kubernetes Engine (GKE). The GKE integrates easily with Cloud Monitoring, simplifying our task. As a bonus, the article shows how to display metrics from Cloud Monitoring in Grafana.
Note that the Google Cloud Platform used in this article is not free (price list), but you can leverage a free tier. This article assumes that you already have a project in the Google Cloud Platform (referred to as <your_project_id>) and have permission to use it.
We’ll use the following tools:
- gcloud version Google Cloud SDK 346.0.0
- kubectl version v1.17.12
- k9s version v0.24.14 (just for fun)
- helm version v3.6.3
- helmfile version v0.139.9
GKE Creation
Let’s start with Kubernetes cluster creation. A regional private cluster looks good. Let’s also create network address translation (NAT) to allow traffic from nodes to the Internet.
Initialize connection to Google Platform:
$ gcloud init
$ gcloud auth login
$ gcloud projects list
$ gcloud config set project <your_project_id>
Create a dedicated network:
$ gcloud compute networks create kubernetes --subnet-mode custom
$ gcloud compute networks subnets create kubernetes --network kubernetes --range 10.20.0.0/24 --region us-east1 --secondary-range pods=10.42.0.0/16,services=172.20.0.0/16
Assign a couple of static IPs (for NAT and Grafana endpoint, see below):
$ gcloud compute addresses create kubernetes --region=us-east1
$ gcloud compute addresses create kubernetes-grafana --region=us-east1
Create NAT:
$ gcloud compute routers create kubernetes --network=kubernetes --region us-east1
$ gcloud compute routers nats create kubernetes --router=kubernetes --nat-all-subnet-ip-ranges --nat-external-ip-pool=kubernetes --region=us-east1
Finally create GKE. Kubernetes version is 1.20.8-gke.900.
Last line “enable-stackdriver-kubernetes” means that metrics, logs and events from the cluster will be gathered and sent to Cloud Monitoring – see Configuring Cloud Operations for GKE:
$ gcloud container clusters create kubernetes   \
  --region us-east1                                               \
  --machine-type e2-small                                   \
  --num-nodes 1                                                  \
  --enable-private-nodes                                     \
  --no-enable-master-authorized-networks         \
  --cluster-version 1.20.8-gke.900                      \
  --enable-ip-alias                                               \
  --cluster-ipv4-cidr 10.24.0.0/14                        \
  --master-ipv4-cidr 10.0.0.0/28                          \
  --services-secondary-range-name services      \
  --cluster-secondary-range-name pods              \
  --no-enable-autoupgrade                                  \
  --enable-autorepair                                           \
  --network kubernetes                                        \
  --subnetwork kubernetes                                  \
  --enable-stackdriver-kubernetes
Let’s connect to the newly created cluster:
$ gcloud container clusters get-credentials kubernetes --region us-east1 --project <your_project>Default Monitoring
Let’s look at the workloads in our cluster (nice k9s output):
$ k9s We see three pods (one for each node). These pods are managed by a DaemonSet, and called by the Google Kubernetes Engine Metrics Agent (gke-metrics-agent). Under the hood, this agent leverages the Open Telemetry Collector enhanced by Google-specific features. You can spend some time looking at its configuration, which is thoroughly described on the page OpenTelemetry Collector Configuration Format.
Because of the gke-metrics-agent, we’re immediately able to see a lot of useful GKE-related metrics on a dashboard in Cloud Monitoring:

To add IRIS metrics (we do not have IRIS in the cluster yet), we deploy an application similar to the gke-metrics-agent, but with our configuration.
A Note About Application Installation
A common way to deploy applications in Kubernetes clusters is by using Helm. For this article, several Helm charts were prepared and published in a custom public Helm repository. You can see how to do this on GitHub and in this guide that reviews how to make and share your Helm package. You need to have a Helm chart in a directory for each application according to The Chart Template Developer’s Guide, like simple-iris. Then, we package a chart:
$ helm package simple-iris/Then move a resulting gzipped archive into a repository directory (gh-pages branch). Then update the index-file:
$ helm repo index . --url https://myardyas.github.io/helm-charts/Push the updated index-file as well as the archive into GitHub.
We just created the charts for the gke-metrics-agent and IRIS itself. IRIS is a stateless application for our monitoring purpose, so for simplicity, we use the Deployment command instead of Statefulset.
Let’s look at the available charts:
$ helm repo add iris-monitoring https://myardyas.github.io/helm-charts/
$ helm repo update
$ helm search repo iris-monitoring --versions --devel --max-col-width 35
NAME                                             CHART VERSION APP VERSION         DESCRIPTION
iris-monitoring/gke-metrics-agen... 0.1.0                      1.0.3-gke.0                GKE metrics agent chart (based o...
iris-monitoring/metrics-proxy          0.1.0                      7.70.0                        Service Chart to add a default m...
iris-monitoring/simple-iris               0.1.0                       2021.1.0.215.0         Simple stateless IRIS Community ...
Here we see yet another chart called metrics-proxy. IRIS exposes Prometheus metrics without metrics types, leading to the gke-metrics-agent complaining about an “UNSPECIFIED” type. As a workaround, we send metrics from IRIS to the gke-metrics-agent using metrics-proxy, whose only job is to add a default “gauge” type. You can view the source code of the charts easily in this way:
$ helm fetch --untar iris-monitoring/simple-iris --version 0.1.0
$ cd simple-iris # browse files here
Install IRIS and Monitoring Tools into a Cluster
Having prepared the charts, we can install them. A common way to install Helm charts into clusters is helm install or helm upgrade --install. But this time, let’s try a more declarative way to do the same thing using helmfile.
Prepare the following file, helmfile.yaml:
$ cat helmfile.yaml
repositories:
- name: iris-monitoring
  url: https://myardyas.github.io/helm-charts

- name: grafana
  url: https://grafana.github.io/helm-charts
helmDefaults:
  wait: true
  timeout: 600
  force: false
  historyMax: 5
  createNamespace: true
  atomic: true
releases:
- name: simple-iris
  chart: iris-monitoring/simple-iris
  namespace: iris
  version: 0.1.0
- name: gke-metrics-agent-custom
  chart: iris-monitoring/gke-metrics-agent-custom
  namespace: iris
  version: 0.1.0

- name: metrics-proxy
  chart: iris-monitoring/metrics-proxy
  namespace: iris
  version: 0.1.0
- name: grafana
  chart: grafana/grafana
  namespace: grafana
  version: 6.15.0
  values:
  - grafana-values.yaml
  set:
  - name: service.loadBalancerIP
    value: {{ requiredEnv "LOAD_BALANCER_IP" }}
This code contains a list of repositories from which we’re going to install some charts. Here are our IRIS-monitoring repository and a public Grafana repository (we’ll use Grafana soon, so you need to install it too).
Besides repositories, the helmfile.yaml file sets default values for things like namespaces if they don’t exist. The most important part of the helmfile is a releases list. The release list is just an installed Helm chart. Each release contains a chart name, namespace, and version. The Grafana release list also sets a custom IP address (to reach the Grafana UI) and provisions a data source and dashboard in the grafana-values.yaml file. We must create this file as follows:
$ cat grafana-values.yaml
service:
  type: LoadBalancer
datasources:
  datasources.yaml:
    apiVersion: 1
    datasources:
    - name: Google Cloud Monitoring
      type: stackdriver
      isDefault: true
      jsonData:
        authenticationType: gce
      editable: true
      readOnly: true
dashboardProviders:
  dashboardproviders.yaml:
    apiVersion: 1
    providers:
    - name: 'default'
      orgId: 1
      folder: ''
      type: file
      disableDeletion: false
      editable: true
      options:
        path: /var/lib/grafana/dashboards/default
dashboards:
  default:
    iris:
      gnetId: 14869
      revision: 1
      datasource: Google Cloud Monitoring
Note that the dashboard has the number 14869. This dashboard contains several panels with metrics, like those shown by the System Alerting and Monitoring Guide (SAM).
Now we’re almost ready to run an installation procedure. The final step is to define an IP address to access Grafana (replace <your_project_id> with your project ID):
$ export LOAD_BALANCER_IP=$(gcloud compute addresses list --project <your_project_id> --filter="name~'kubernetes-grafana'" --format="value(Address)")
$ echo $LOAD_BALANCER_IP
x.x.x.x
Let’s finally run an installation:
$ helmfile sync
$ k9s
Wait for k9s (or kubectl) until all new pods are running: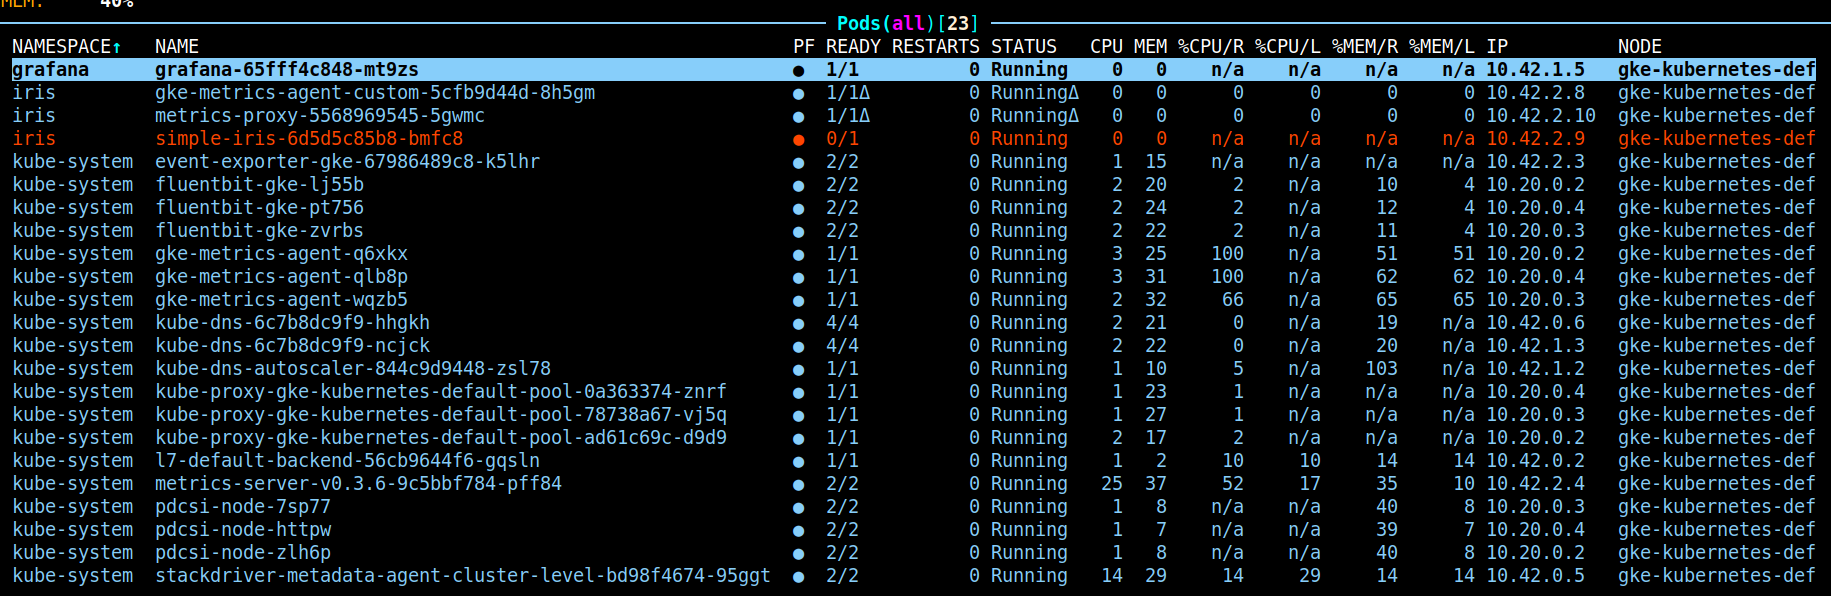
Visualization in Cloud Monitoring
Note that we didn’t expose the IRIS web port to the world this time. We don’t need it for this article, but you can leverage the port-forward application to check IRIS metrics this way:
$ kubectl -n iris port-forward svc/simple-iris 52773:52773Then, in a different terminal, enter the following:
$ curl -s http://localhost:52773/api/monitor/metrics
iris_cpu_pct{id="AUXWD"} 0
iris_cpu_pct{id="CSPDMN"} 0
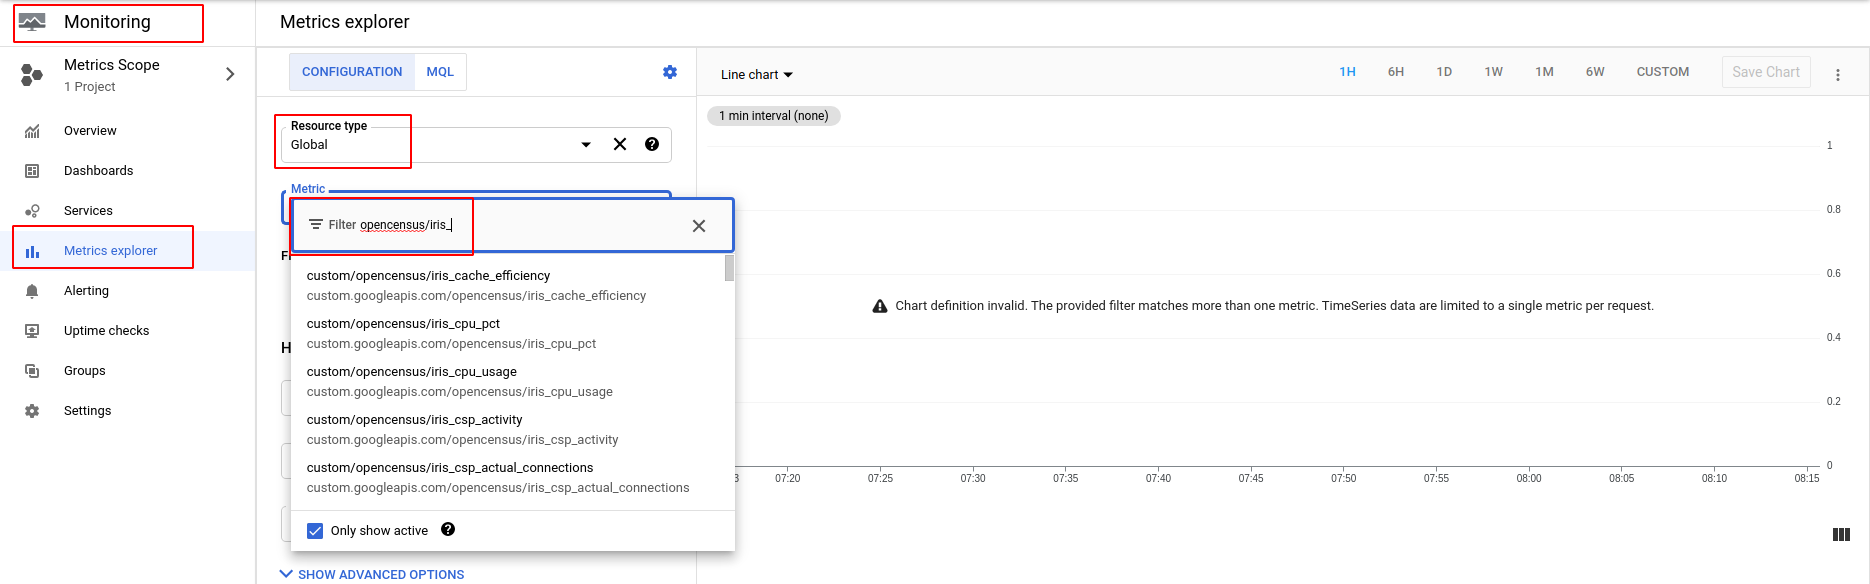
…Having checked these metrics, let’s look in the Cloud Monitoring console’s Metrics explorer. Select the Global resource type.
 Now look at the iris_process_count metric:
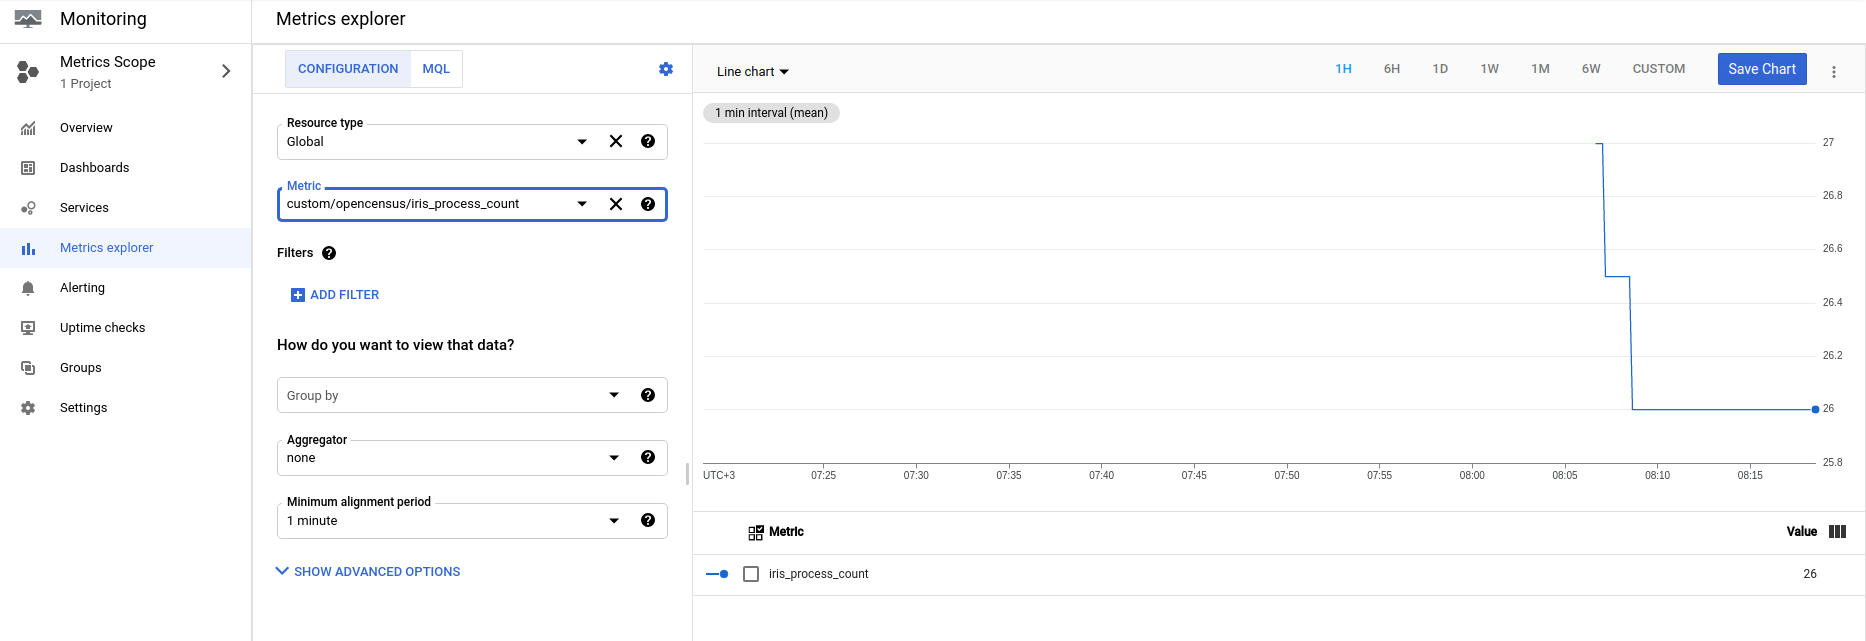
We can create dashboards that combine these metrics in a single place. But these dashboards are available only for users of this Google project and aren’t very flexible in their settings. Because of that, let’s look at IRIS metrics in a much handier tool: Grafana.
Visualization in Grafana
For a connection to Grafana, use the IP-address, x.x.x.x, stored in the LOAD_BALANCER_IP variable:
$ echo ${LOAD_BALANCER_IP}
The username is admin.
The password is the output of:
$ kubectl get secret --namespace grafana grafana -o jsonpath="{.data.admin-password}" | base64 --decode ; echoThe IRIS dashboard appears.

Any person who knows the address and password can view this dashboard. Feel free to add your own dashboards.

Cleanup
When you’re done, don’t forget to remove unused parts from the Google Cloud Platform. You can remove everything this way:
$ gcloud --quiet container clusters delete kubernetes --region us-east1
$ gcloud --quiet compute routers nats delete kubernetes --router=kubernetes --region=us-east1
$ gcloud --quiet compute routers delete kubernetes --region=us-east1
$ gcloud --quiet compute addresses delete kubernetes-grafana --region=us-east1
$ gcloud --quiet compute addresses delete kubernetes --region=us-east1
$ gcloud --quiet compute networks subnets delete kubernetes --region us-east1
$ gcloud --quiet compute networks delete kubernetes
Conclusion
We’ve shown one of the almost endless approaches to monitoring IRIS applications deployed in GKE. This time we’ve focused on metrics stored in Cloud Monitoring and displayed in Grafana. But don’t forget about IRIS logs. Pods logs are, at the moment of writing, gathered by fluentbit and sent to Cloud Logging where they can be viewed.
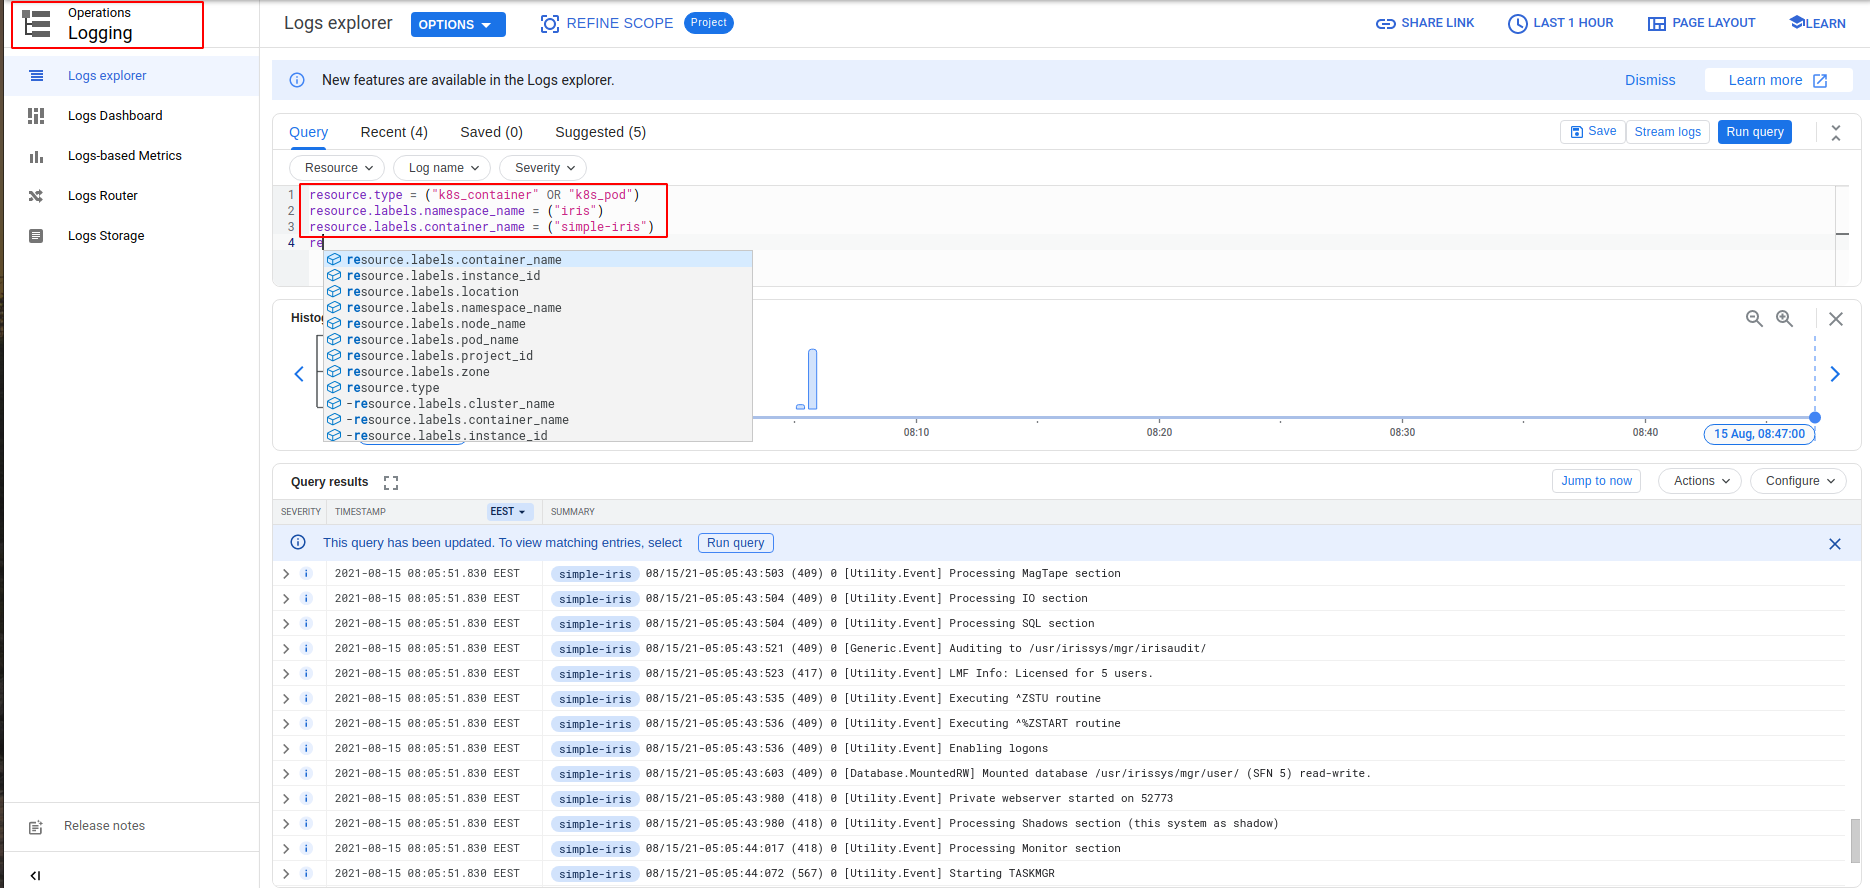
You can find examples of queries at Kubernetes-related queries. It’s interesting to show logs in Grafana too. Project Grafana Loki is exactly for that. An example of integration is available at Use Loki to Manage k8s Application Logs.