Rebuilding the IRIS Production Monitor as a Modern Angular App — Looking for Feedback
Hi community,
I've been working on a side project that I'd love to get some eyes on: a ground-up rebuild of the classic IRIS Production Monitor using a modern web stack. The existing ZEN/CSP-based portal does the job, but I wanted to explore what a contemporary, real-time version of it could look like.
What it is
A standalone Angular web application that connects to any Interoperability-enabled IRIS namespace and gives you a live view of your production — services, processes, operations, queues, event log, and message traffic — all in one screen.
How it works
Rather than polling the server on a timer, the app uses Server-Sent Events (SSE). A single persistent connection to a lightweight %CSP.REST class on the IRIS side pushes a combined snapshot every 5 seconds:
GET /api/monitor/stream
Each snapshot contains the full production state in one JSON payload:
{
  "status":   { "server": "...", "namespace": "...", "user": "...", "production": "...", "lastUpdate": "..." },
  "items":    [ { "name": "...", "type": "service|process|operation", "status": "ok|error|warning|disabled", ... } ],
  "queues":   [ { "name": "...", "count": 0 } ],
  "eventlog": [ { "id": "...", "level": "info|warning|error", "source": "...", "message": "..." } ]
}
The browser never polls. If the connection drops, EventSource reconnects automatically.
There are also individual REST endpoints for on-demand data:
| Endpoint | Description |
|---|---|
GET /activity?item=&timeframe= |
Message throughput bucketed by time window (15m / 1h / 6h / 24h) |
GET /messages?item=&type= |
Last 50 messages for the production or a specific item |
Tech stack
Frontend
- Angular 21
- Tailwind CSS v4
- No third-party component library — everything is hand-rolled
Backend
- A single ObjectScript class (
ProductionMonitor.REST) extending%CSP.REST - Reads from
Ens.Config.Production,Ens.MessageHeader,Ens_Util.Log, andEns_Queue.Contents - No additional packages or dependencies required on the IRIS side
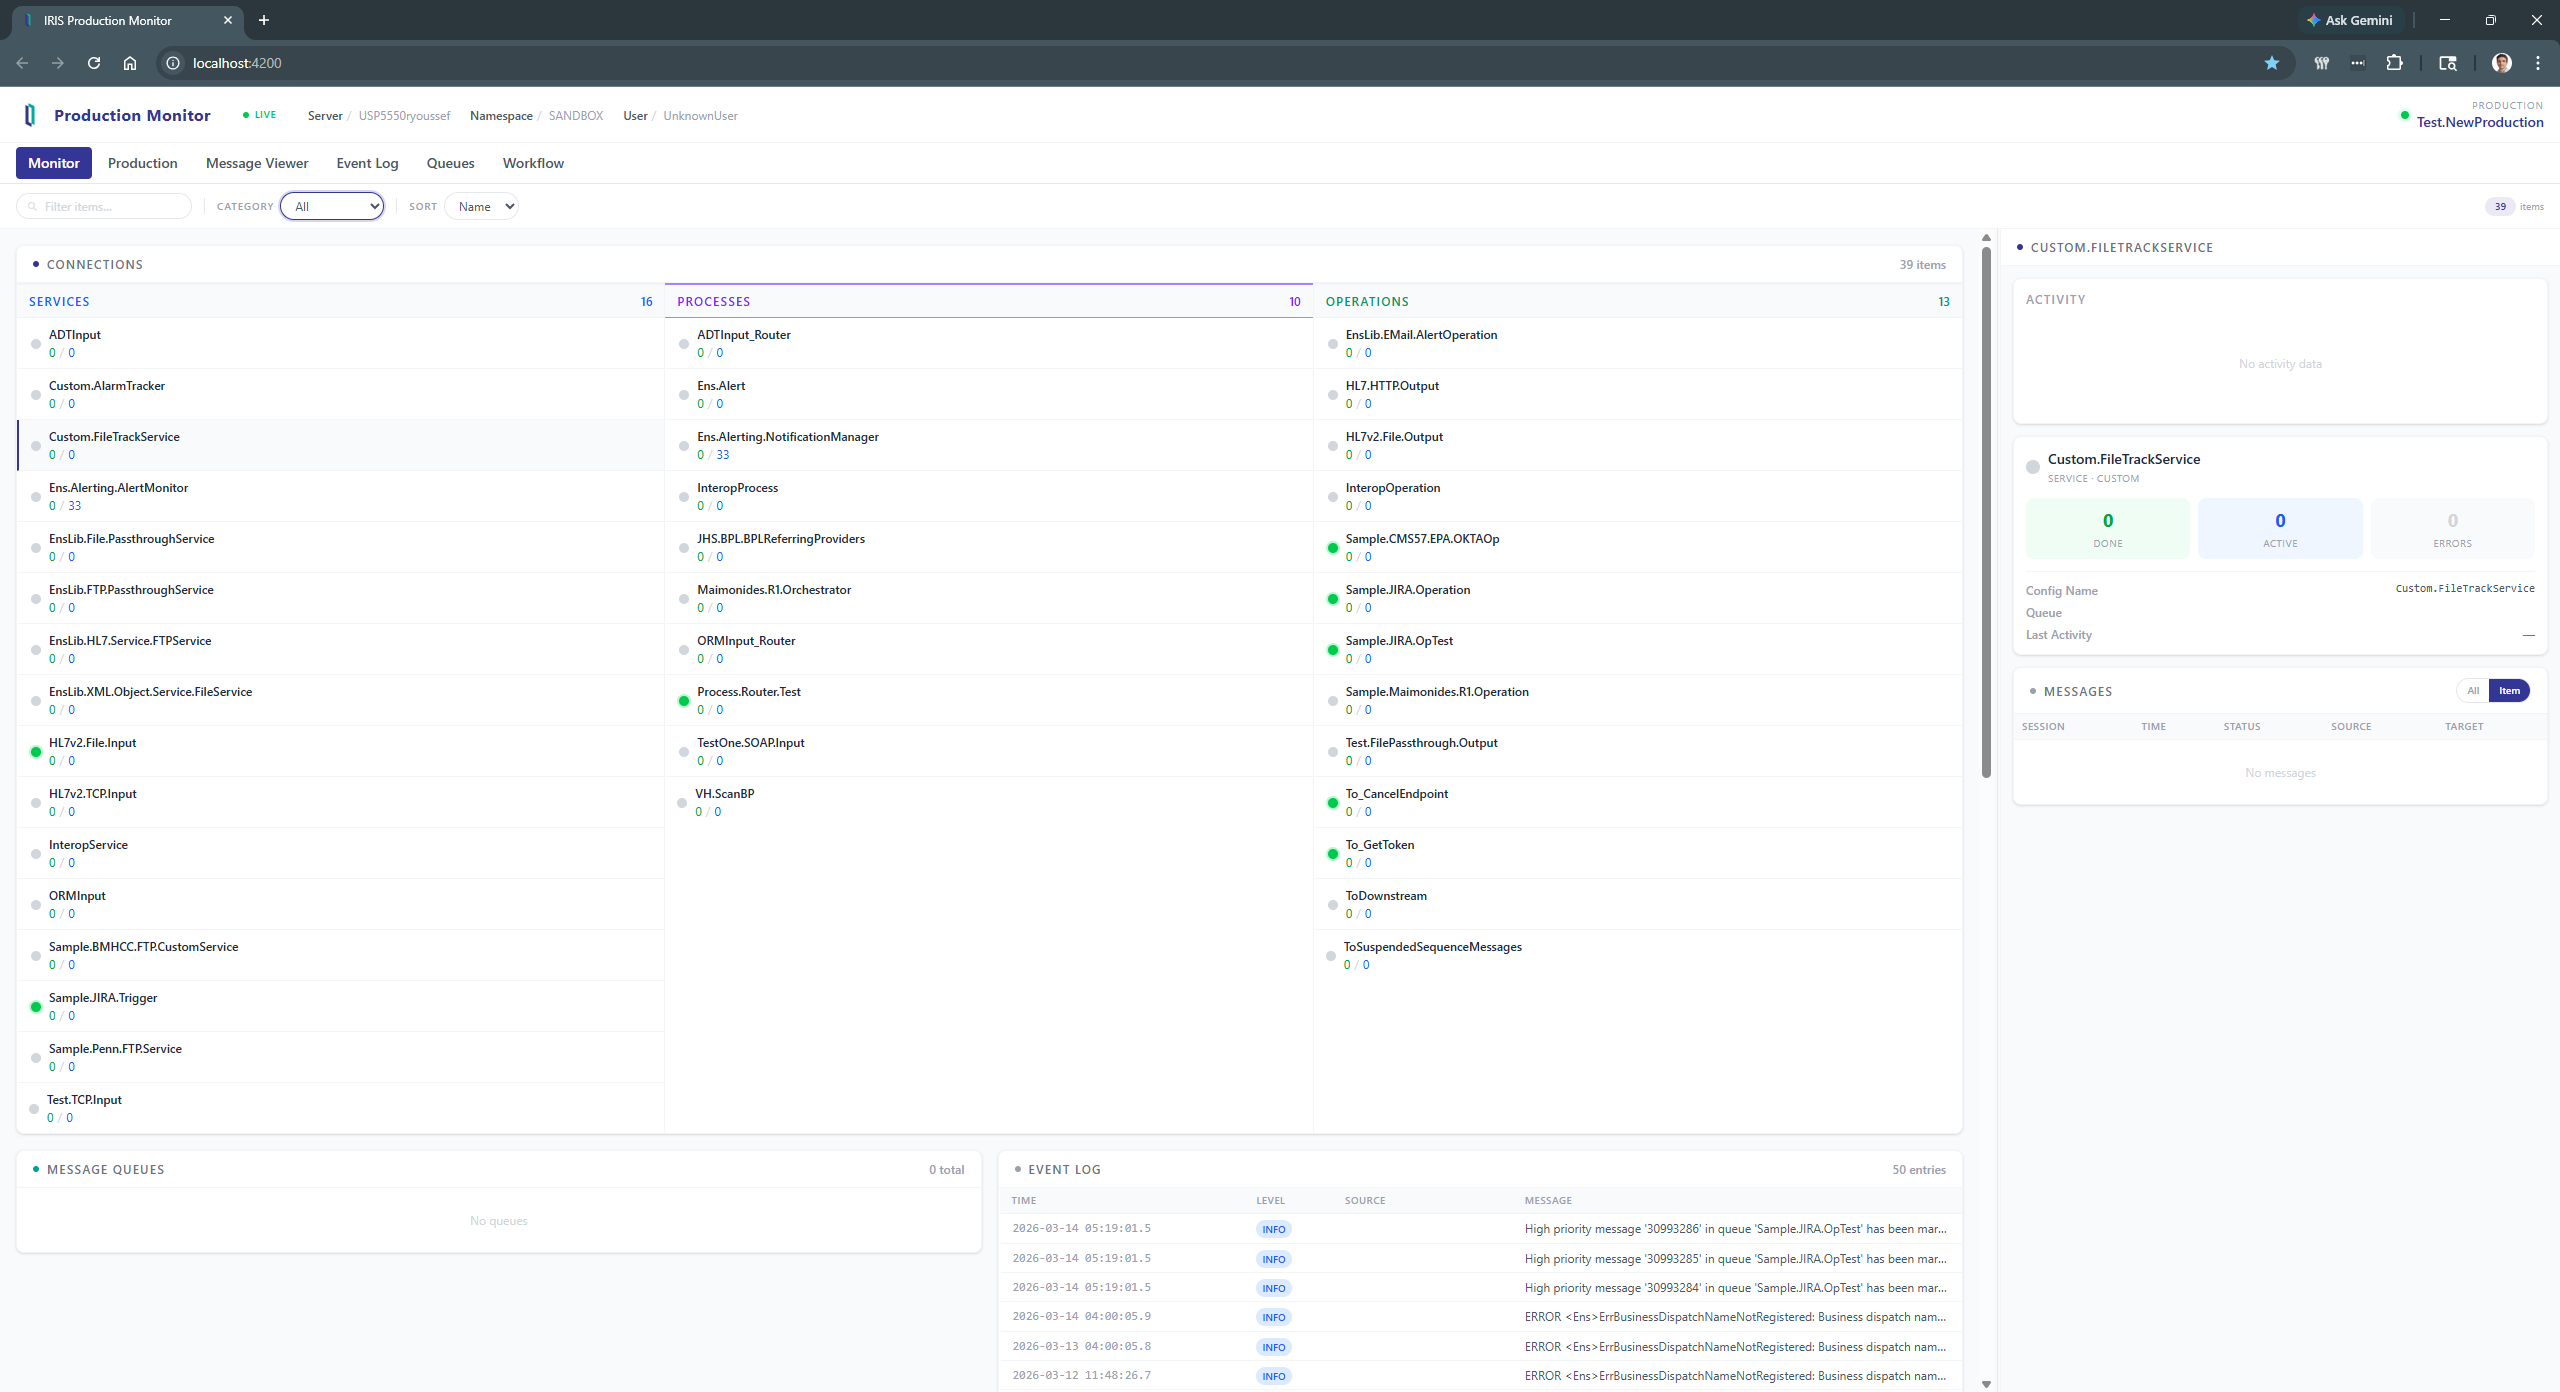
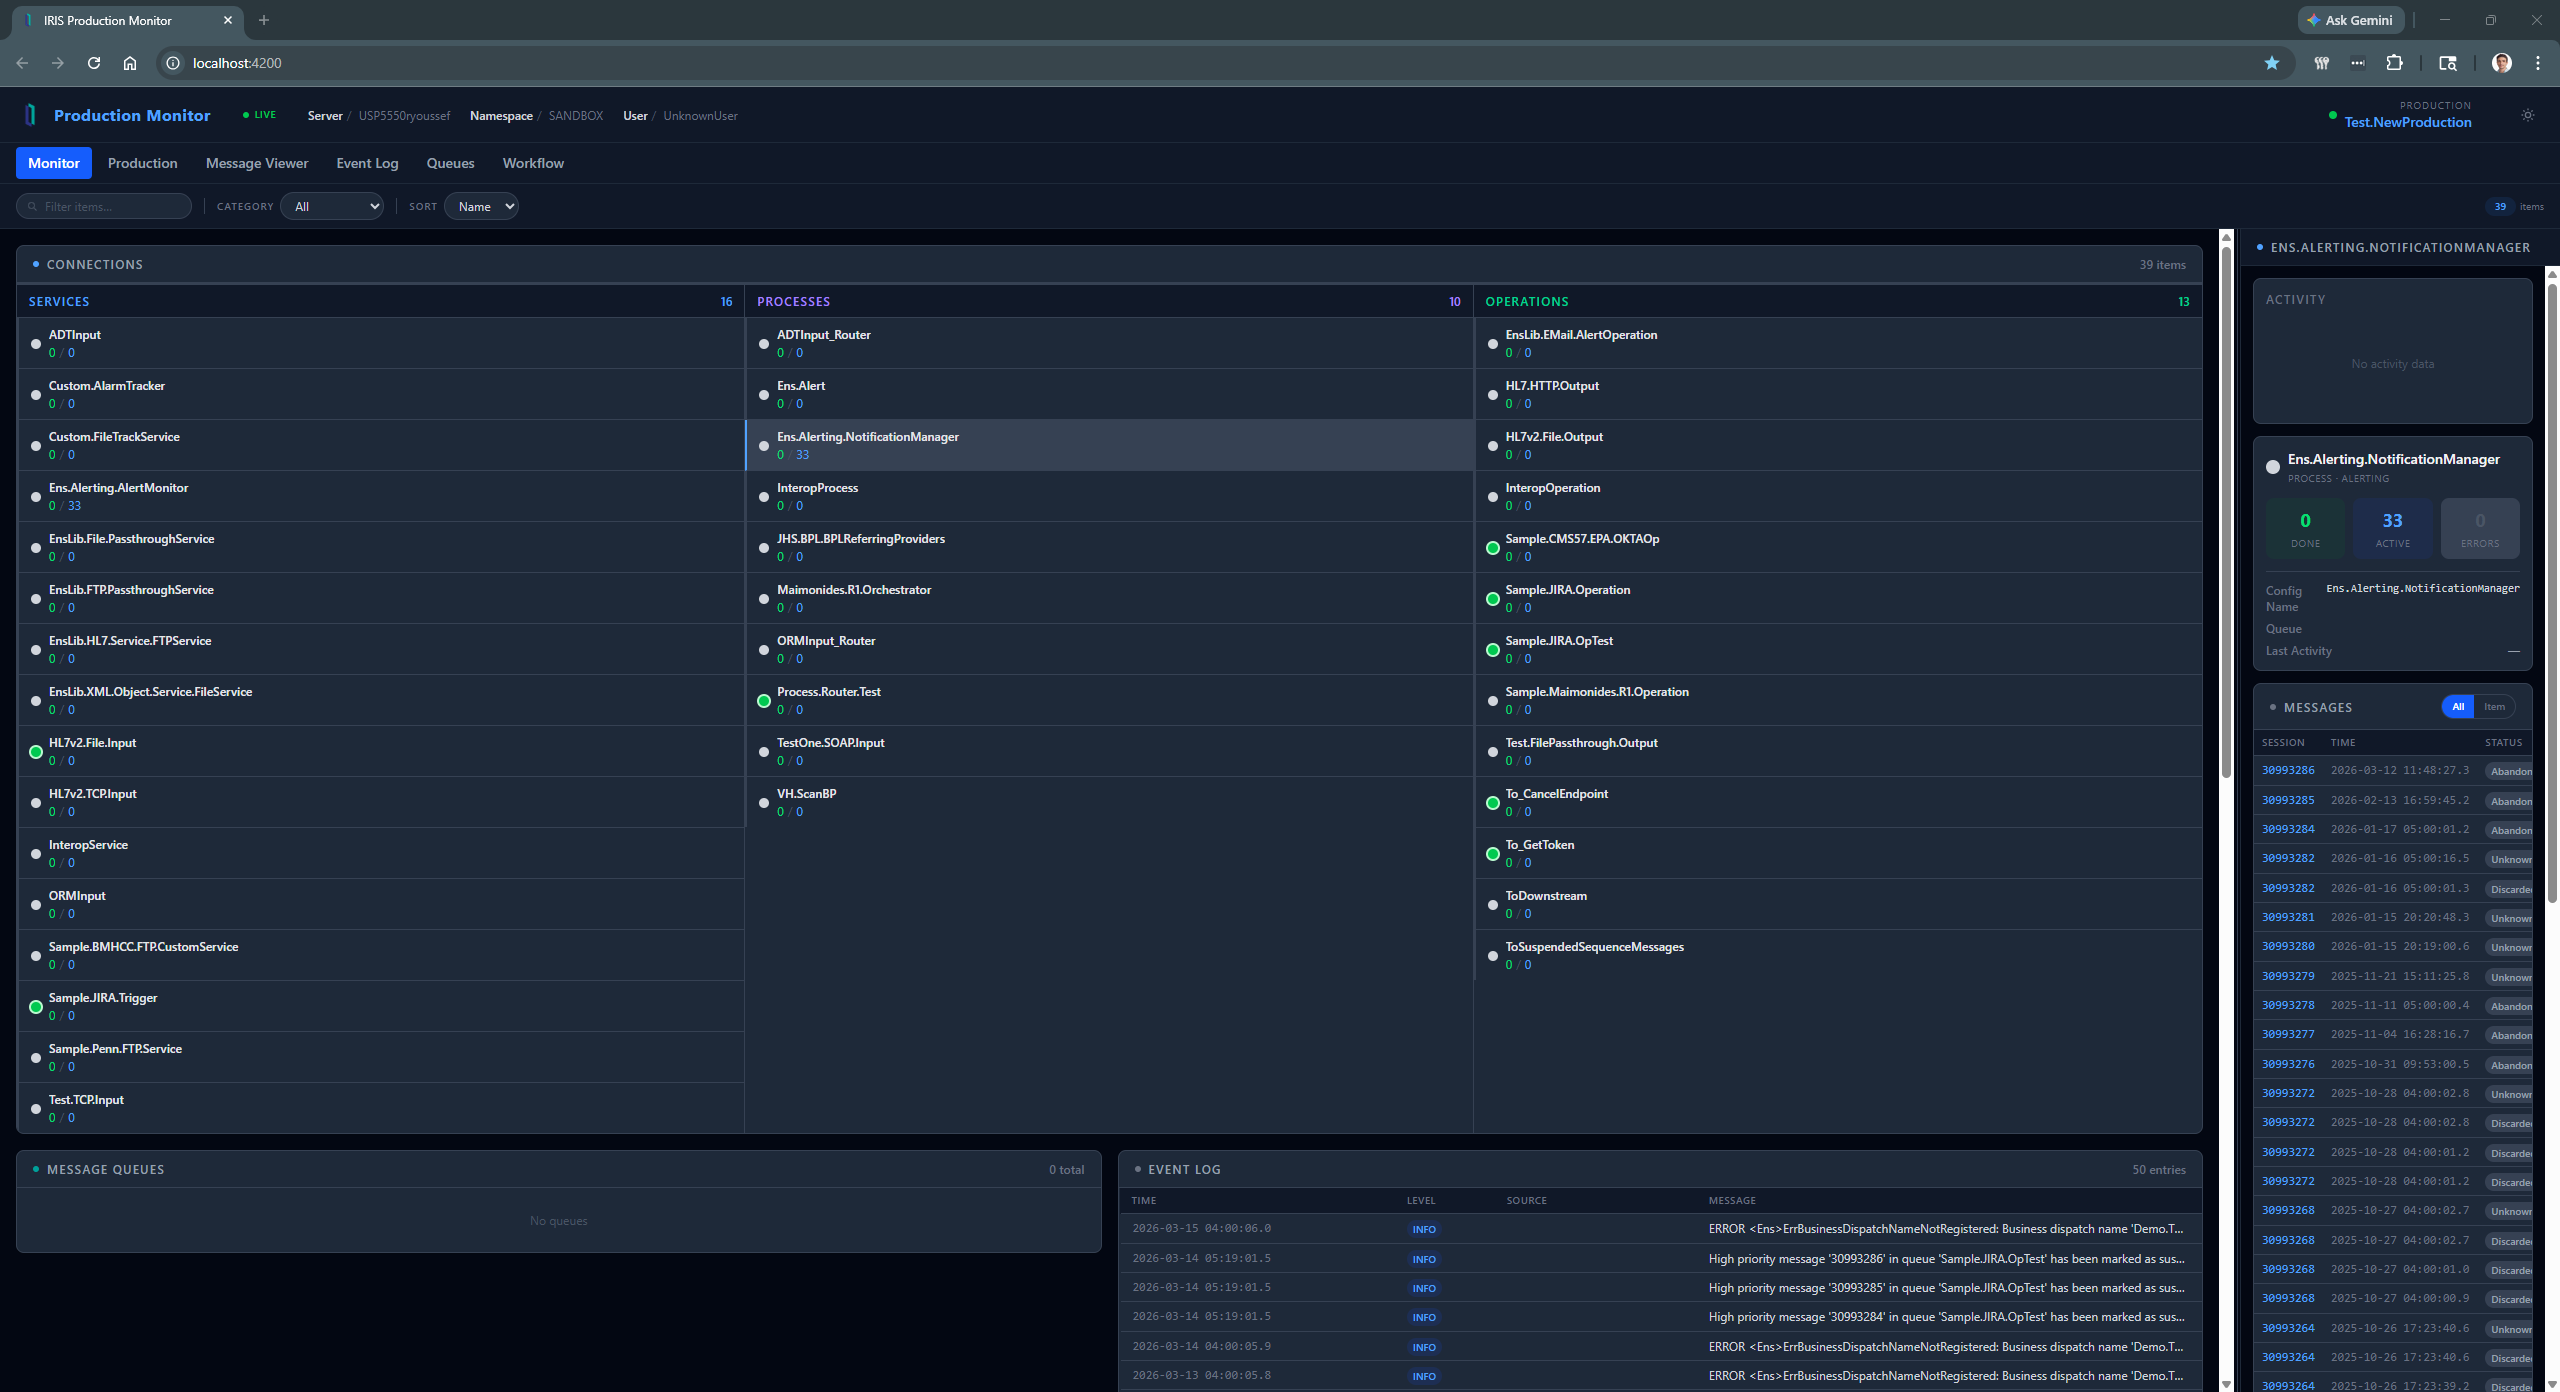
What the UI shows
Connections panel — the three item types (Services, Processes, Operations) are shown in side-by-side columns, each color-coded. Each row shows the item's live status, completed/in-progress/error counts, and queue depth.
Queues panel — all active queues with their current depth, highlighting any that are non-zero.
Event log — the 50 most recent log entries with level badges and left-border color accents for errors and warnings.
Details panel (resizable, collapsible) — clicking any item opens a detail view showing an activity sparkline chart, stat counters, and the last 50 messages scoped to that item or the full production.
What I'm looking for
- Correctness — are there IRIS API calls I'm doing the wrong way? The item status derivation (checking
Ens_Util.Logfor recent errors/warnings sinceGetItemStatusdoesn't exist) feels like a workaround. Is there a more official approach? - Missing data — what information do you look at most in the classic Production Monitor that isn't represented here?
- Design — does the layout make sense to operators who use the Production Monitor day to day? What would you reorganize?
- General feedback — anything else you'd change, remove, or add
Thanks for reading. Looking forward to hearing what the community thinks.
Comments
Hi @Raef Youssef !
Thanks for sharing! But where is the app? May I try it on my local IRIS?
This is alpha version. I did not want to post it on tech exchange until at least beta. Will package it and share with you so that it stays internal. Would gladly share it with those who are interested, so message me if you are.
Maybe it would be faster if the components themselves update a predefined global for that reason, I don't know!