How difficult is it to create a report using InterSystems Reports?
How difficult is it to create a report using InterSystems Reports?
Spoiler
I created two simple examples using the InterSystems IRIS + InterSystems reports and will try to share how easy it is to set up these two applications together!
In the next few paragraphs, I describe a step-by-step guide to this process's ease and simplicity.
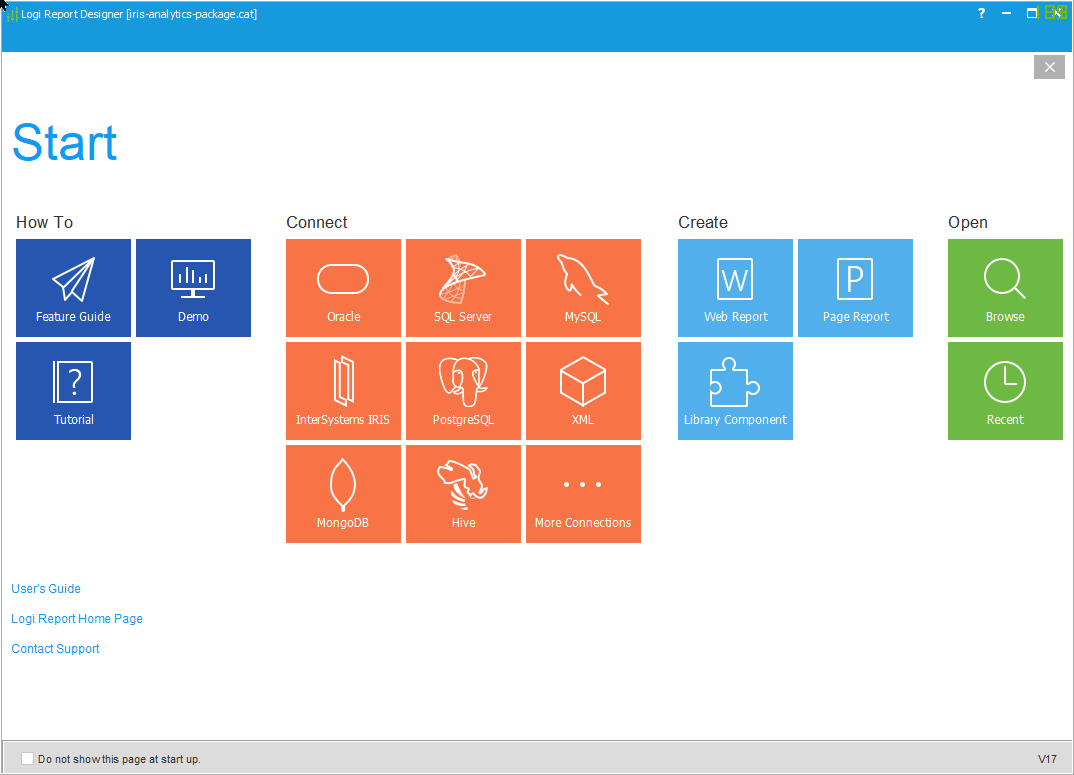
After installing the Logi Report Designer, open and choose the InterSystems IRIS icon.
For the second step, you have the option of choosing an existing Catalog or creating a new one.
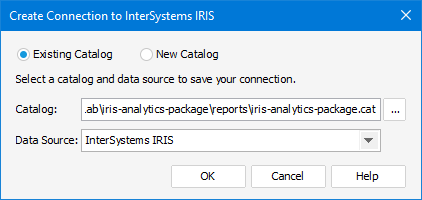
We will create a new catalog, saving it in your chosen folder, then we will create a new DataSource.
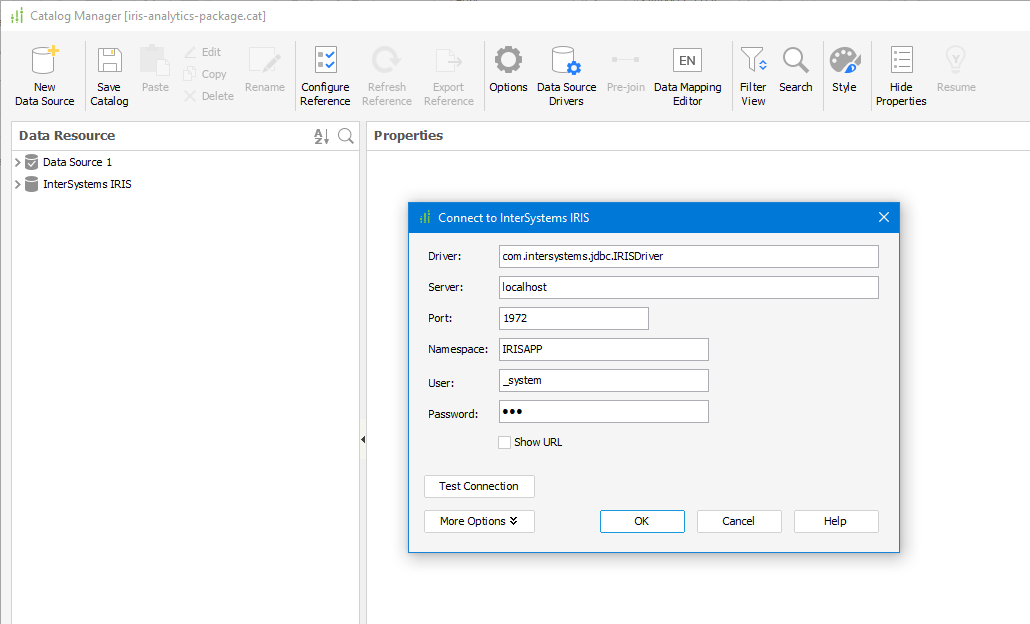
Fill in the fields with the server's IP or DNS name, port, namespace, user, and password.
You can then add tables, views, and queries to your data source.
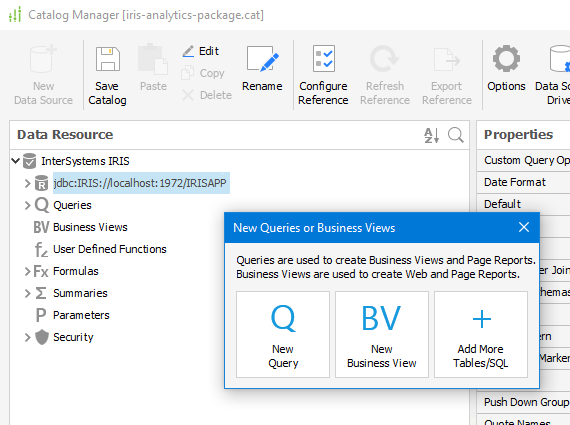
With your connection information, your tables, views, and/or queries configured, let's move on.
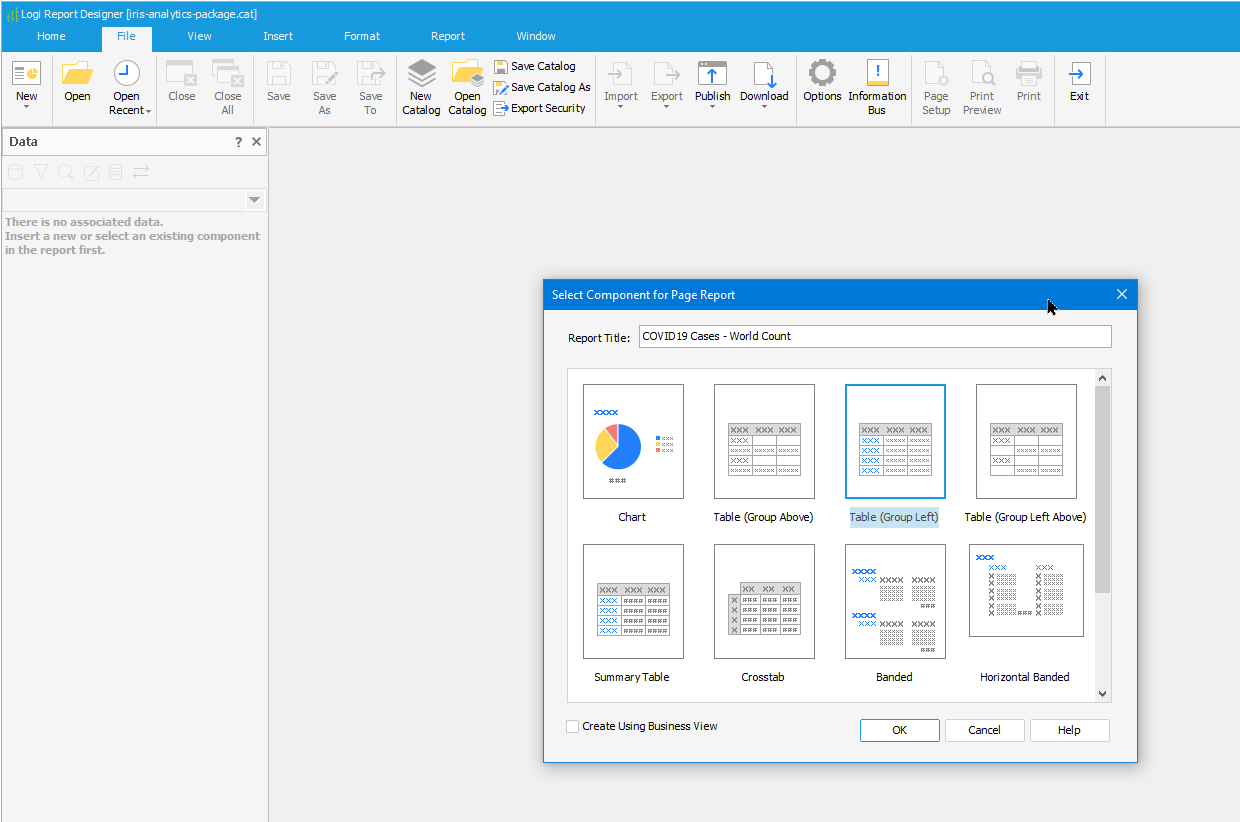
Clicking on the icon New, choose New Report.
For our report, I chose the Table (Group Left) as the image below:
The Table Wizard will guide us by choosing the data source, data display, grouping, summary, chart, filters, and style.
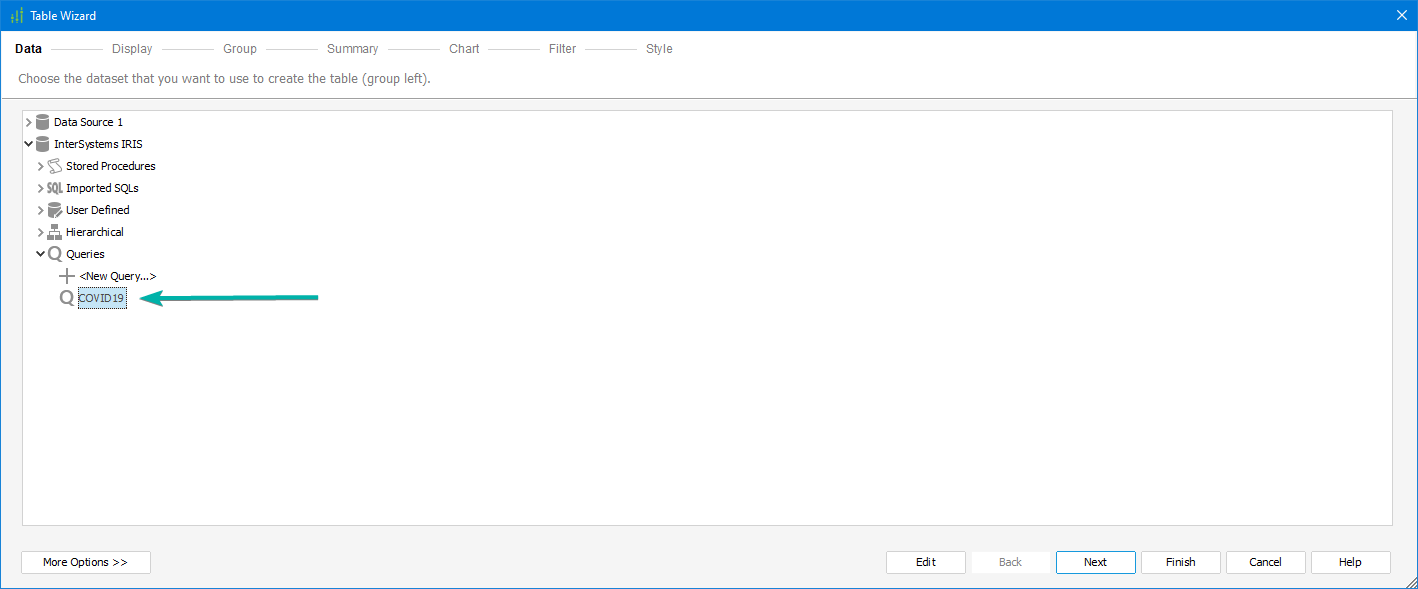
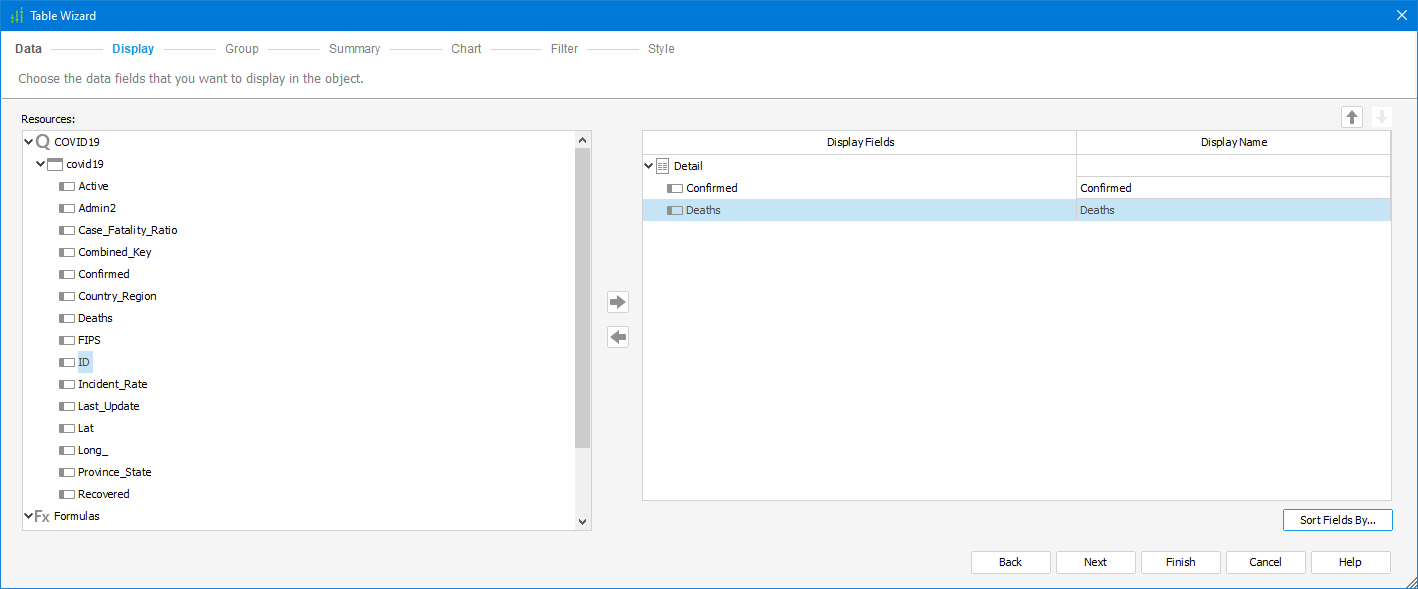
I'm using the covid table that @Evgeny Shvarov created for the iris-analytics-template to my data source on this report sample. The chosen fields are Confirmed and Deaths.
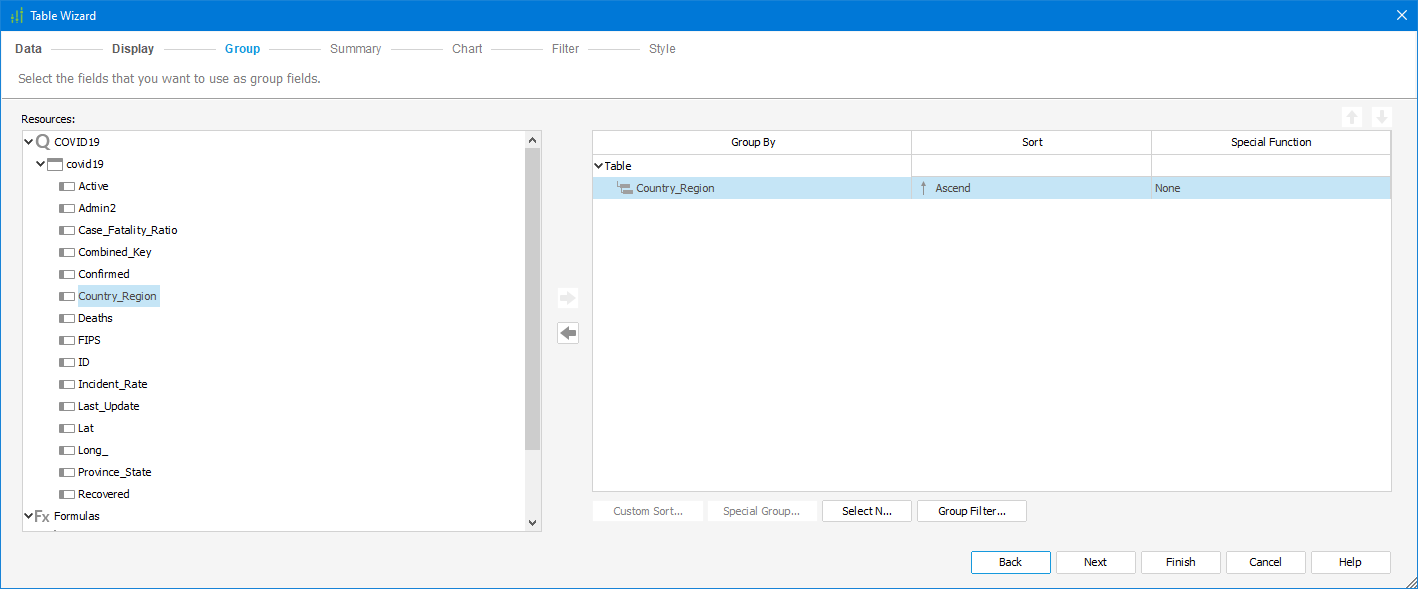
The group for this report will be Contry_Region.
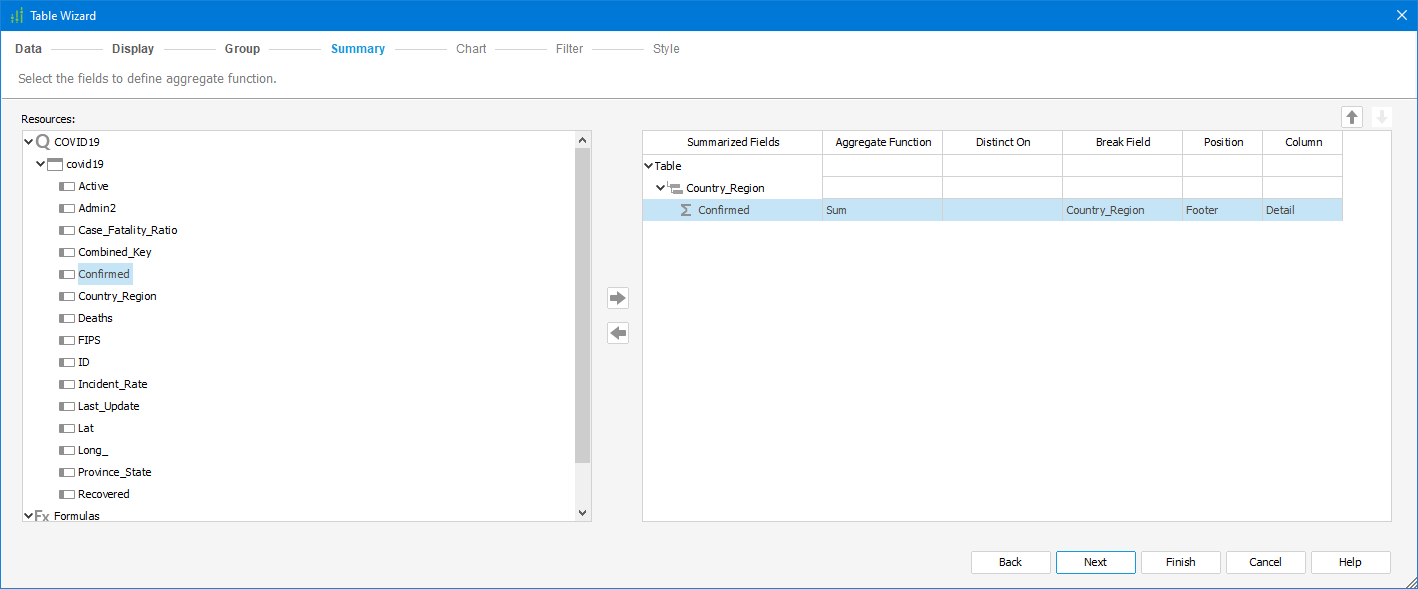
The Summary for Country_Region group will be Confirmed with the Aggregate Function (SUM), the breaking field will be Country_Region in the Footer position.
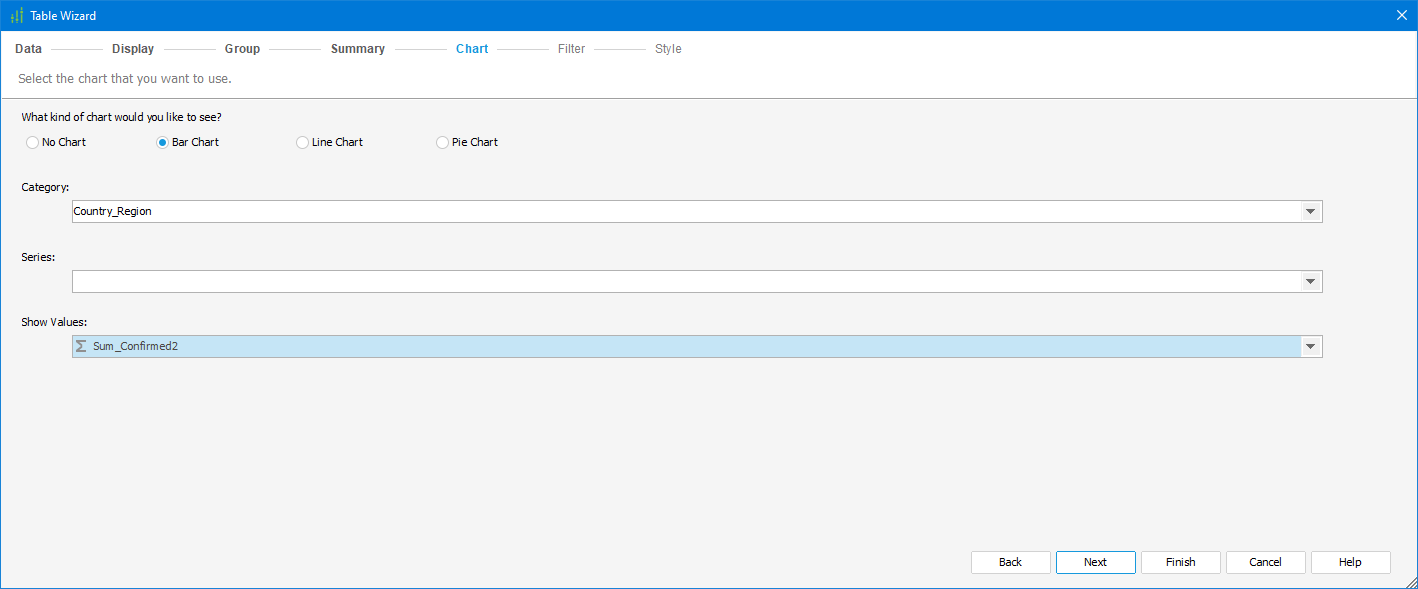
Inside the chart step, I chose the Bar Chart with Country_Region as my Category and showed values for the Confirmed field.
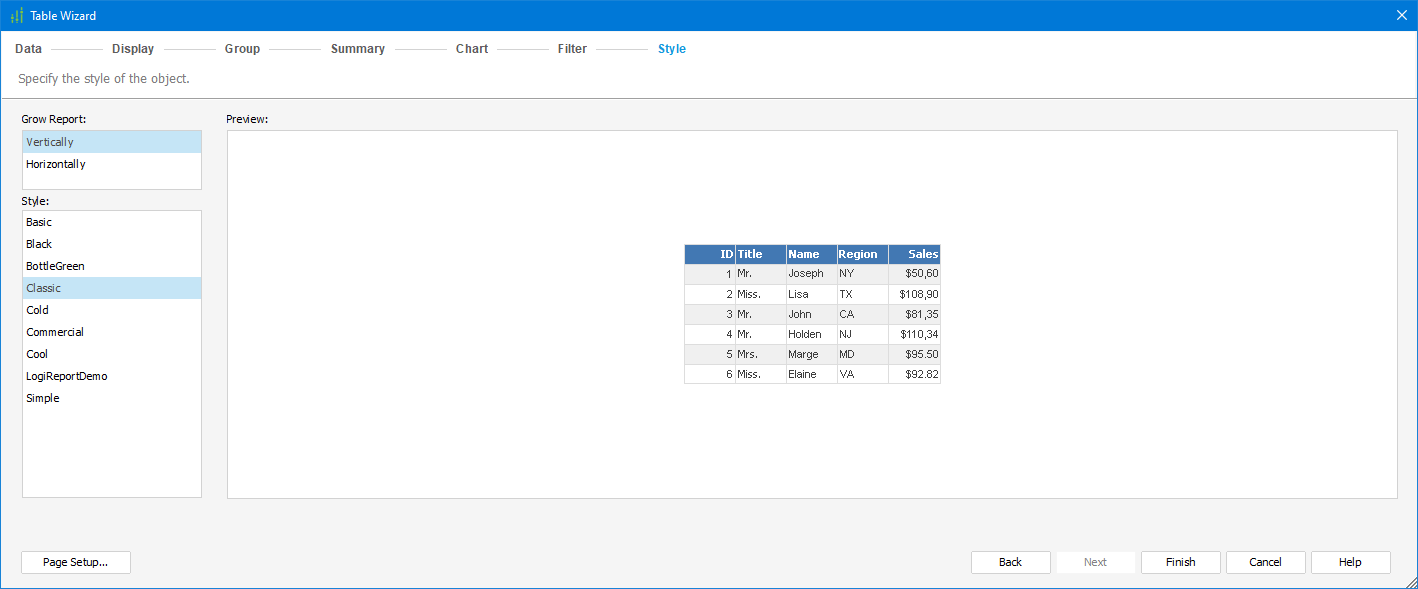
I'm applying one of the pre-existents styles, and the chosen one was "Classic."
The image below shows how the report shows itself after the wizard finish.
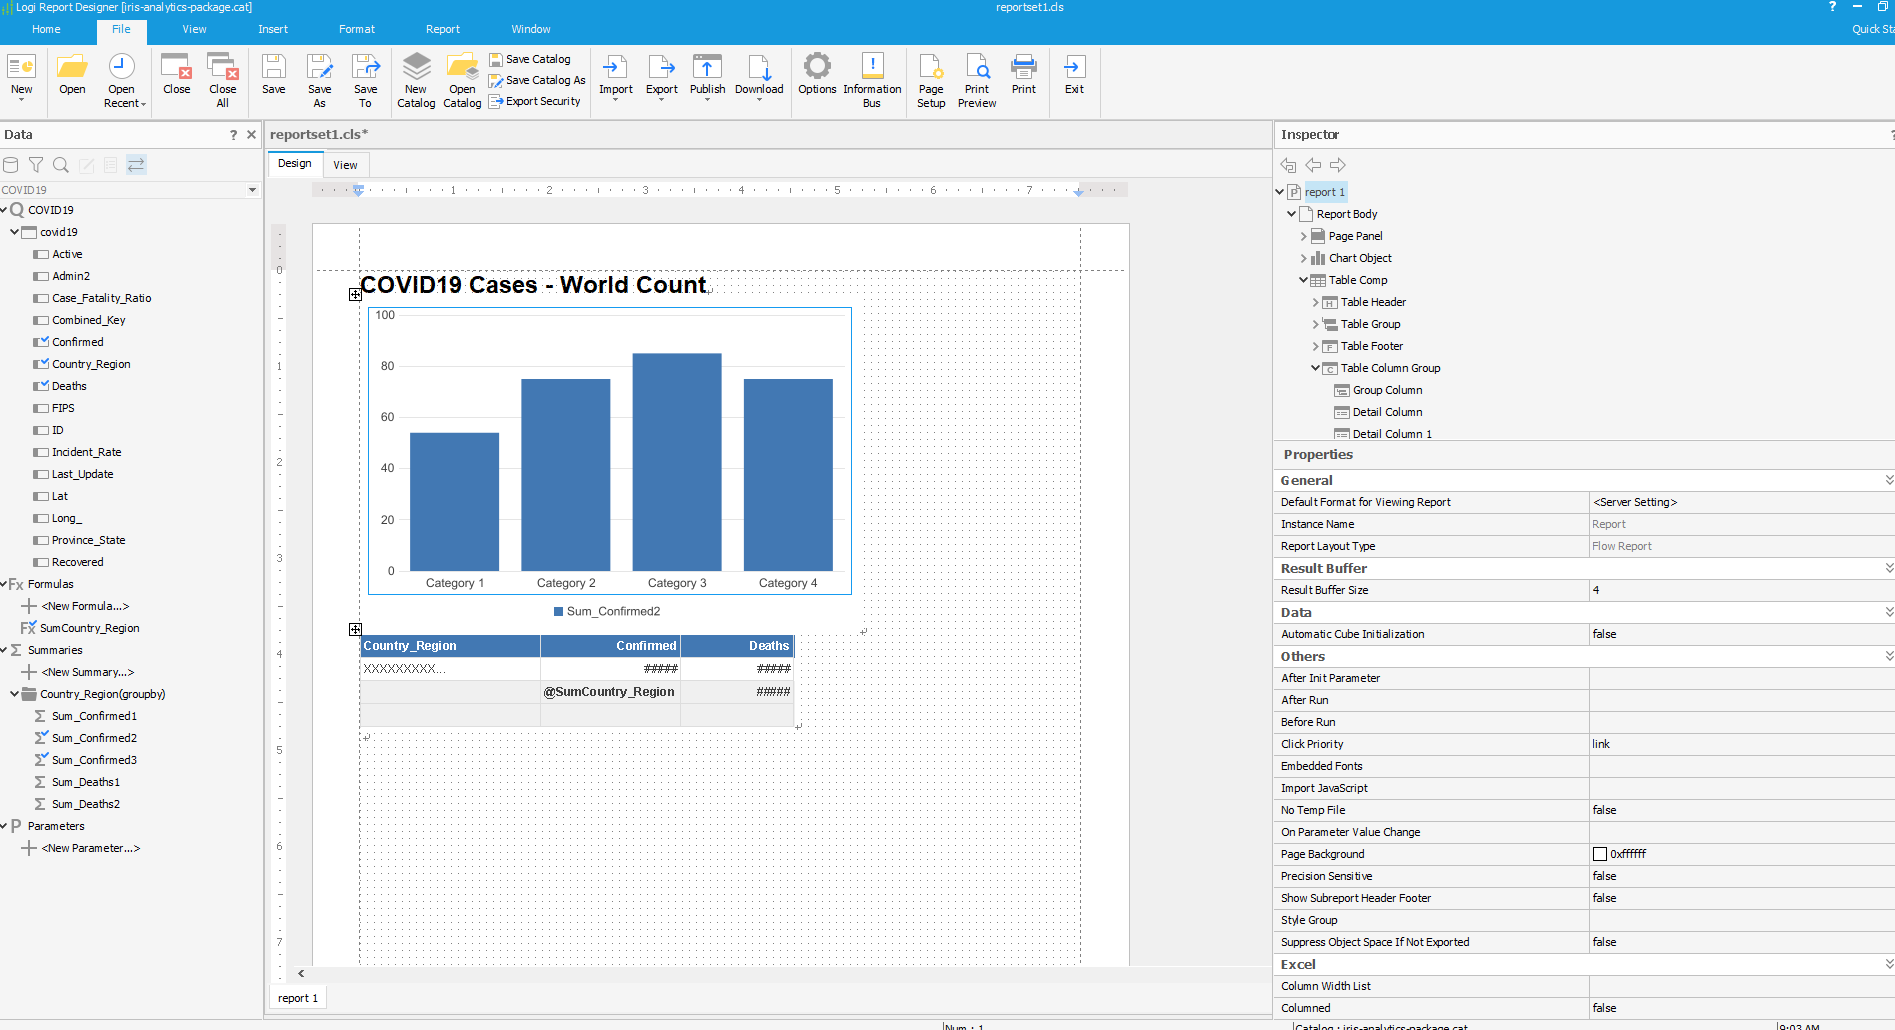
The file covid19_cases_-_WorldCount-Sample.pdf it's a "print sample" of the report.
If you want another simple sample, my repo has the file refugees_CitiesImpacted_ReportSample.pdf
Showing the report for the dataset for the Refugee Admission to the US Ending FY 2018, the dataset is available on Refugee Admission to the US Ending FY 2018 - dataset by associatedpress | data.world
If you liked the app and think I deserve your vote, please vote for iris-analytics-package!