How to configure SAM to monitor containers or local instances ?
Monitoring IRIS through SAM (sam:1.0.0.115)
While I've used to make it work in the past, I'm not able any more to fix the already faced issue : "State: Unreachable"
Despite all the ip-addresses attempts (or hostname = host.docker.internal) and while "/api/monitor/metrics" is running well...
Could someone provide good practices to make it work cleanly ?
Comments
It's not a big issue, to make it work. Just keep in mind that both containers, with SAM and monitored system, have to be in the same docker's network. If you run both images in with docker-compose, they by default will get the same network, so, in most cases, you may use IRIS service's name from docker-compose.yml as a hostname, and it will be able to connect to it internally inside that network.
If you need access from dockerized SAM to a dockerized IRIS, both working in different networks, you have to publish ports for IRIS, so, it should be available from the host, but from the docker, your SAM has to know the host's address and host.docker.internal is a way, to give it to him. And port should be the same as published when docker container is running.
When docker container is started with -p param, which says how to publish the port, possible to say, which IP to select, or select all for instance -p 0.0.0.0:52273:52273
docker ps, may help with understanding how the container is available
8d8977f9d5f8 intersystemsdc/iris-community:preview "/tini -- /iris-main…" 6 days ago Up 3 days (healthy) 0.0.0.0:1972->1972/tcp, 2188/tcp, 53773/tcp, 0.0.0.0:52773->52773/tcp, 54773/tcp iris
if it shows something like 127.0.0.1:52773->52773, it will only be available as localhost or 127.0.0.1 and will not be accessible from another container and network, because of host.docker.internal will refer to another ip
Could you explain, how you running all the parts?
Thanks Dmitry for your reply.
Actually, I know all of this ; that's why I don't understand why it's not working any more...
-
gh repo clone intersystems-community/sam
-
cd sam
-
tar xvzf sam-1.0.0.115-unix.tar.gz
-
cd sam-1.0.0.115-unix
-
./start.sh
Then I create a cluster + a target on my local instance (non-container) :
iris list irishealth

Configuration 'IRISHEALTH'

directory:    /Users/guilbaud/is/irishealth

versionid:    2021.2.0.649.0

datadir:      /Users/guilbaud/is/irishealth

conf file:    iris.cpf  (SuperServer port = 61773, WebServer = 52773)

status:       running, since Fri Feb 25 15:35:32 2022

state:        ok

product:      InterSystems IRISHealth
I check that /api/monitor/metrics runs well :
curl http://127.0.0.1:52773/api/monitor/metrics -o metrics

  % Total    % Received % Xferd  Average Speed   Time    Time     Time  Current

                                 Dload  Upload   Total   Spent    Left  Speed

100 17634  100 17634    0     0  14174      0  0:00:01  0:00:01 --:--:-- 14383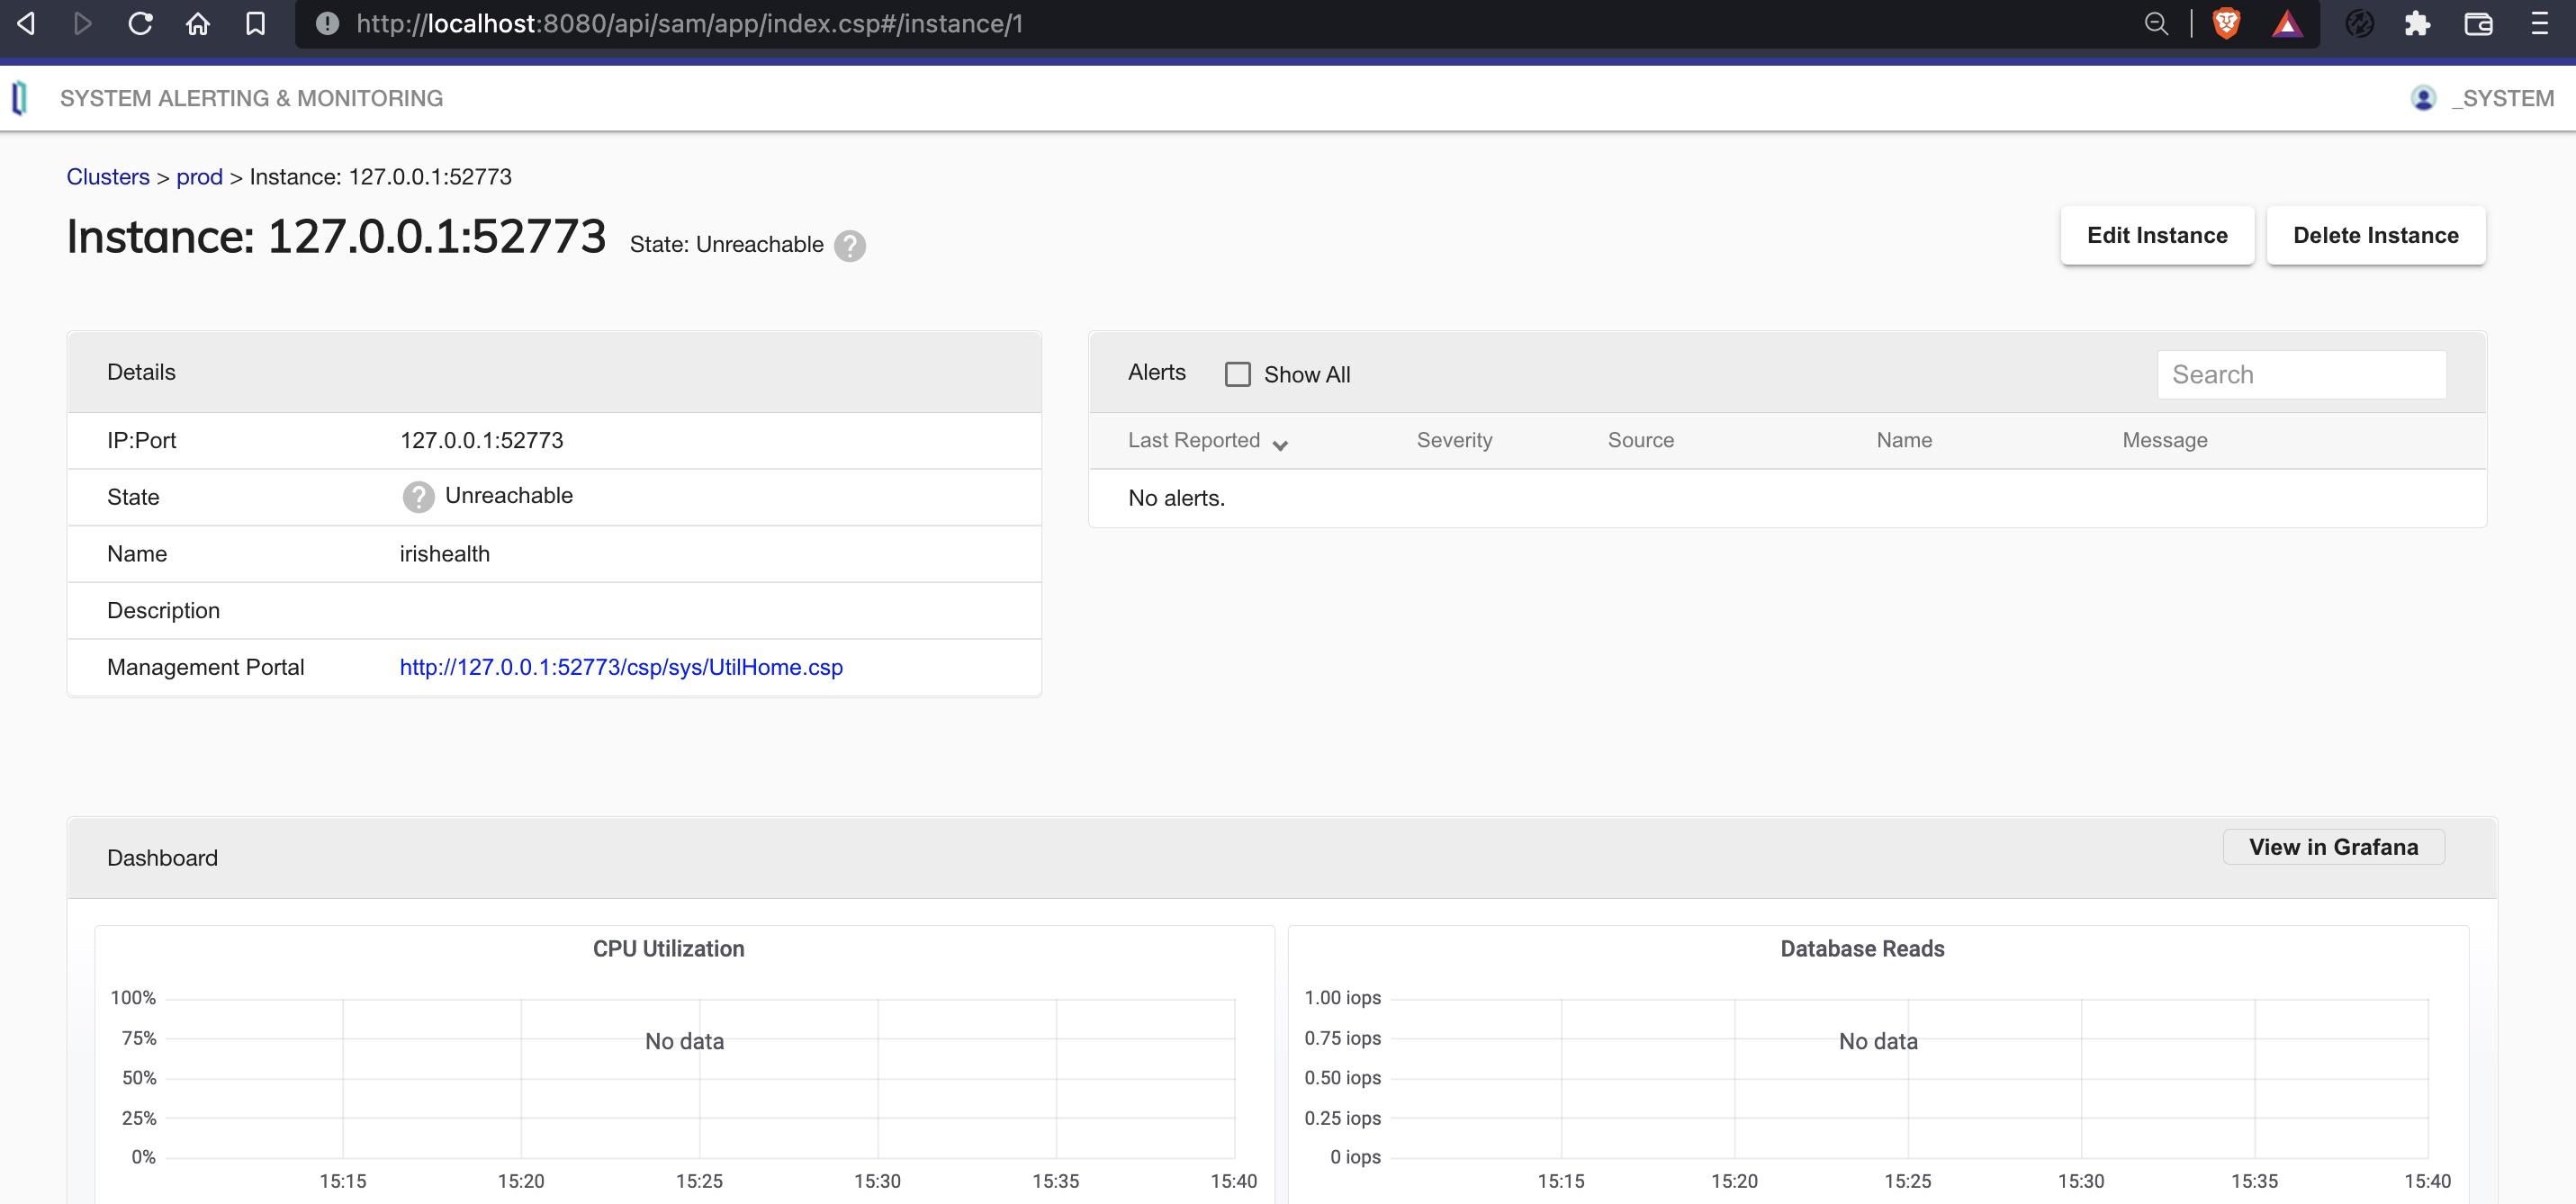
For containers, I'm using docker-compose.
I've tried with SAM in the same yml file to get everything in the same network, but, nothing is working (0.0.0.0, etc.)
127.0.0.1 will not work, due to it's still different host, and in case of this sam bundle, it should point to sam's iris. And will not work it, because, it should be available for prometheus container, not just for IRIS container for sam. So, you have to use, it's name as a host iris
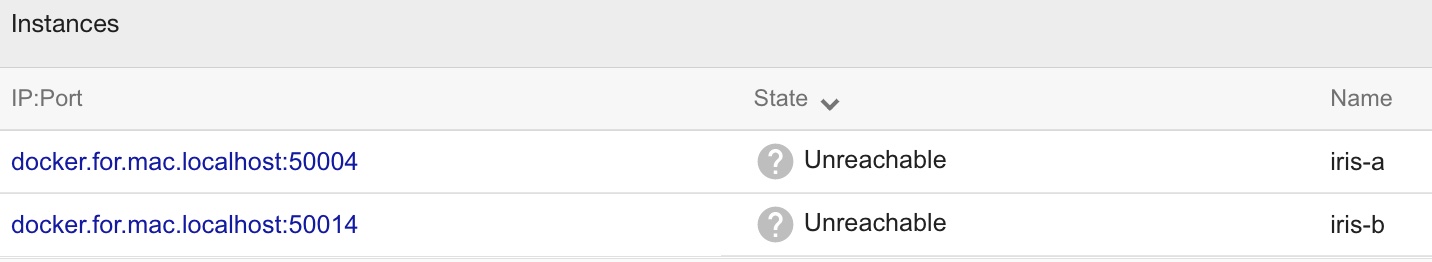
And to access, some IRIS external to docker, you may use host.docker.internal hostname, or docker.for.mac.localhost with Docker on macOS
.png)
So, the first line is points to SAM's IRIS, and second to an IRIS outside
I think host.docker.internal was added in some recent versions of Docker, so, probably check the version of Docker
I'm running the very last version of Docker : 4.5.0 (74594)
docker version
Cloud integration: v1.0.22
Version: 20.10.12
API version: 1.41
Go version: go1.16.12
Git commit: e91ed57
Built: Mon Dec 13 11:46:56 2021
OS/Arch: darwin/amd64
Context: default
Experimental: true
Server: Docker Desktop 4.5.0 (74594)
Engine:
Version: 20.10.12
API version: 1.41 (minimum version 1.12)
Go version: go1.16.12
Git commit: 459d0df
Built: Mon Dec 13 11:43:56 2021
OS/Arch: linux/amd64
Experimental: true
containerd:
Version: 1.4.12
GitCommit: 7b11cfaabd73bb80907dd23182b9347b4245eb5d
runc:
Version: 1.0.2
GitCommit: v1.0.2-0-g52b36a2
docker-init:
Version: 0.19.0
GitCommit: de40ad0
docker.for.mac.localhost : same result
Same result with host.docker.internal :

.png)
So, host.docker.internal is 192.168.65.2 and it's the same network as in settings, but this IP is used to get access from the virtual docker's environment
.png)
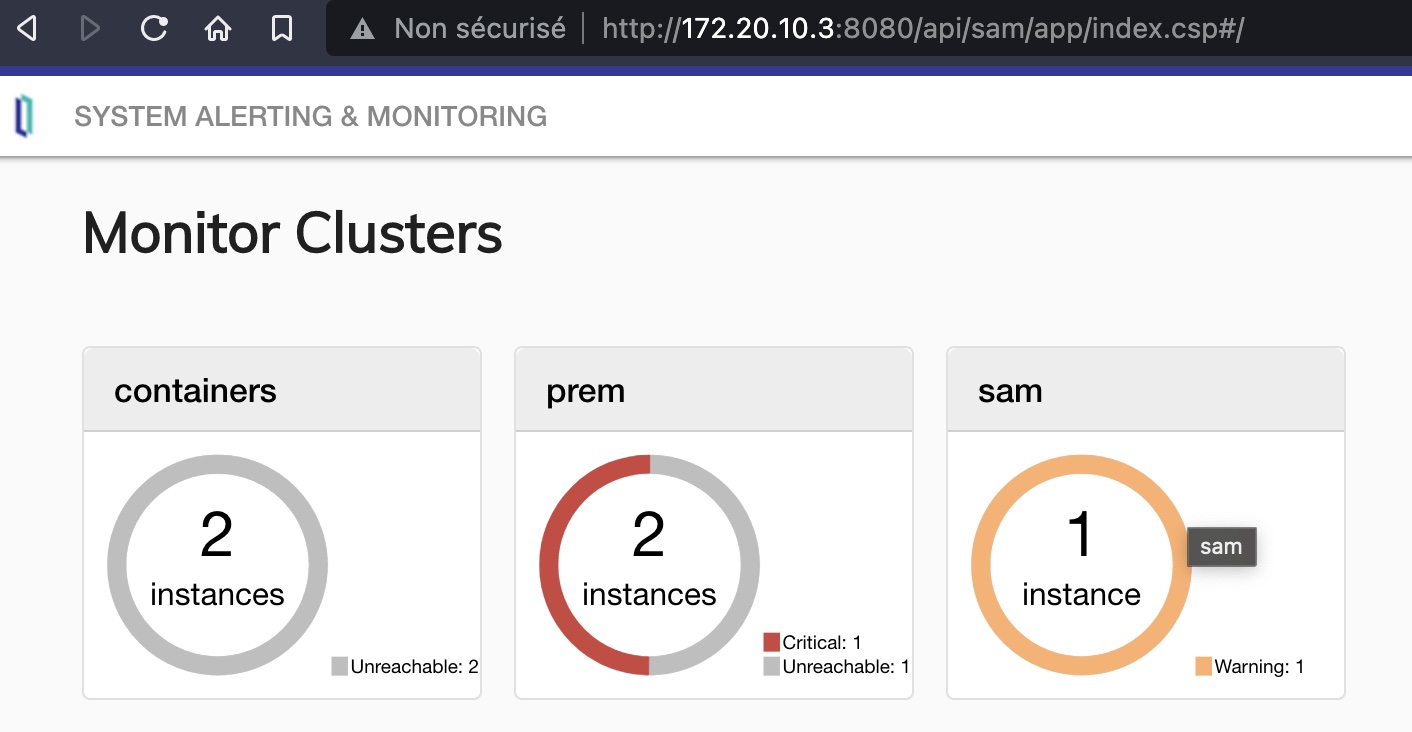
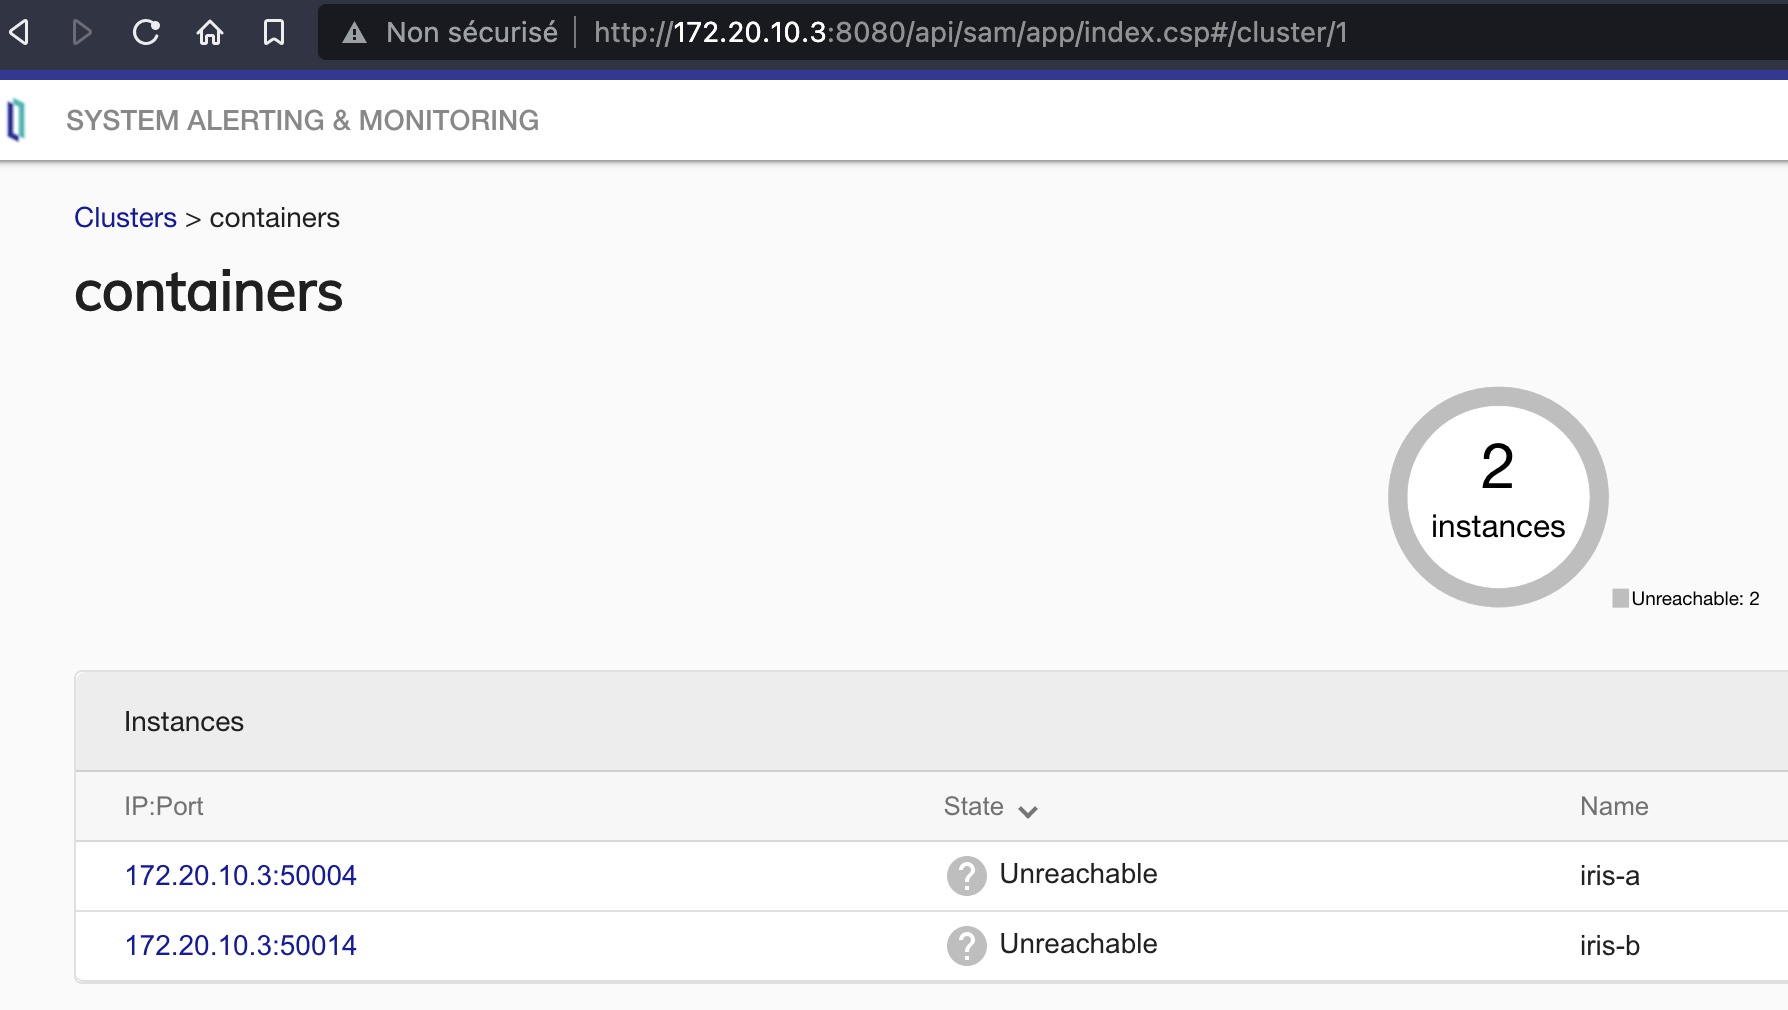
Could you try to use one of your real host's IP, which comes from Wi-Fi for instance
my wifi gives me IP 192.168.1.170, and it works
.png)
ping and wget works well from SAM containers (tested from prometheus or nginx containers) ; I'm able to reach each IRIS instances (containers and non-containers).
But from the SAM UI, I'm still facing unreachable errors.
Maybe prometheus logs, have something that may help
docker logs sam-prometheus-1

level=info ts=2022-02-28T16:14:51.209Z caller=main.go:333 msg="Starting Prometheus" version="(version=2.17.1, branch=HEAD, revision=ae041f97cfc6f43494bed65ec4ea4e3a0cf2ac69)"

level=info ts=2022-02-28T16:14:51.210Z caller=main.go:334 build_context="(go=go1.13.9, user=root@806b02dfe114, date=20200326-16:18:19)"

level=info ts=2022-02-28T16:14:51.210Z caller=main.go:335 host_details="(Linux 5.10.76-linuxkit #1 SMP Mon Nov 8 10:21:19 UTC 2021 x86_64 aa300025820c (none))"

level=info ts=2022-02-28T16:14:51.210Z caller=main.go:336 fd_limits="(soft=1048576, hard=1048576)"

level=info ts=2022-02-28T16:14:51.210Z caller=main.go:337 vm_limits="(soft=unlimited, hard=unlimited)"

level=info ts=2022-02-28T16:14:51.215Z caller=web.go:514 component=web msg="Start listening for connections" address=0.0.0.0:9090

level=info ts=2022-02-28T16:14:51.214Z caller=main.go:667 msg="Starting TSDB ..."

level=info ts=2022-02-28T16:14:51.225Z caller=head.go:575 component=tsdb msg="replaying WAL, this may take awhile"

level=info ts=2022-02-28T16:14:51.227Z caller=head.go:624 component=tsdb msg="WAL segment loaded" segment=0 maxSegment=0

level=info ts=2022-02-28T16:14:51.227Z caller=head.go:627 component=tsdb msg="WAL replay completed" duration=1.4381ms

level=info ts=2022-02-28T16:14:51.228Z caller=main.go:683 fs_type=EXT4_SUPER_MAGIC

level=info ts=2022-02-28T16:14:51.228Z caller=main.go:684 msg="TSDB started"

level=info ts=2022-02-28T16:14:51.228Z caller=main.go:788 msg="Loading configuration file" filename=/config/isc_prometheus.yml

ts=2022-02-28T16:14:51.234Z caller=dedupe.go:112 component=remote level=info remote_name=43bf89 url=http://iris:52773/api/sam/private/db/write msg="starting WAL watcher" queue=43bf89

ts=2022-02-28T16:14:51.234Z caller=dedupe.go:112 component=remote level=info remote_name=43bf89 url=http://iris:52773/api/sam/private/db/write msg="replaying WAL" queue=43bf89

level=info ts=2022-02-28T16:14:51.239Z caller=main.go:816 msg="Completed loading of configuration file" filename=/config/isc_prometheus.yml

level=info ts=2022-02-28T16:14:51.239Z caller=main.go:635 msg="Server is ready to receive web requests."

ts=2022-02-28T16:14:59.846Z caller=dedupe.go:112 component=remote level=info remote_name=43bf89 url=http://iris:52773/api/sam/private/db/write msg="done replaying WAL" duration=8.6116179s

level=info ts=2022-02-28T16:36:46.583Z caller=main.go:788 msg="Loading configuration file" filename=/config/isc_prometheus.yml

level=info ts=2022-02-28T16:36:46.592Z caller=main.go:816 msg="Completed loading of configuration file" filename=/config/isc_prometheus.yml

level=info ts=2022-02-28T16:37:14.966Z caller=main.go:788 msg="Loading configuration file" filename=/config/isc_prometheus.yml

level=info ts=2022-02-28T16:37:14.974Z caller=main.go:816 msg="Completed loading of configuration file" filename=/config/isc_prometheus.yml

level=info ts=2022-02-28T16:37:37.074Z caller=main.go:788 msg="Loading configuration file" filename=/config/isc_prometheus.yml

level=info ts=2022-02-28T16:37:37.081Z caller=main.go:816 msg="Completed loading of configuration file" filename=/config/isc_prometheus.yml

level=info ts=2022-02-28T16:37:53.001Z caller=main.go:788 msg="Loading configuration file" filename=/config/isc_prometheus.yml

level=info ts=2022-02-28T16:37:53.007Z caller=main.go:816 msg="Completed loading of configuration file" filename=/config/isc_prometheus.yml
docker exec -ti -u root sam-prometheus-1 sh

/prometheus # wget http://172.20.10.3:50004/api/monitor/metrics -O iris-a-metrics

Connecting to 172.20.10.3:50004 (172.20.10.3:50004)

saving to 'iris-a-metrics'

iris-a-metrics       100% |*************************************************************************************************|  8584  0:00:00 ETA

'iris-a-metrics' saved

/prometheus # wget http://172.20.10.3:50014/api/monitor/metrics -O iris-b-metrics

Connecting to 172.20.10.3:50014 (172.20.10.3:50014)

saving to 'iris-b-metrics'

iris-b-metrics       100% |*************************************************************************************************|  7901  0:00:00 ETA

'iris-b-metrics' saved

/prometheus # wget http://172.20.10.3:52773/api/monitor/metrics -O iris-health-metrics

Connecting to 172.20.10.3:52773 (172.20.10.3:52773)

saving to 'iris-health-metrics'

iris-health-metrics  100% |*************************************************************************************************| 24567  0:00:00 ETA

'iris-health-metrics' saved

/prometheus # wget http://172.20.10.3:52774/api/monitor/metrics -O iris-metrics

Connecting to 172.20.10.3:52774 (172.20.10.3:52774)

saving to 'iris-metrics'

iris-metrics         100% |*************************************************************************************************|  6110  0:00:00 ETA

'iris-metrics' saved
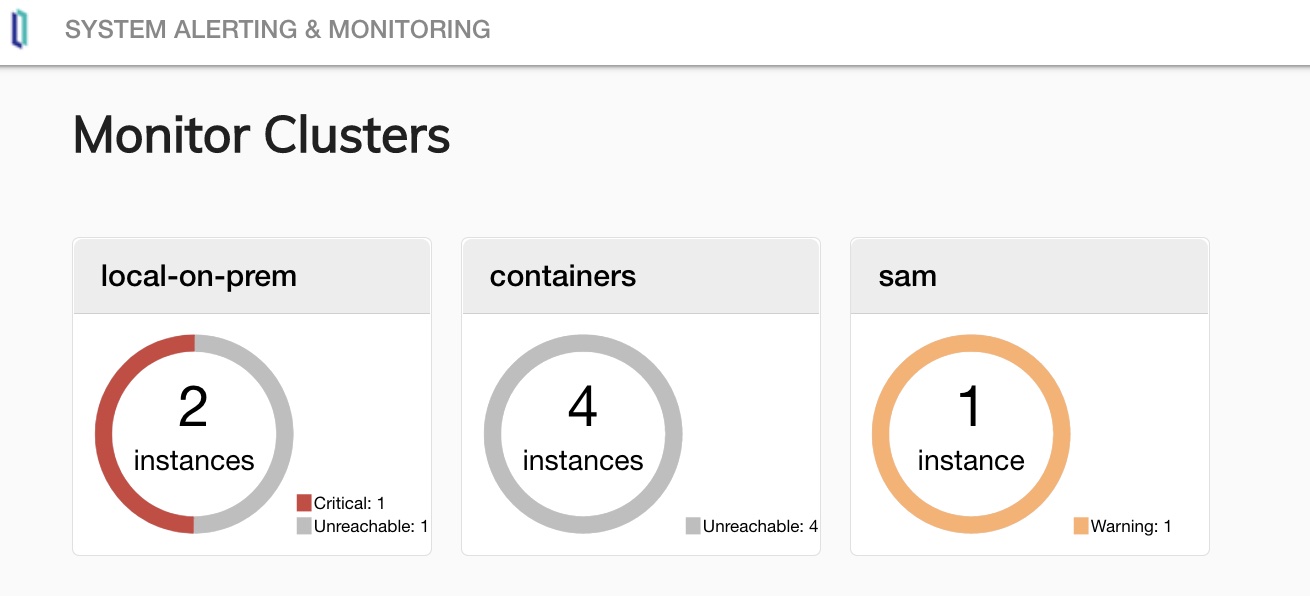
After a reboot I'm now again able to reach 1 local instance (out of 2) and 0 containers + the IRIS-SAM instance.
docker-compose.yml
networks:
dockernet:
ipam:
driver: default
config:
- subnet: 172.19.0.0/24
services:
arbiter:
image: containers.intersystems.com/intersystems/arbiter:2022.1.0.131.0
init: true
command:
- /usr/local/etc/irissys/startISCAgent.sh 2188
hostname: arbiter
container_name: arbiter
ports:
- 50100:2188
networks:
dockernet:
ipv4_address: 172.19.0.100
iris-a:
init: true
build:
context: .
image: iris:2022.1.0.114.0
hostname: iris-a
container_name: iris-a
environment:
- ISC_DATA_DIRECTORY=/InterSystems
volumes:
- ./data:/data
- ./volumes/InterSystems:/InterSystems
- ./keys/iris.key:/usr/irissys/mgr/iris.key
ports:
- 50004:52773
- 50005:1972
networks:
dockernet:
ipv4_address: 172.19.0.10
iris-b:
init: true
build:
context: .
image: iris:2022.1.0.114.0
hostname: iris-b
container_name: iris-b
environment:
- ISC_DATA_DIRECTORY=/InterSystems
volumes:
- ./data:/data
- ./volumes/InterSystems-b:/InterSystems
- ./keys/iris.key:/usr/irissys/mgr/iris.key
ports:
- 50014:52773
- 50015:1972
networks:
dockernet:
ipv4_address: 172.19.0.20
webgateway:
hostname: webgateway
container_name: webgateway
depends_on:
- iris-a
- iris-b
- arbiter
image: containers.intersystems.com/intersystems/webgateway:2022.1.0.131.0
ports:
- 50243:443
- 50200:80
environment:
- ISC_DATA_DIRECTORY=/webgateway
- IRIS_USER=CSPsystem
- IRIS_PASSWORD=SYS
networks:
dockernet:
ipv4_address: 172.19.0.200
volumes:
- "./volumes/webgateway:/webgateway"
postgres:
container_name: postgres
image: postgres:13.4-alpine3.14
environment:
POSTGRES_PASSWORD: postgres
volumes:
- ./src/sql/postgreSQL:/docker-entrypoint-initdb.d/
- ./volumes/postgreSQL:/var/lib/postgresql/data
ports:
- 50006:5432
restart: unless-stopped
healthcheck:
test: ["CMD", "pg_isready", "-U", "postgres"]
interval: 30s
timeout: 30s
retries: 3
networks:
dockernet:
ipv4_address: 172.19.0.11
mssql:
container_name: mssql
image: 'mcr.microsoft.com/mssql/server:2019-latest'
ports:
- '50007:1433'
environment:
- ACCEPT_EULA=Y
- SA_PASSWORD=Secret1234
volumes:
- './volumes/mssql:/var/opt/mssql'
networks:
dockernet:
ipv4_address: 172.19.0.12
sam-alertmanager:
container_name: sam-alertmanager
command:
- --config.file=/config/isc_alertmanager.yml
- --data.retention=24h
- --cluster.listen-address=
depends_on:
- sam-iris
- sam-prometheus
expose:
- '9093'
image: prom/alertmanager:v0.20.0
restart: on-failure
volumes:
- ./sam/config/alertmanager:/config
networks:
- dockernet
sam-grafana:
container_name: sam-grafana
depends_on:
- sam-prometheus
expose:
- '3000'
image: grafana/grafana:6.7.1
restart: on-failure
volumes:
- ./sam/data/grafana:/var/lib/grafana
- ./sam/config/grafana/grafana.ini:/etc/grafana/grafana.ini
- ./sam/config/grafana/datasource.yml:/etc/grafana/provisioning/datasources/datasource.yml
- ./sam/config/grafana/dashboard-provider.yml:/etc/grafana/provisioning/dashboards/dashboard-provider.yml
- ./sam/config/grafana/dashboard.json:/var/lib/grafana/dashboards/dashboard.json
networks:
- dockernet
sam-iris:
container_name: sam-iris
environment:
- ISC_DATA_DIRECTORY=/dur/iconfig
expose:
- '51773'
- '52773'
hostname: IRIS
image: store/intersystems/sam:1.0.0.115
init: true
restart: on-failure
volumes:
- ./sam/data/iris:/dur
- ./sam/config:/config
networks:
- dockernet
sam-nginx:
container_name: sam-nginx
depends_on:
- sam-iris
- sam-prometheus
- sam-grafana
image: nginx:1.17.9-alpine
ports:
- 8080:8080
restart: on-failure
volumes:
- ./sam/config/nginx/nginx.conf:/etc/nginx/nginx.conf
networks:
- dockernet
sam-prometheus:
container_name: sam-prometheus
command:
- --web.enable-lifecycle
- --config.file=/config/isc_prometheus.yml
- --storage.tsdb.retention.time=2h
networks:
- dockernet
depends_on:
- sam-iris
expose:
- '9090'
image: prom/prometheus:v2.17.1
restart: on-failure
volumes:
- ./sam/config/prometheus:/config
# openldap:
# image: bitnami/openldap:2
# ports:
# - '50008:1389'
# - '50009:1636'
# environment:
# - LDAP_ADMIN_USERNAME=admin
# - LDAP_ADMIN_PASSWORD=adminpassword
# - LDAP_USERS=user01,user02
# - LDAP_PASSWORDS=password1,password2
# volumes:
# - ./volumes/openldap_data:/bitnami/openldap
# networks:
# dockernet:
# ipv4_address: 172.19.0.172
docker ps
docker ps

CONTAINER ID   IMAGE                                                                COMMAND                  CREATED              STATUS                                 PORTS                                                                               NAMES

5ee1a03673cb   nginx:1.17.9-alpine                                                  "nginx -g 'daemon of…"   About a minute ago   Up About a minute                      80/tcp, 0.0.0.0:8080->8080/tcp                                                      sam-nginx

cce6e64a4fd6   grafana/grafana:6.7.1                                                "/run.sh"                About a minute ago   Up About a minute                      3000/tcp                                                                            sam-grafana

bbadfa5c326e   prom/alertmanager:v0.20.0                                            "/bin/alertmanager -…"   About a minute ago   Up About a minute                      9093/tcp                                                                            sam-alertmanager

89df4b965a3b   containers.intersystems.com/intersystems/webgateway:2022.1.0.131.0   "/startWebGateway"       About a minute ago   Up About a minute (healthy)            0.0.0.0:50200->80/tcp, 0.0.0.0:50243->443/tcp                                       webgateway

260b51880b60   prom/prometheus:v2.17.1                                              "/bin/prometheus --w…"   About a minute ago   Up About a minute                      9090/tcp                                                                            sam-prometheus

961b84b9ff4a   iris:2022.1.0.114.0                                                  "/iris-main"             About a minute ago   Up About a minute (health: starting)   2188/tcp, 53773/tcp, 54773/tcp, 0.0.0.0:50015->1972/tcp, 0.0.0.0:50014->52773/tcp   iris-b

b0c23098794a   postgres:13.4-alpine3.14                                             "docker-entrypoint.s…"   About a minute ago   Up About a minute (healthy)            0.0.0.0:50006->5432/tcp                                                             postgres

4cb33c8c36e3   store/intersystems/sam:1.0.0.115                                     "/iris-main"             About a minute ago   Up About a minute (healthy)            2188/tcp, 51773/tcp, 52773/tcp, 53773/tcp, 54773/tcp                                sam-iris

54e117a4e856   iris:2022.1.0.114.0                                                  "/iris-main"             About a minute ago   Up About a minute (healthy)            2188/tcp, 53773/tcp, 54773/tcp, 0.0.0.0:50005->1972/tcp, 0.0.0.0:50004->52773/tcp   iris-a

2c5133d95693   containers.intersystems.com/intersystems/arbiter:2022.1.0.131.0      "/arbiterEntryPoint.…"   About a minute ago   Up About a minute (healthy)            0.0.0.0:50100->2188/tcp                                                             arbiter

307e59e12fdc   mcr.microsoft.com/mssql/server:2019-latest                           "/opt/mssql/bin/perm…"   About a minute ago   Up About a minute                      0.0.0.0:50007->1433/tcp                                                             mssql
isc_prometheus.yml