Basics of using ANALYZER: Effective data management and analysis in the InterSystems IRIS Data Platform
In today's digital age, effective data management and accurate information analysis are becoming essential for successful enterprise operations. InterSystems IRIS Data Platform offers two critical tools, ARCHITECT and ANALYZER, developed to deliver convenient data management.
ANALYZER is a powerful tool available within the InterSystems IRIS platform to provide extensive data analysis and visualization capabilities. This tool allows users to create summary tables and charts to analyze data. It also lets you perform detailed studies and analyses based on available data.
One of the most significant features of ANALYZER is the ability to select the data subject area before starting the analysis. It ensures accurate and targeted data analysis, as the user can pick a specific data subject area from which to extract the required data for analysis.
ANALYZER features an intuitive interface and extensive customization options, making the data analysis process more flexible and efficient. Built-in autocomplete and preview functions greatly simplify the creation of analytical reports and improve data visualization.
Completing summary tables and charts in ANALYZER allows users to visualize data clearly and informatively, streamlining informed business decision-making and identifying critical trends and patterns in the data.
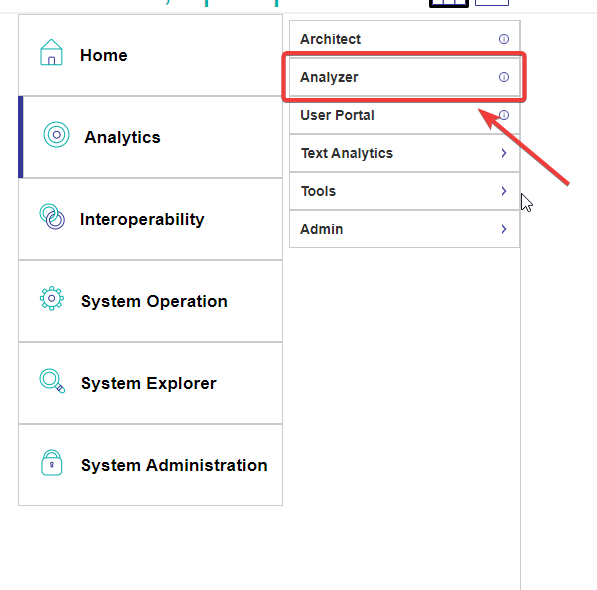
To start working with ANALYZER, proceed to the Management Portal page within the InterSystems IRIS platform. Once there, select the Analytics tab and then navigate to the Analyzer section. This step allows users to access a powerful data analysis tool that provides a wide range of features for data exploration and visualization.
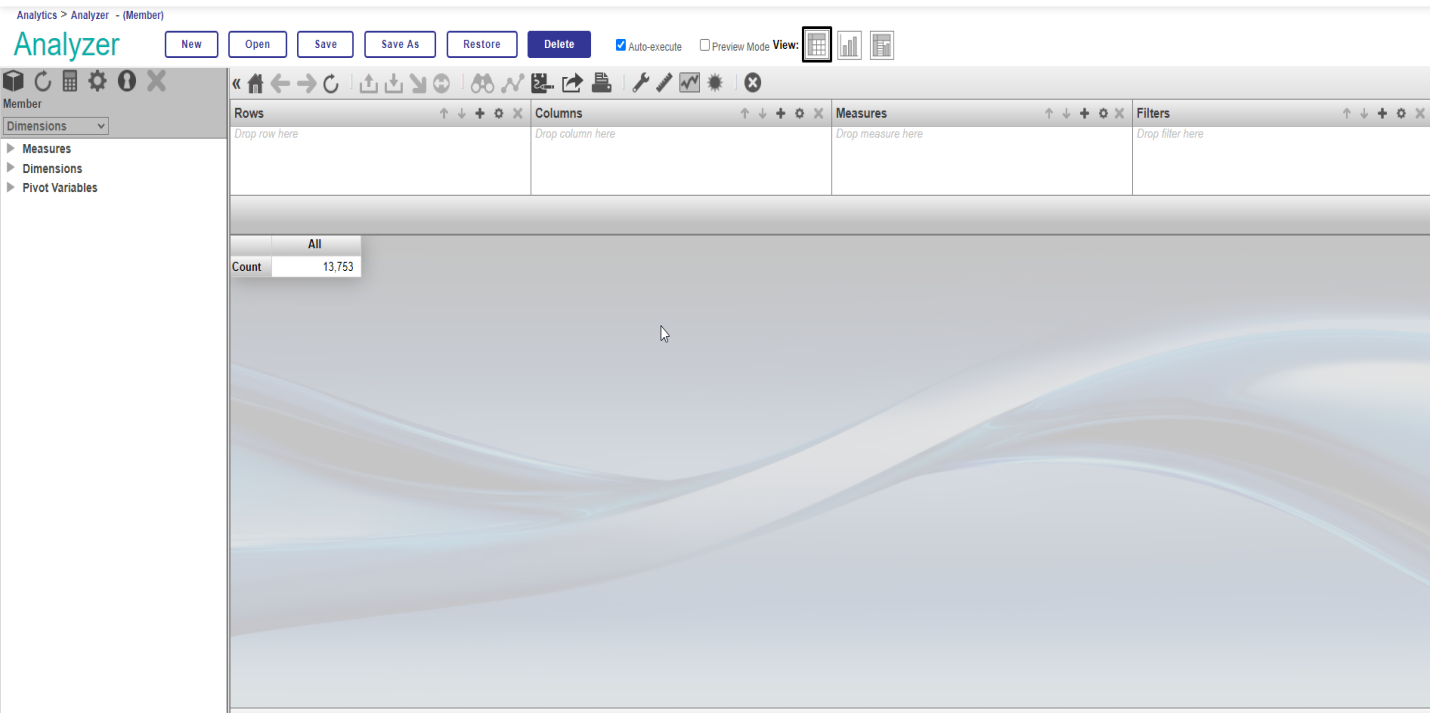
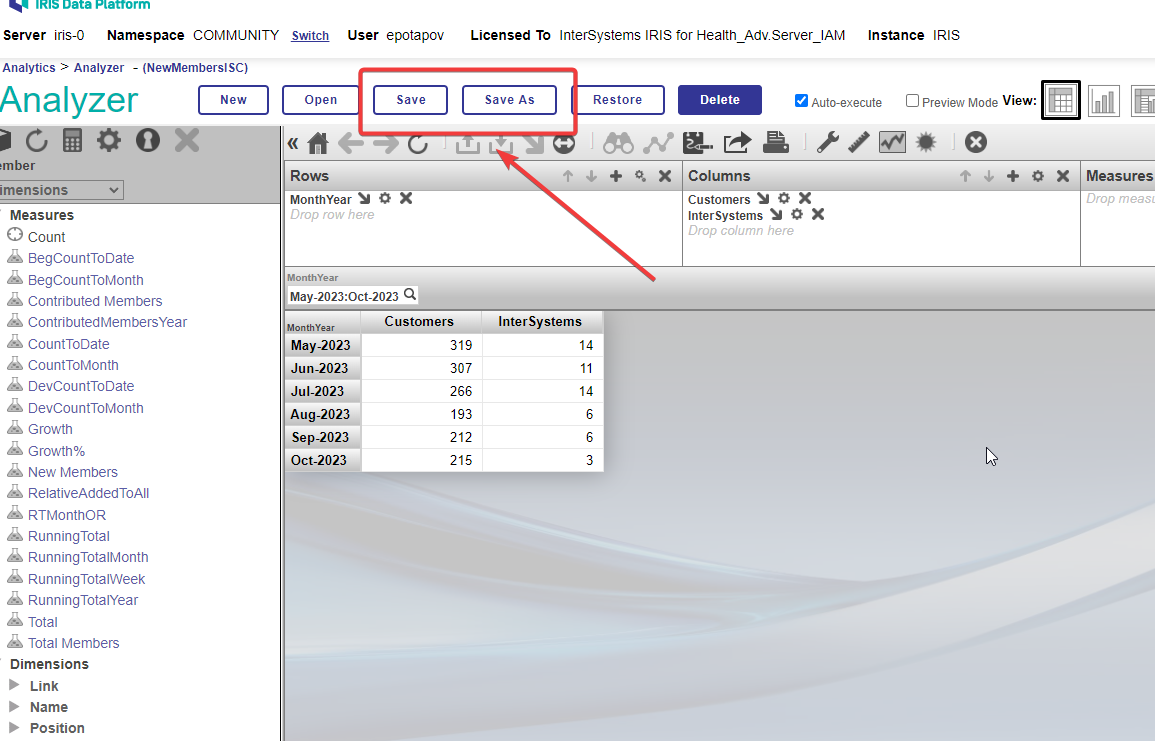
Visiting the ANALYZER page opens up a wide range of options for data analysis and visualization. Here are some of the main functions and elements available on this page:
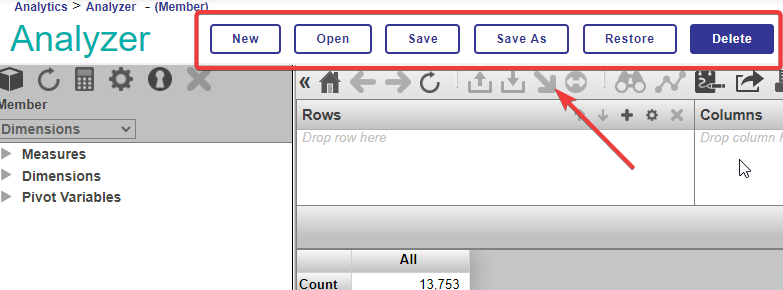
New / Open / Save / Save / Save As / Restore / Delete: These options enable you to create analysis projects, open existing ones, save current results, restore previous versions, and delete irrelevant data.
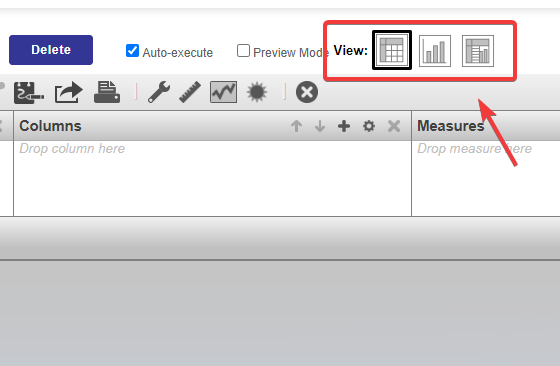
Auto-execute / Preview Mode: These functions allow you to automate tasks and view data in an easy-to-analyze format.
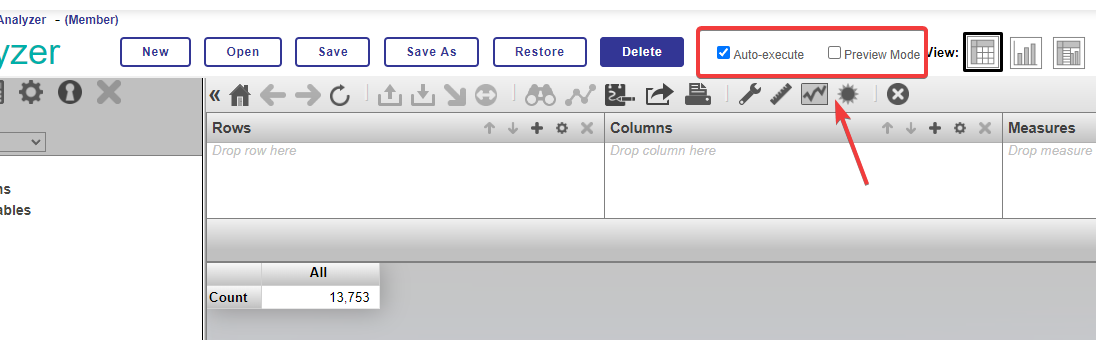
View: Users can choose between different data display options, such as a summary table, chart, or a combination of both, for more complete data analysis.
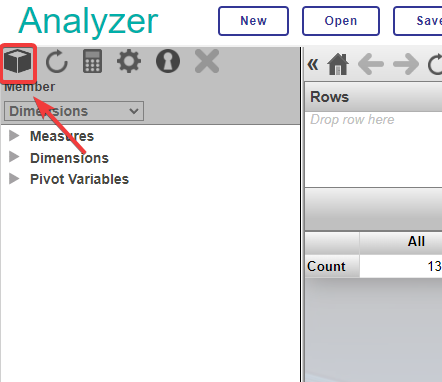
Change to a different Subject Area: This option allows users to select specific data subject areas from which to extract data for analysis.
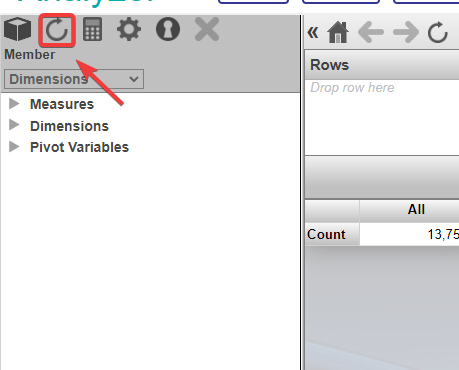
Refresh and reset the contents of the dimension tree: This function ensures that the content of the dimension tree is refreshed and reset for accurate and up-to-date data analysis.
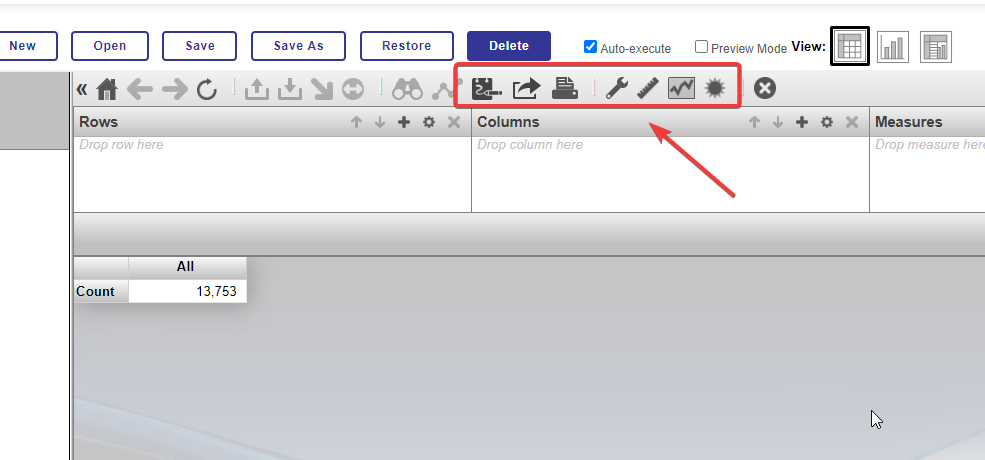
Add or edit a calculated member / Add or edit a named filter for this Subject Area / Add or edit a pivot variable for this Subject Area: These functions let users add and customize various parameters and elements for more precise data analysis.
Export current results / Export current results to printable PDF format: Users can export existing analysis results for further use in reports or presentations.
Set options for the pivot table / Configure PDF export for this pivot / Modify chart appearance / Define conditional formatting rules: These functions provide extensive customization and data visualization options for a more understandable and explicit analysis.
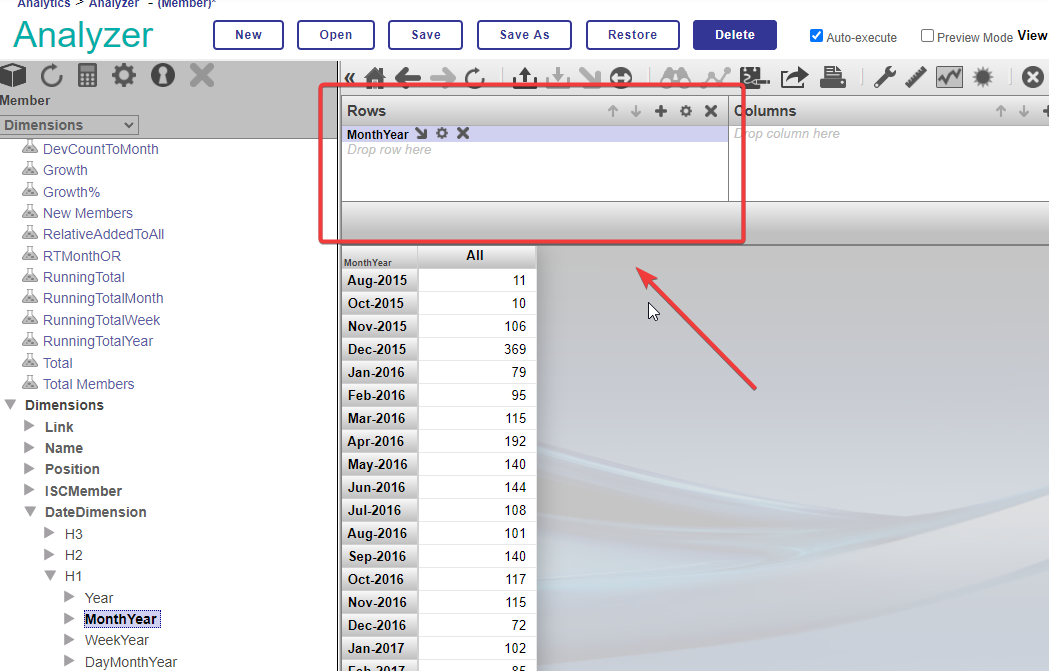
Now, let's take a closer look at the process of adding items to a summary table in ANALYZER:
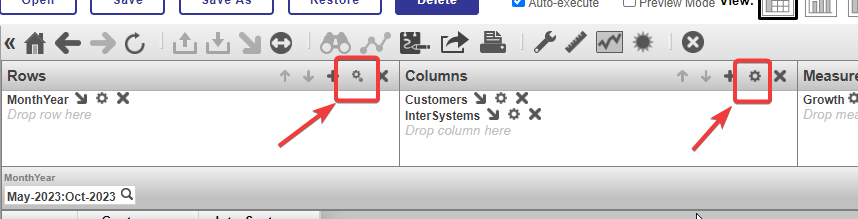
Rows: This element allows users to add specific data as rows to a summary table for further analysis. Users can select key factors or categories to group data into rows and provide more detailed analysis.
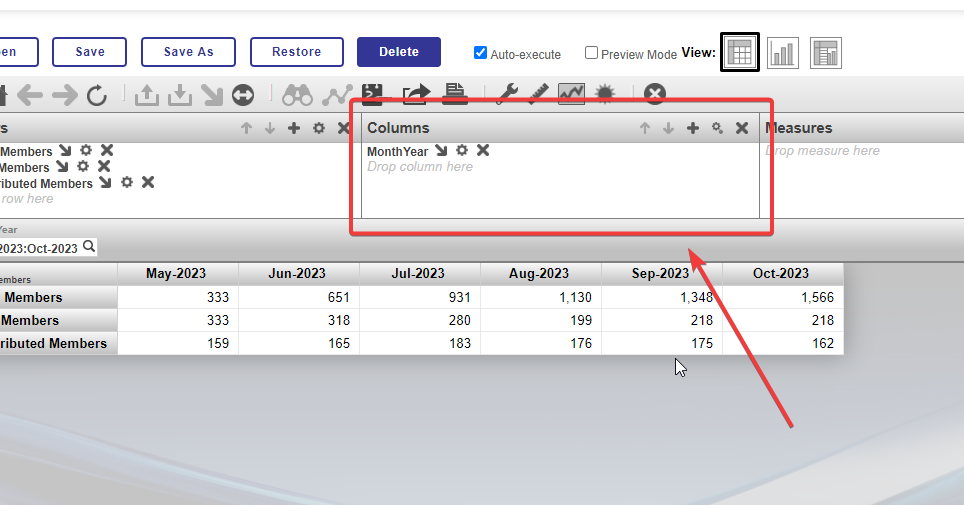
Columns: This option allows users to add data to a summary table as columns for easy comparison and visualization. Users can pick the parameters or indicators to be presented as columns for more objective analysis.
Measures: This element lets users add specific indicators or metrics to the summary table to evaluate performance or results. Users can select various types of metrics, including sums, averages, medians, and others, for further data analysis.
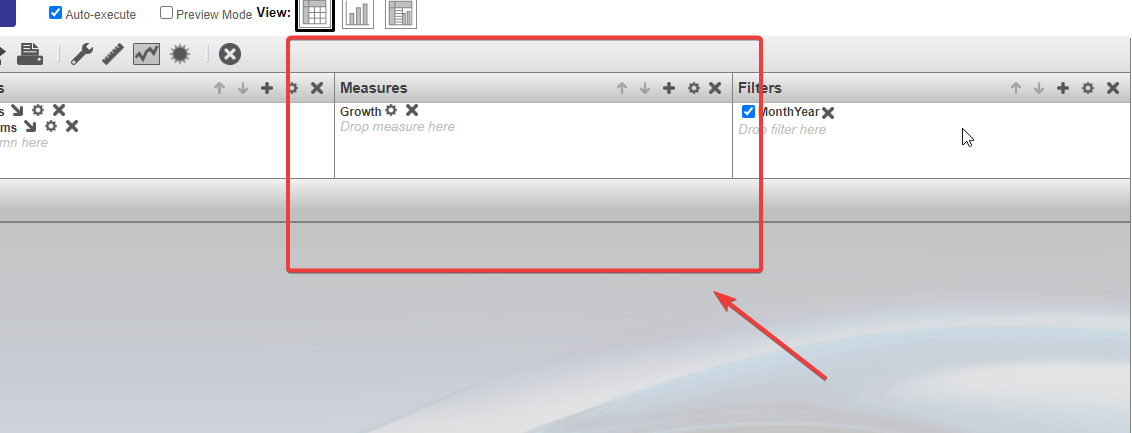
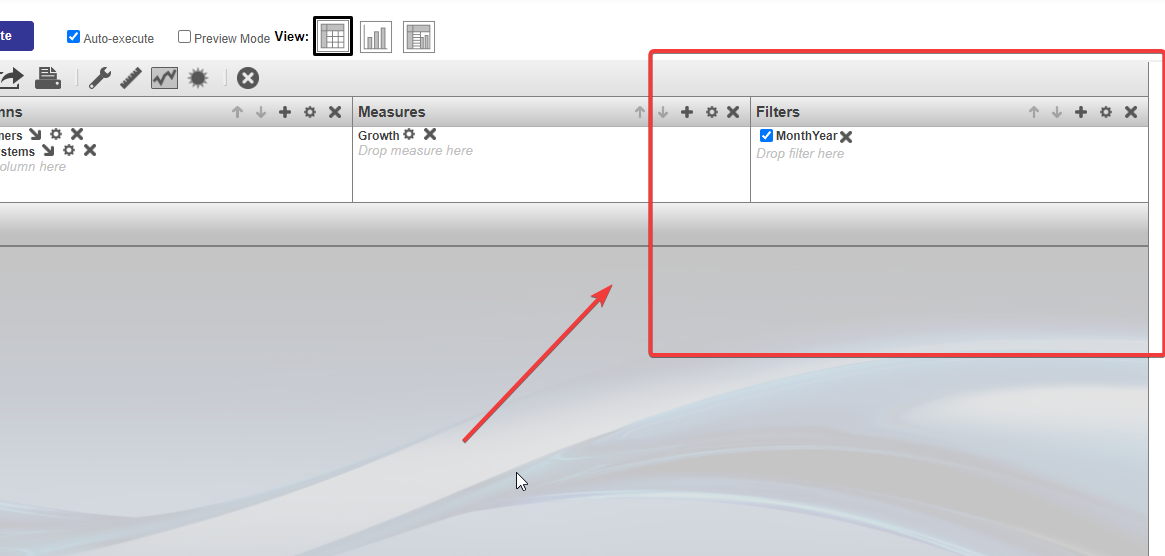
Filters: This option authorizes users to apply different filters and conditions to the data in the summary table to refine the analysis. Users can select specific parameters or values to filter the data for more exact and targeted research.
These elements play a crucial role in data analysis and provide flexibility and accuracy in working with data in summary tables. Users can determine and customize these elements based on their needs and business requirements to achieve the best results.
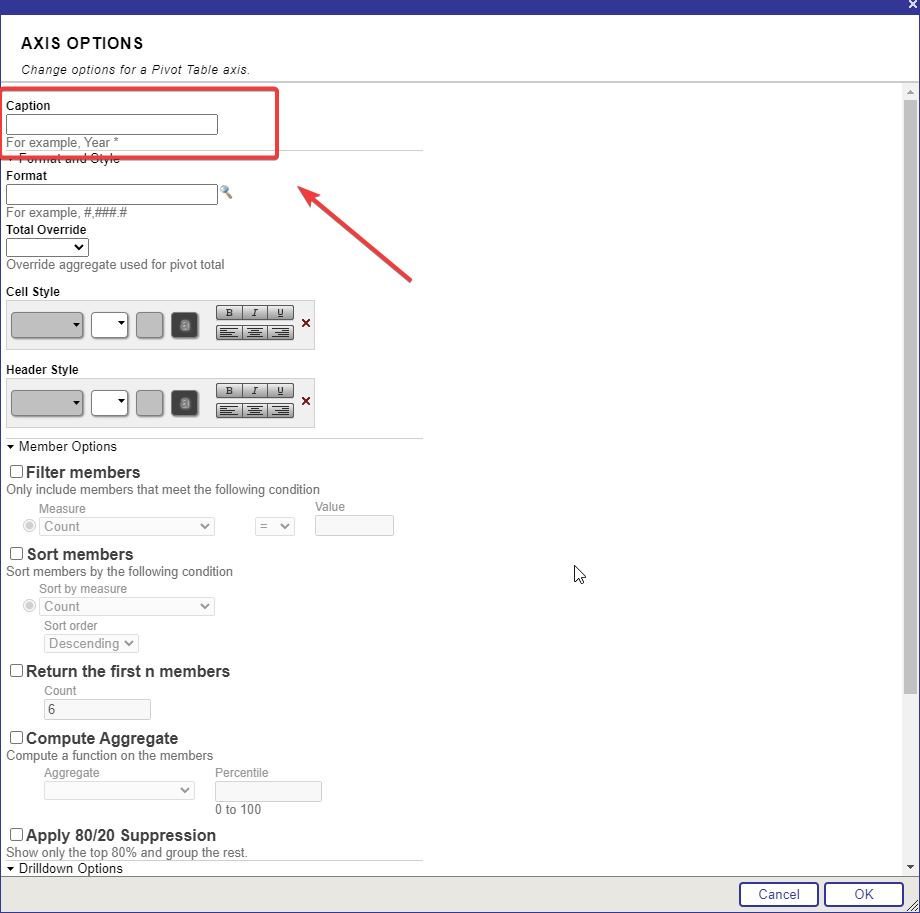
In ANALYZER, you can customize parameters for the "Rows" and "Columns" items using the "AXIS OPTIONS" function. Check out the available parameters for adjusting the "Rows" and "Columns" axes below:
Caption: This option entitles you to set a caption for the Rows and Columns axes for more accurate and detailed identification of the data presented there.
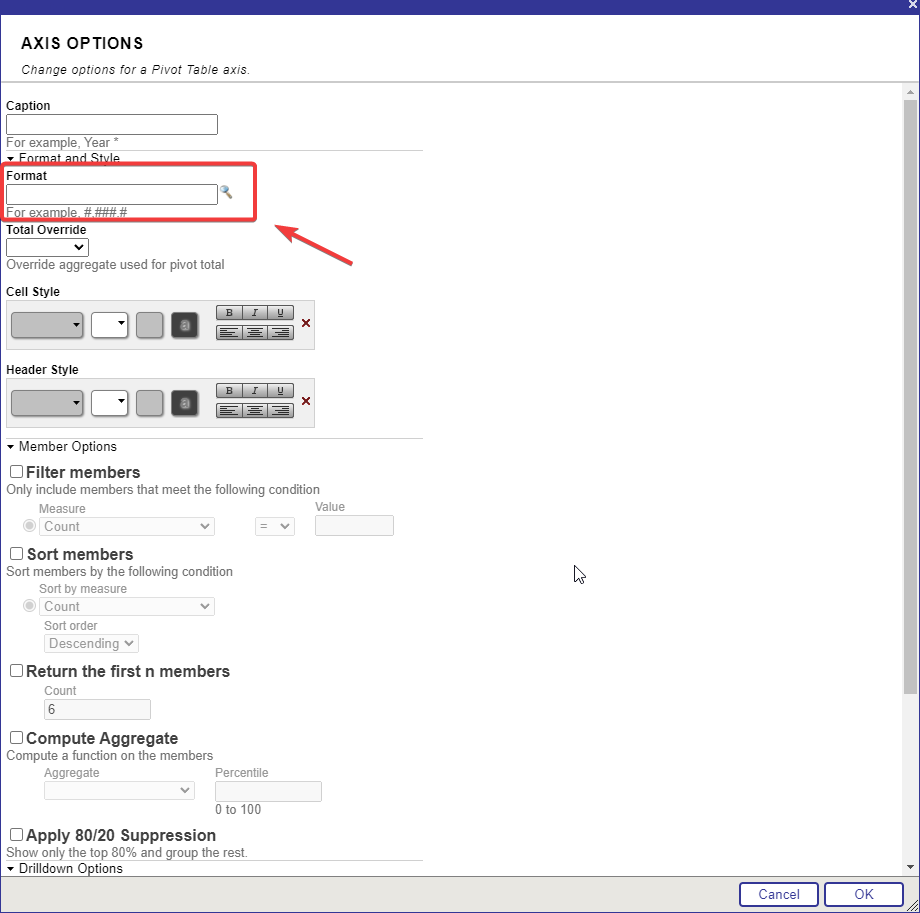
Format: This option lets you customize the formatting and display styles of the data in the Rows and Columns axes for a more convenient and informative presentation.
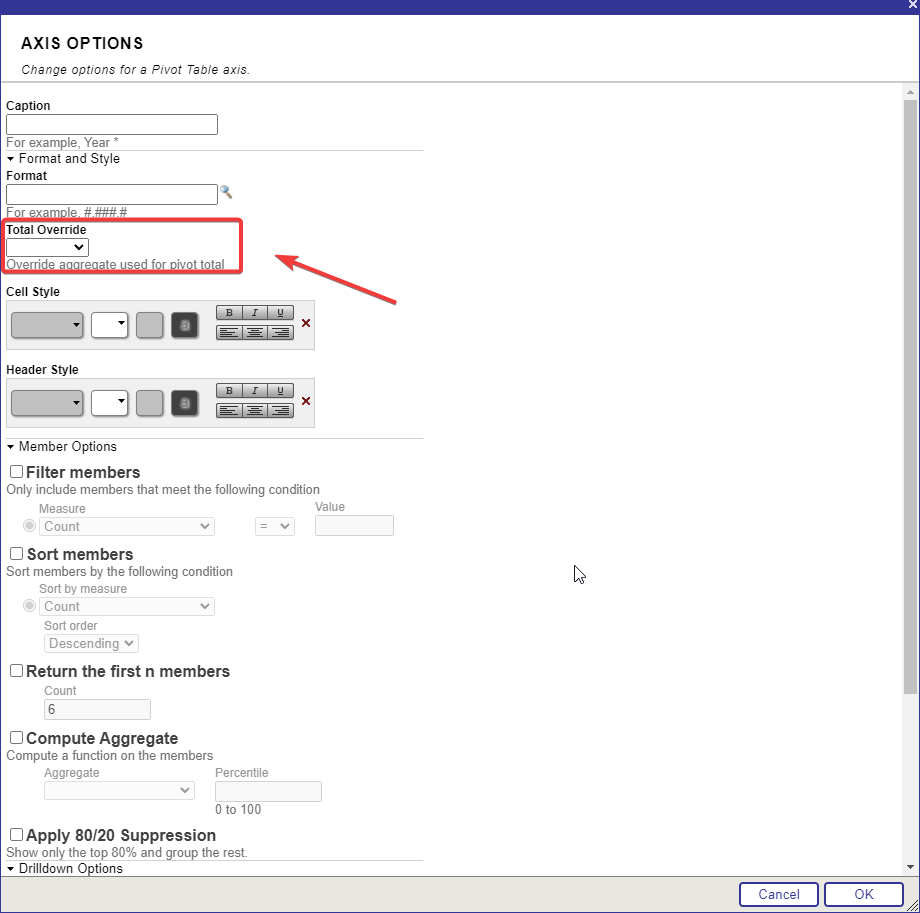
Total Override: This parameter allows you to override the aggregation used to total the data in the "Rows" and "Columns" axes.
Cell Style: This parameter authorizes you to modify the cell style of the data displayed in the Rows and Columns axes for better visualization.
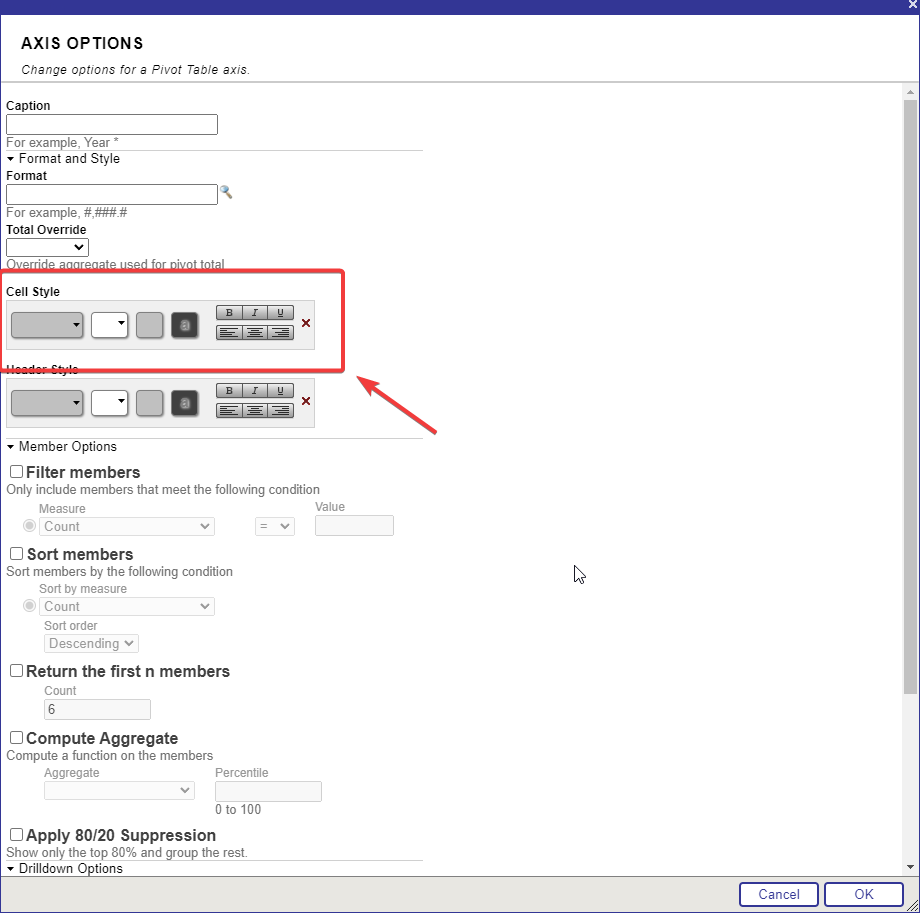
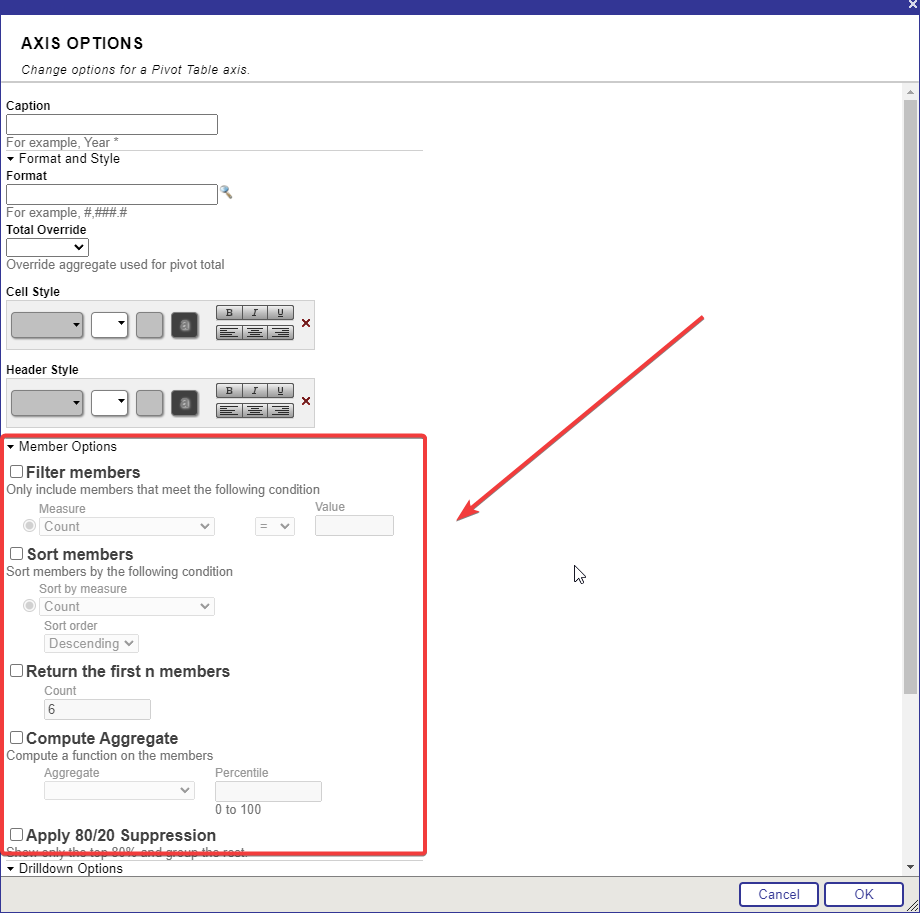
Member Options: This option permits you to filter, sort, and perform other operations on the items represented in the Rows and Columns axes for more proper and meticulous data analysis.
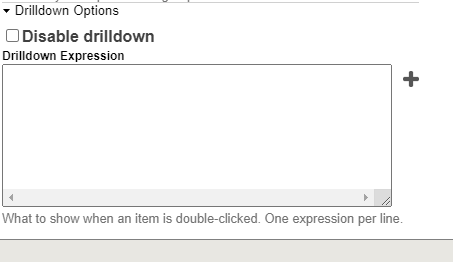
Drilldown Options: This option allows you to control the drilldown operation so that users can get more detailed information when needed.
When you configure these Rows and Columns axes settings, you get access to a flexible and intuitive way to work with data in summary tables, which ultimately lets users get the most out of their data analysis.
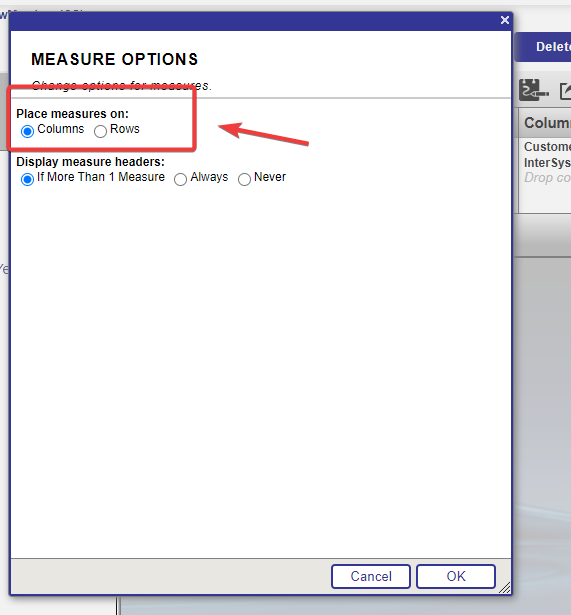
In ANALYZER, you can additionally customize parameters for the Measures element using the MEASURE OPTIONS function. Some of the available parameters for altering measures are presented below:
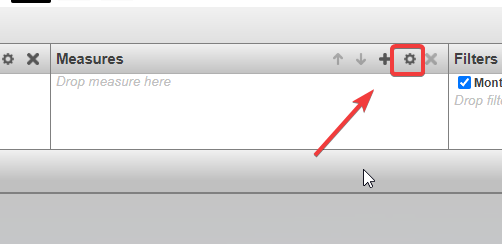
Place measures on: This option authorizes you to determine in which area (columns or rows) to place measures to make comparison and analysis of data easier.
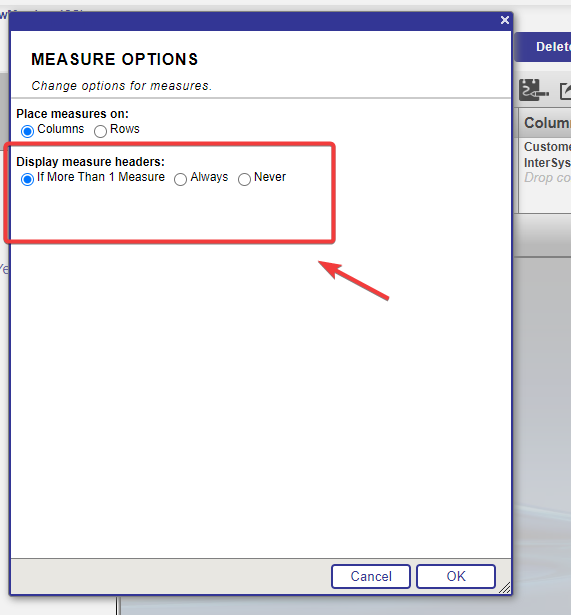
Display measure headers: This option lets you control the display of measure headers in the summary table depending on the number of selected measures. You can decide when and how to display those headers to improve the data visualization.
Configuring these settings for metrics in ANALYZER delivers more flexible and objective data analysis, allowing users to work with various types of metrics and indicators more efficiently to maximize the benefits of data analysis.
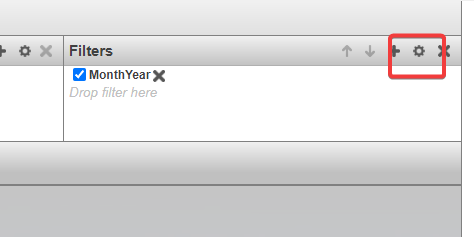
Finally, ANALYZER provides the ability to create and customize advanced filters for more precise and targeted data filtering. Check out some of the available options for for filter modifications below:
Add Condition: This option entitles you to add specific conditions to filter data based on the criteria and parameters you specify. You can determine different requirements that must be met to filter data.
Empty: If the filter is blank, you can use the "Add Condition" function to add prerequisites to filter the data. It will result in a more authentic and thorough filtering to get the desired results.
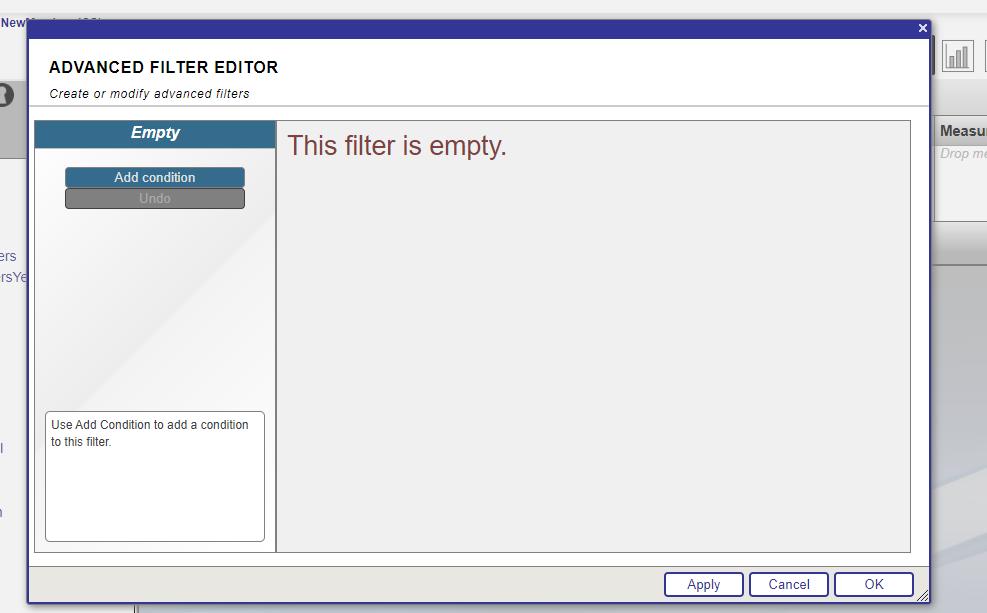
With the "ADVANCED FILTER EDITOR" in ANALYZER, users can build complex filters containing different parameters and conditions to refine the analysis and get more factual and relevant results. It gives us greater flexibility and precision when working with data in the summary table, authorizing users to apply filters according to their specific data analysis requirements and needs.
The Save function lets you preserve the current state of the summary table and any settings applied to the data. When you save a summary table, you can also save the analysis results in a format that allows you to retrieve and exploit the data for future reports, presentations, or further analysis. Similarly, preserving data makes it possible for you to return to previously saved results quickly and conveniently, and continue analyzing or visualizing the data.
So, bottom line:
ANALYZER is a powerful data analysis tool on the InterSystems IRIS platform that provides a variety of data manipulation capabilities. It equips users with convenient and intuitive tools to create summary tables, configure analysis and data visualization parameters, and apply various filters and conditions to obtain specific results. Save and Restore features allow users to save progress and quickly return to previously performed analyses for further work. Analyzer is an essential tool for deeper and clearer data analysis, helping users make more informed decisions based on facts and figures.
Comments
Thank you for the wonderfully detailed article!
Just had this training, great article