Visualizing Ensemble Workflow task execution

In this article, I'd demonstrate how you can visualize the usage of Ensemble Workflow with DeepSee (tested on 2015.1 and later).
Everyone familiar with InterSystems Ensemble, an integration and application development platform, knows what the Ensemble Workflow subsystem is and how useful it can be for automating human interaction. According to the definition by Workflow Management Coalition (www.WfMC.org), “workflows” are fully or partially automated business processes, where documents, information or tasks are passed from one participant to another according to established rules and procedures.”
Key aspects of a Workflow:
- The purpose of a Workflow is to cover a “fragment” of work
- A workflow is a set of procedural task execution rules
- A Workflow user is someone working on tasks in the workflow management system
- A role in a Workflow is a group of users working on a particular type of tasks.
The workflow management subsystem in Ensemble enables you to do the following:
- Automate workflow management using Ensemble business processes
- Flexibly configure the task assignment process
- Work with a workflow management system via a special Workflow portal supplied with Ensemble
- Organize the interaction of the workflow management subsystem with Ensemble's integration business processes
- Use the business activity monitoring subsystem, Ensemble's management, and monitoring tools
- Easily configure and extend the functionality of the Workflow subsystem
Ensemble Workflow allows seamless integration between human-performed manual parts of your business process and automated parts. For more information on Ensemble workflow please refer to the documentation and this community article (Workflow introduction is quoted from there).
Analytics
By default Ensemble provides business metrics and Workflow Task List portal page (SMP → Ensemble → Manage → Workflow → Workflow Tasks) for higher level task management:
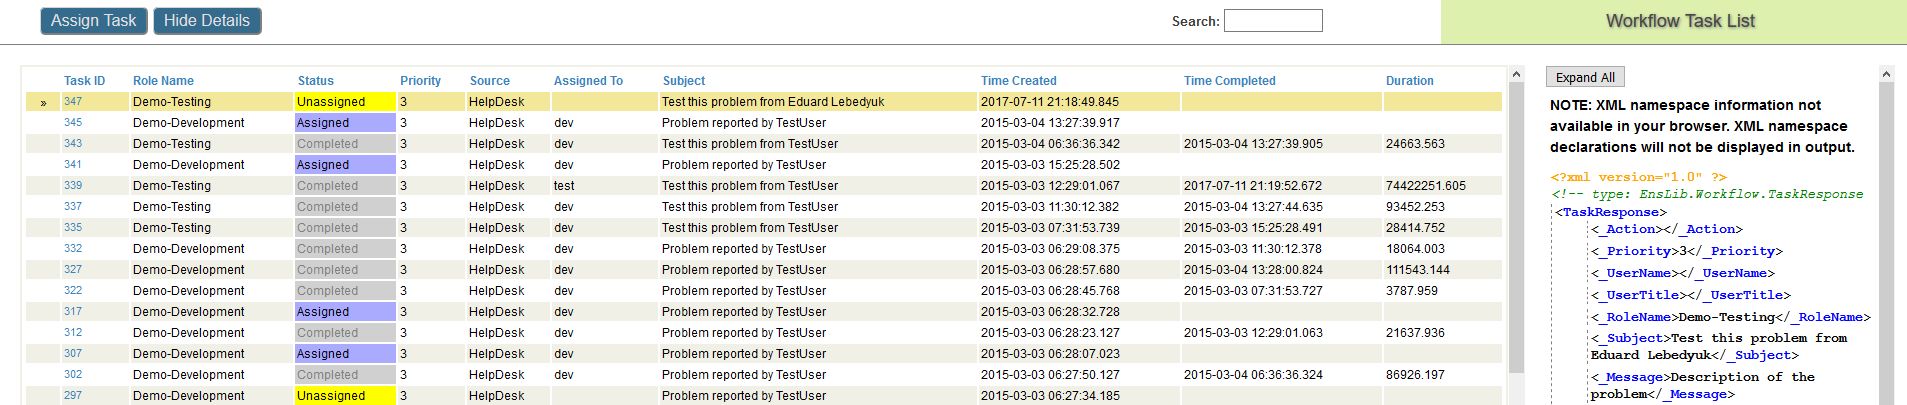
And doesn't it look good as a fact table for DeepSee Cube? It sure does, so I've decided to build a DeepSee cube based on a EnsLib.Workflow.TaskResponse class:
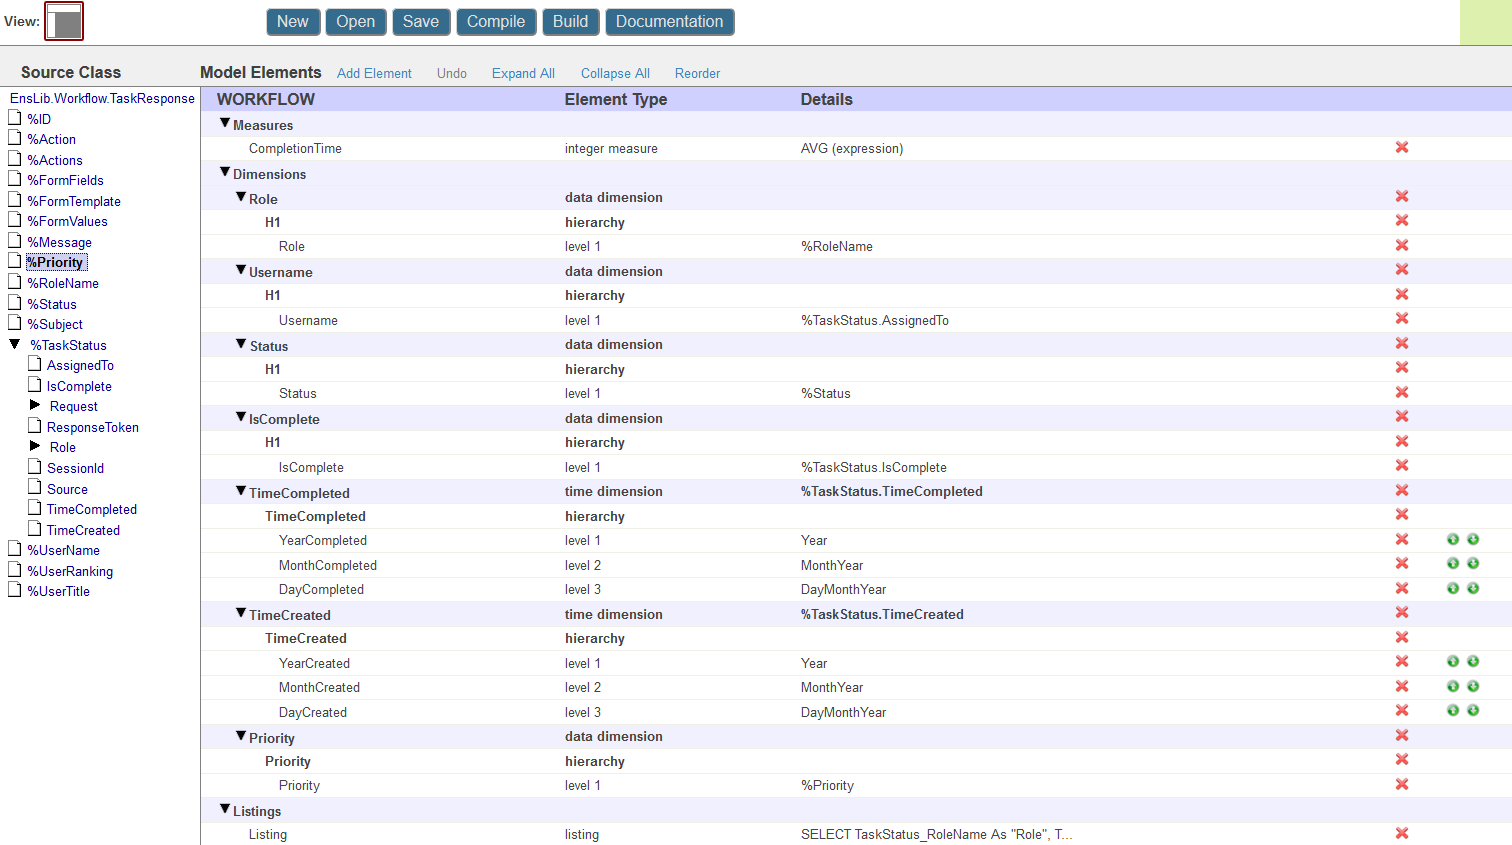
In this cube I store information about each task, namely:
- User who completed the task
- Task role
- When it was created and when completed
- Priority
- Current Status
- Is task completed?
- Time spent to complete the task
Most of it is just straightforward cube building, but some here's some interesting tidbits:
CompletionTime is an expression measure calculated in minutes using this syntax:
$System.SQL.DATEDIFF("minute",%source.%TaskStatus.TimeCreated,%source.%TaskStatus.TimeCompleted)And SQL Listing is defined like this ($$$SOURCE is a fact table and $$$RESTRICT is a runtime DeepSee filter):
SELECT
TaskStatus_RoleName AS "Role",
TaskStatus_IsComplete AS IsCompleted,
%Status AS "Status",
TaskStatus_Source AS BusinessProcess,
TaskStatus_AssignedTo AS "User",
%Subject AS "Subject",
%Message AS "Message",
TaskStatus_TimeCreated AS "TimeCreated",
TaskStatus_TimeCompleted AS "TimeCompleted",
DATEDIFF('minute', TaskStatus_TimeCreated, TaskStatus_TimeCompleted) AS "CompletionTime"
FROM $$$SOURCE
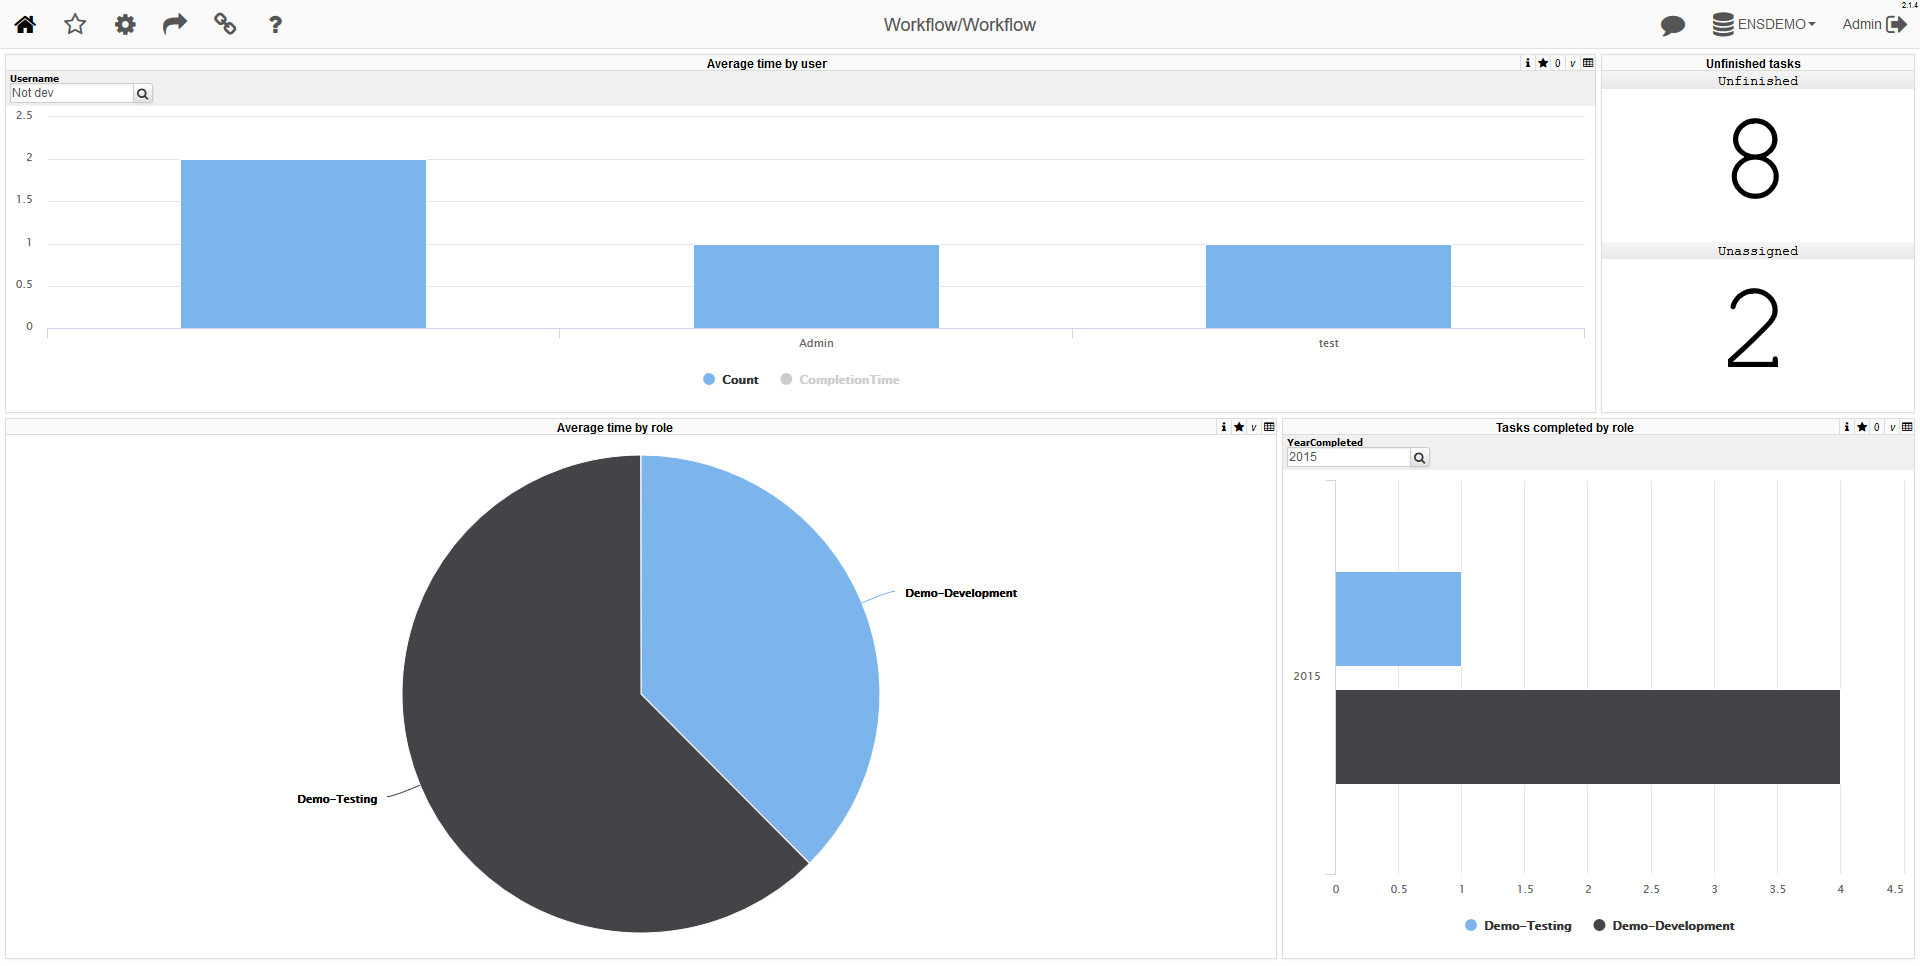
WHERE $$$RESTRICTThat said, let us build the cube and build some widgets. I decided to build one dashboard showcasing main figures:
- Average time taken by user and by role to complete the task
- Number of tasks currently not in work or not completed
- Number of tasks completed in a period
Here's a demo dashboard (Login: dev / Pass: 123) visualized using DeepSeeWeb (renderer for DeepSee Dashboards in Browser with MDX2JSON as a Serverside and JS web-client):
Drilldown and drillthrough are also available:
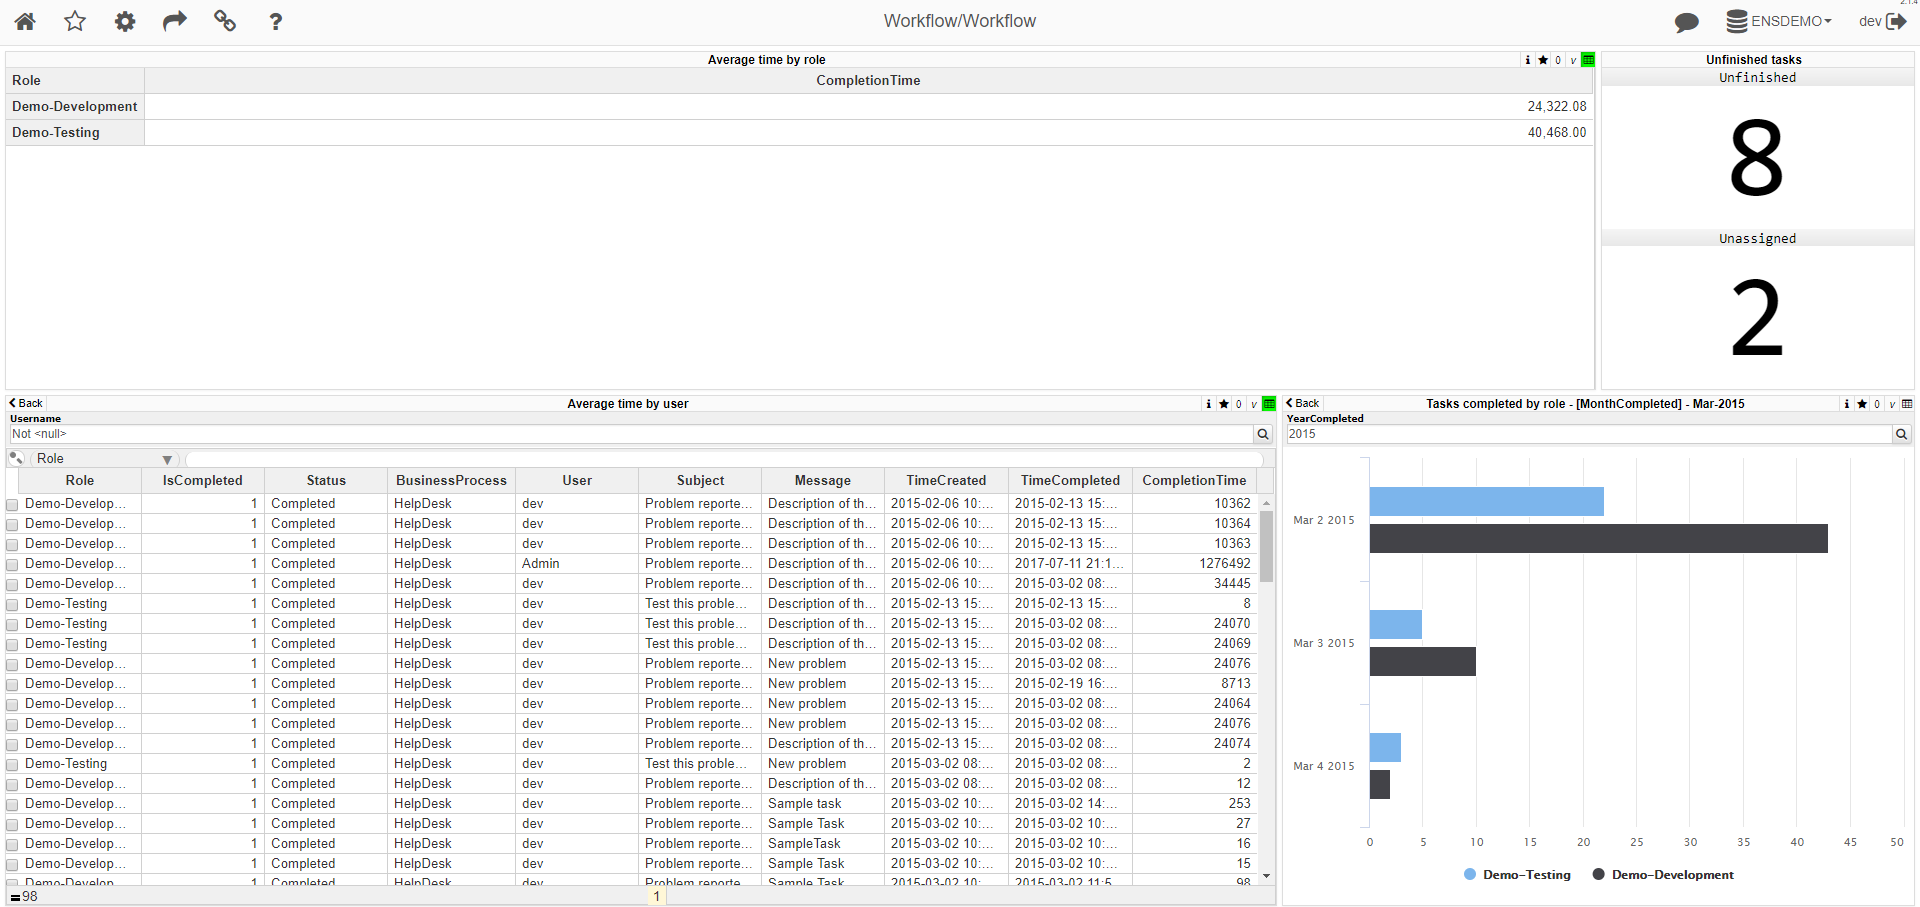
You can complete workflow tasks on our test server with the HelpDesk application running on it. Login: dev / Pass: 123 and see changes on the dashboard (cube is built once an hour)
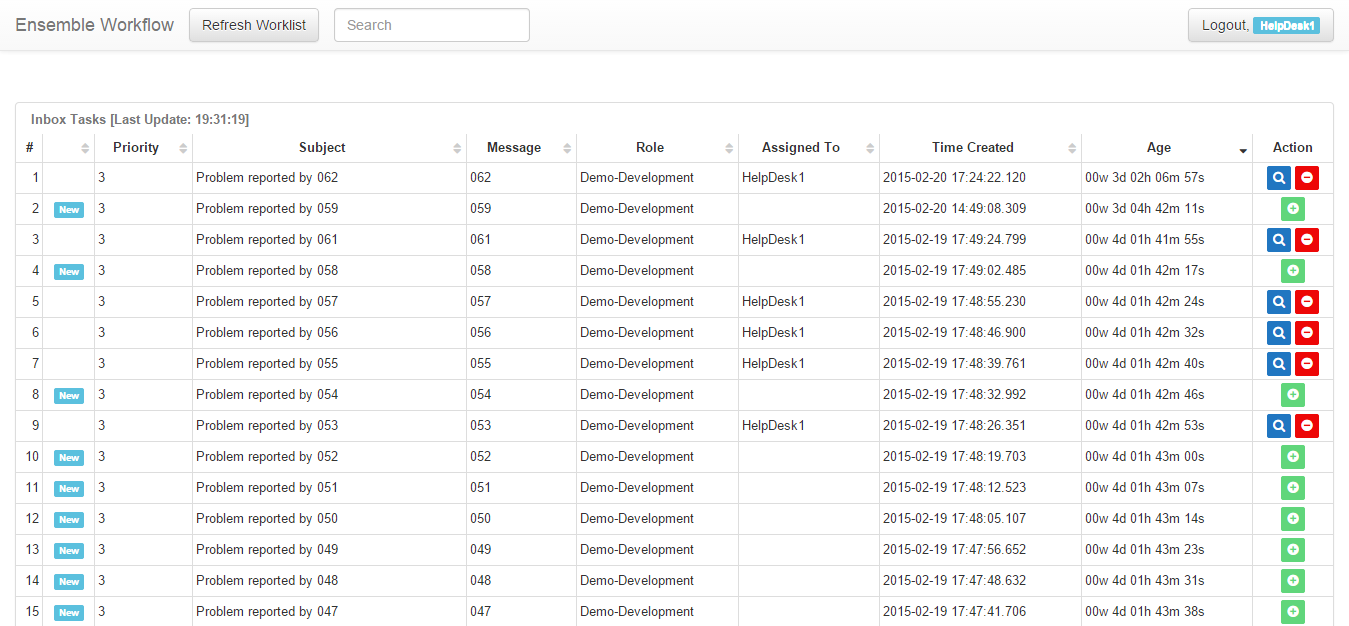
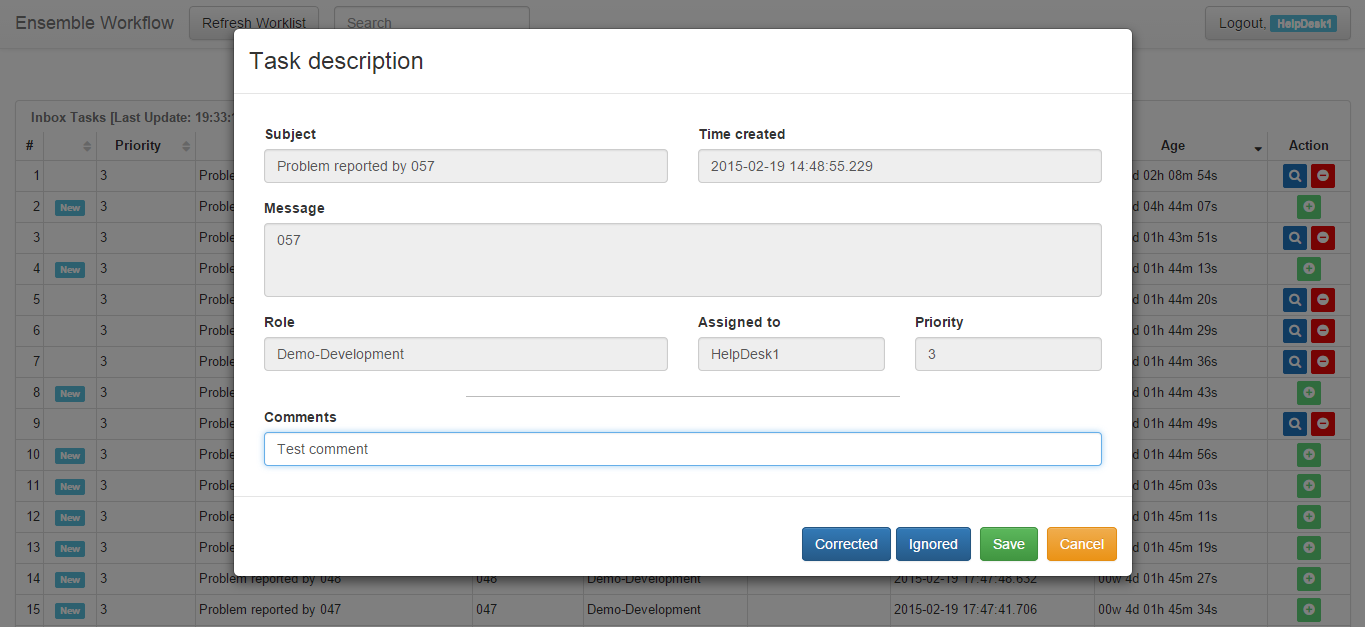
Here's how Ensemble Workflow looks like using EnsembleWorkflowUI:
Conclusion
DeepSee can be used to visualize usage of Ensemble Workflow data.
This is a basic project that can be used for quick demonstration of both Ensemble Workflow and DeepSee capabilities and be easily extended as required.