Debugging Web
In this article I'll cover testing and debugging Caché web applications (mainly REST) with external tools. Second part covers Caché tools.
You wrote server-side code and want to test it from a client or already have a web application and it doesn't work. Here comes debugging. In this article I'll go from the easiest to use tools (browser) to the most comprehensive (packet analyzer), but first let's talk a little about most common errors and how they can be resolved.
Errors
401 Unauthorized
I think it's the most often encountered error during the deploy to production. Local development server usually has minimal security setting or normal but vanilla security. Production server, however can have a more restrictive scheme. So:
- Check that you're logged in
- Check that user has access to the database/table/procedure/row/column you want to access
- Check that OPTIONS request can be performed by unauthorized user
404 Not Found
Check:
- Url is correct
- If it's a new application and you're using external web-server reloading web-server can help
Application errors
In some way the easiest to find - stack trace helps. Resolution is completely application-specific.
Debugging tools
Web browser
The first and always available debug tool is a Web browser, preferably Chrome but Firefox would also suffice. GET requests can be tested by entering the URL into address bar, all other requests require a web application or writing js code. General approach is:
- Press F12 to open developer tools.
- Go to Network tab
- Check Preserve Log checkbox, if not set
- Display only XHR requests
- Perform buggy action in web application
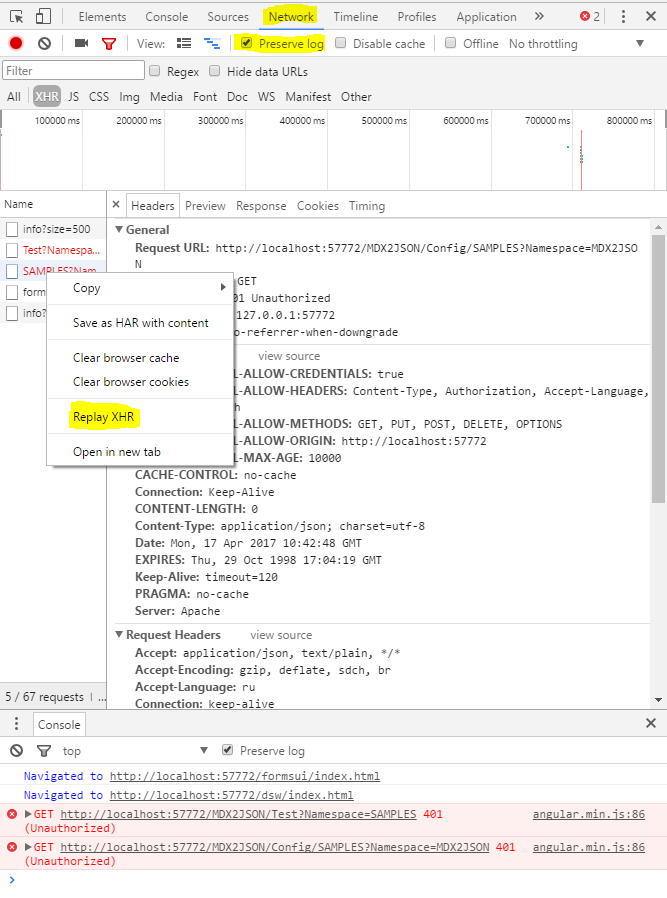
From here you can examine requests and resend them. Firefox can also edit requests before repeating them.
Pros:
- Always available
- Easy to use (end users can send screenshots of Network and Console tabs)
- It's end user environment
Cons
- Doesn't show partially send/broken/etc. responses
- Slow on big responses
- Slow on big number of responses
- Everything is done manually
REST client
REST Client is a standalone web application or web browser addon made specifically for testing web applications. I use Postman, but there are a lot of them. Here's how debugging on Postman looks like:
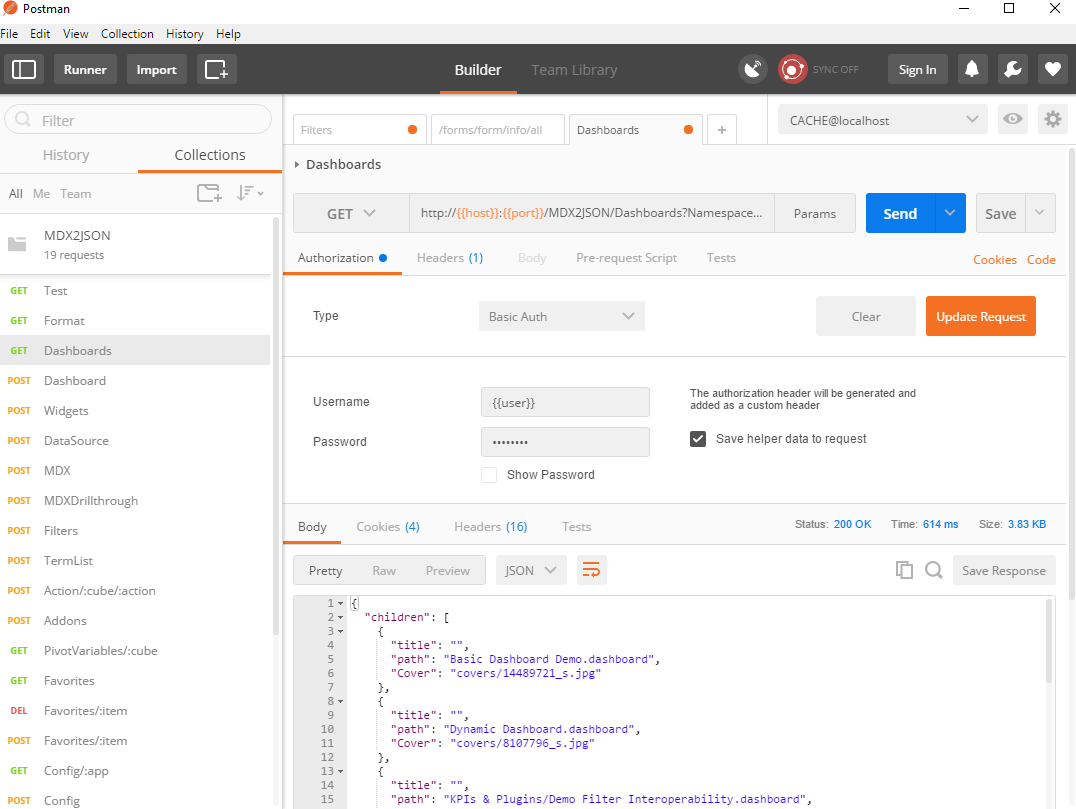
Postman works with requests grouped into collections. Request can be sent into the environment. Environment is a collection of variables. For example in my CACHE@localhost environment host variable is set to localhost and user to _SYSTEM. When request is sent variables are replaced with their values for chosen environment and the request is sent.
Here's a sample collection and environment for MDX2JSON project.
Pros:
- Write once - use everywhere
- Better control over request
- Response prettification
Cons:
Debugging chained requests (response to request1 can force either request2 or request 2B) is still manual(Feb 22 update: Possible in Postman)- Sometimes fails on partially send/broken/etc. responses
HTTP Debugging proxy
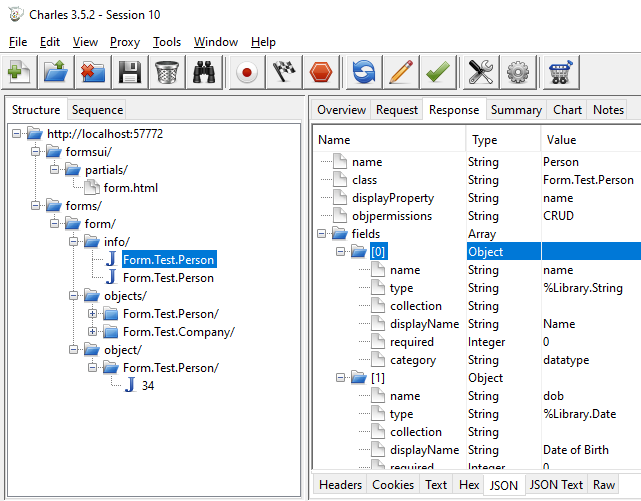
A standalone application that logs HTTP(S) traffic. Logged requests can be modified and resend. I use Charles and Fiddler.
Pros:
- Processes partially send/broken/etc. responses
- Response prettification
- Better support for HTTPS traffic (than in packet analyzer)
- Can save capture sessions
Cons:
- Something (web application/REST client/JS code) is required to send the request
Packet analyzer
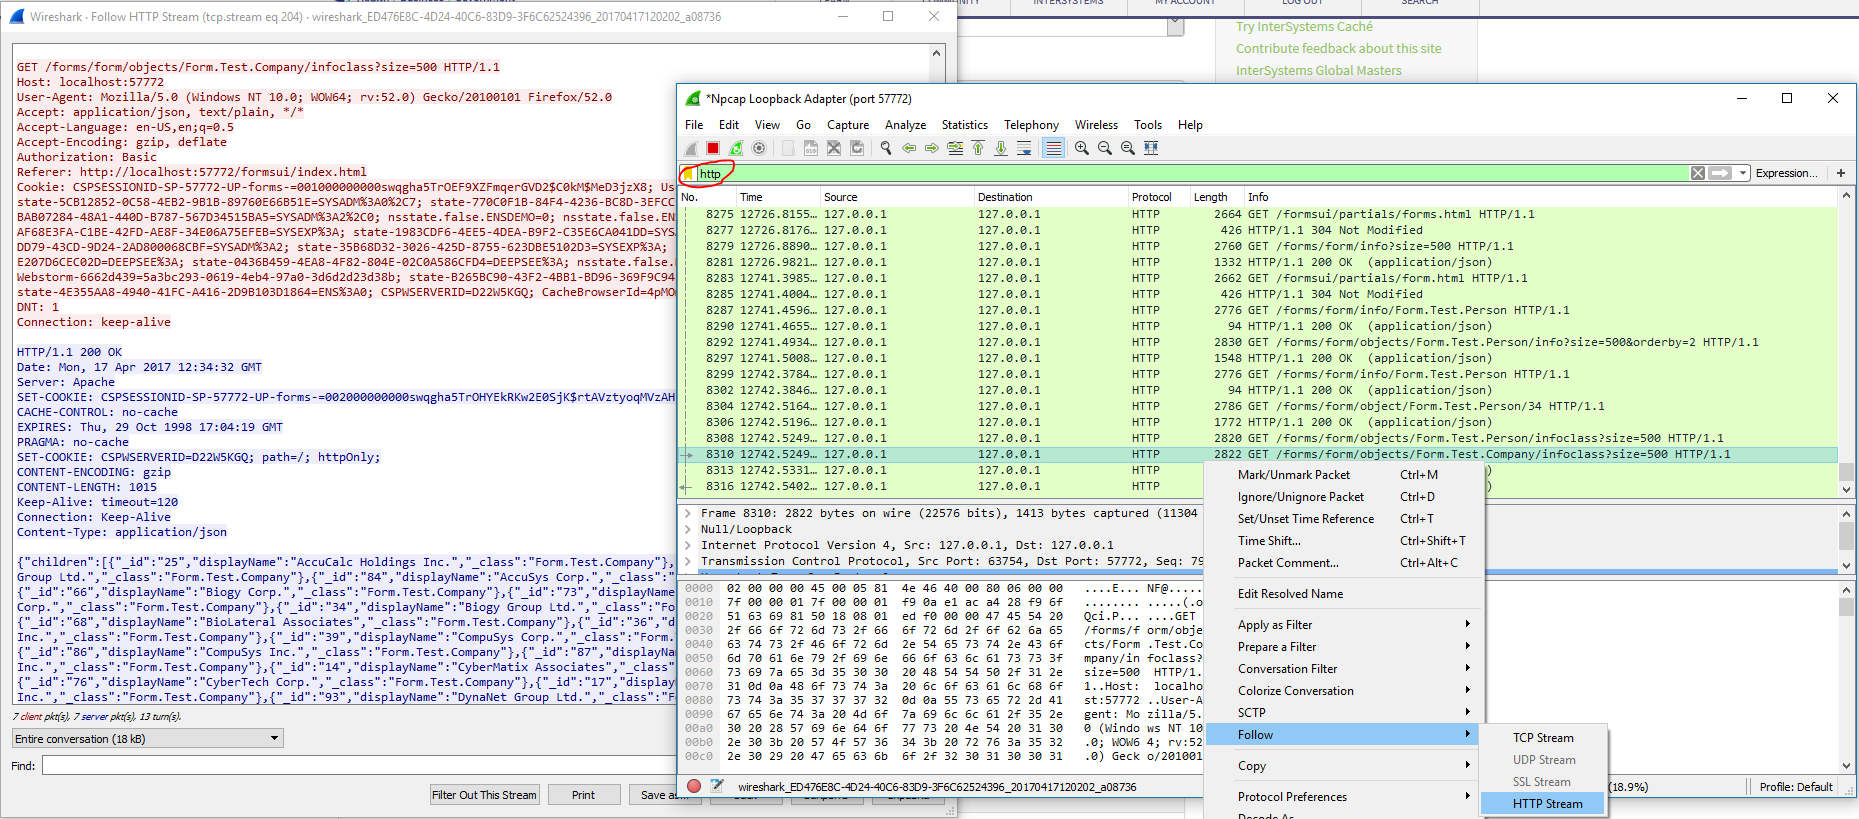
A computer program that can intercept and log traffic that passes over a network. As data streams flow across the network, the sniffer captures each packet and, if needed, decodes the packet's raw data. This is the most comprehensive option, but also requires some skill to operate properly. I use WireShark. Here's a little guide on how to install and use it:
- If you're going to capture local packets, read about loopback and install prerequisite software (npcap for windows)
- Install WireShark
- Configure capture filters (for example filter to capture only traffic on 57772: port 57772
- Start capture
- Configure display filters (for example filter to display only http traffic to a specific ip: ip.addr == 1.2.3.4 && http
Here's a sample capture of http traffic (display filter) on 57772 port (capture filter):
 Pros:
Pros:
- Processes partially send/broken/etc. responses
- Can capture large amounts of traffic
- Can capture anything
- Can save capture sessions
Cons:
- Something (web application/REST client/JS code) is required to send the request
What to use
Well, that depends on a purpose. First of all we can aim to either log (debug proxy, packet analyzer) or generate (browser, REST client) requests.
If you're developing a REST Web API, then REST client is the fastest way to test that it works.
If, however, requests from REST client work, but client web application does not, browser, http debug proxy and packet analyzer may be required.
If you have clients and you need to develop server-side api to work with them, you'll need http debug proxy or packet analyzer.
It's better to be familiar with all 4 types of tools and quickly switch between them if the current one is insufficient for the job.
Sometimes the right tool is obvious.
For example recently I developed server side API for one popular http extension protocol, the requirements were:
- Clients are already written and we can't change their code
- Different clients behave differently
- Behavior on http and https differs
- Behavior with different authentication types differs
- Up to hundred requests per second per client
- Everyone ignores the RFC
There's only one solution here - packet analyzer.
Or if I'm developing a REST API for JS consumption, REST client is a perfect tool for testing.
When debugging web application start with web browser.
In Part 2 we'll discuss what can be done (a lot) for web debugging on the Caché side.
What are your approaches to debugging client-server communication?
Comments
really nice article @Eduard Lebedyuk - thank you for taking the time to write this up! I am going to add this reference to my team's debugging resources list!!
💡 This article is considered as InterSystems Data Platform Best Practice.