How to do performance and load tests on databases and backends
Sometimes we need to know for sure if the current environment has sufficient cores, memory, and bandwidth to support the planned number of users and such SLAs as latency, response time, and availability. This is true for databases and backends. This is why it is mandatory for critical applications and databases to simulate the users simultaneous/concurrent requests and collect metrics about performance and availability.
The most popular tool to do load and performance tests is called JMeter. It is an open-source tool to set database and backend requests with multiple threads (one per user) and collect such metrics as latency and response time in order to show it on reports, files, and HTML dashboards.
What is JMeter?
According to its website, The Apache JMeter™ application is open-source software, a 100% pure Java application designed to load test functional behavior and measure performance. It was originally designed for testing Web Applications but later expanded to other test functions.
Apache JMeter may be used to test the performance of both static and dynamic resources as well as Web dynamic applications. It can be used to simulate a heavy load on a server, group of servers, network, or object to test its strength or to analyze overall performance under different load types. Apache JMeter features (those in bold will be detailed in this article) include:
- Ability to load and performance test many different applications/server/protocol types:
- Web - HTTP, HTTPS (Java, NodeJS, PHP, ASP.NET, …);
- SOAP / REST services;
- FTP;
- Database via JDBC;
- LDAP;
- Message-oriented middleware (MOM) via JMS;
- Mail - SMTP(S), POP3(S) and IMAP(S);
- Native commands or shell scripts;
- TCP;
- Java Objects.
- Full-featured Test IDE that allows fast Test Plan recording (from Browsers or native applications), building, and debugging.
- CLI mode (Command-line mode that was previously called Non-GUI or headless mode) to load tests from any Java-compatible OS (Linux, Windows, Mac OSX).
- A complete and ready-to-present dynamic HTML report.
- Easy correlation through the ability to extract data from the most popular response formats, HTML, JSON , XML, or any textual format.
- The full multithreading framework allows concurrent sampling by many threads and simultaneous sampling of different functions by separate thread groups.
- Caching and offline analysis/replaying of test results.
Download and configure the Java
If you have Java installed, skip this section, otherwise, execute the following actions:
- Download Java from https://jdk.java.net/archive/ (choose any Java version from 11 to the newest one depending on the specifics of your operating system).
- Unzip the file to any folder on your computer.
- Memorize the name of the installation folder to use it later.
Download and configure the JMeter
To get and install the JMeter, take the undermentioned steps:
- Download JMeter from https://jmeter.apache.org/download_jmeter.cgi (select a zip file for Windows and TGZ one for other OS options).
- Unzip the file to any folder on your computer.
- Memorize the location of the installation folder because we will need it afterward.
Download and configure the IRIS application to be tested
We are going to test the FHIR template
(https://openexchange.intersystems.com/package/iris-fhir-template). To get and install it, proceed with the next steps:
1. If you are using ZPM/IPM from your current IRIS for Health instance, execute the command from the IRIS console:
zpm "install fhir-server"
2. If you are using Docker (a docker desktop or a server is required):
a. Clone/git pull the repo into any local directory:
git clone https://github.com/intersystems-community/iris-fhir-template.git
b. Open the terminal in that directory and run:
docker-compose up -dPrior Manual tests
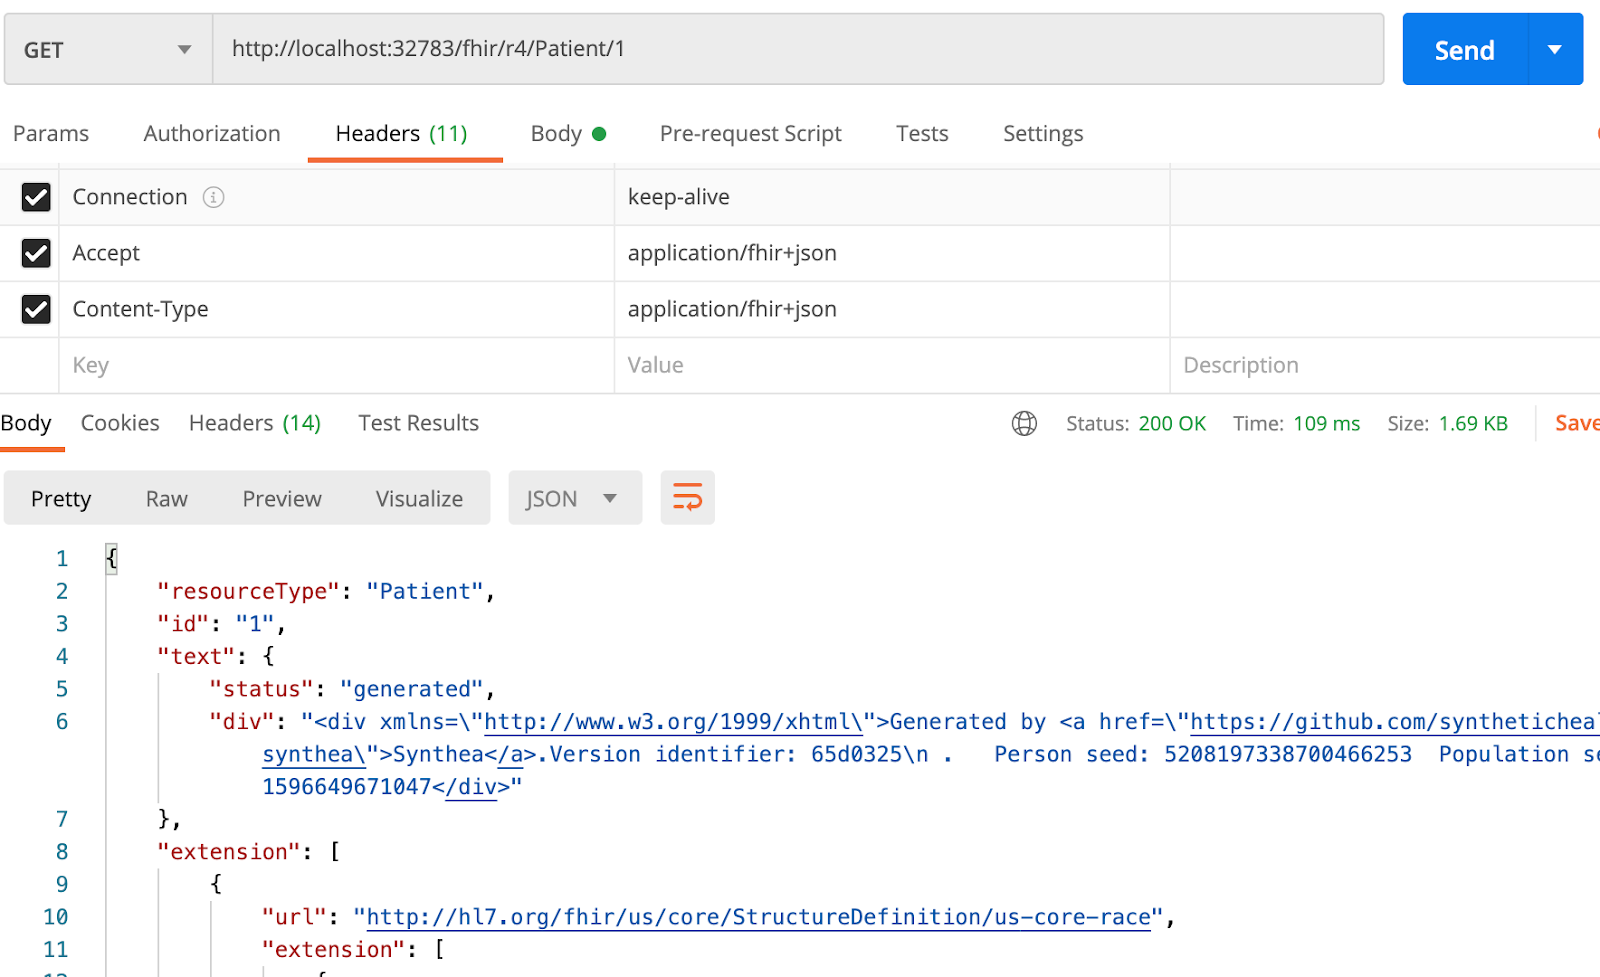
Before creating the automated tests, remember to execute manual tests using Postman or another HTTP client to ensure the API you want to test is working. Call a GET method for http://localhost:32783/fhir/r4/Patient/1 and see the results as illustrated below:
Running JMeter
To run JMeter do the following:
1. Edit the jmeter.bat (for Windows) or jmeter.sh (for other operating systems) file and add the JAVA_HOME (in my case C:\Java\jdk-20) after setlocal line:
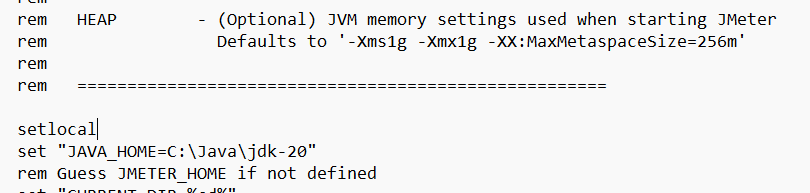
The line you need is: set “JAVA_HOME=<folder where you unzipped the Java>”
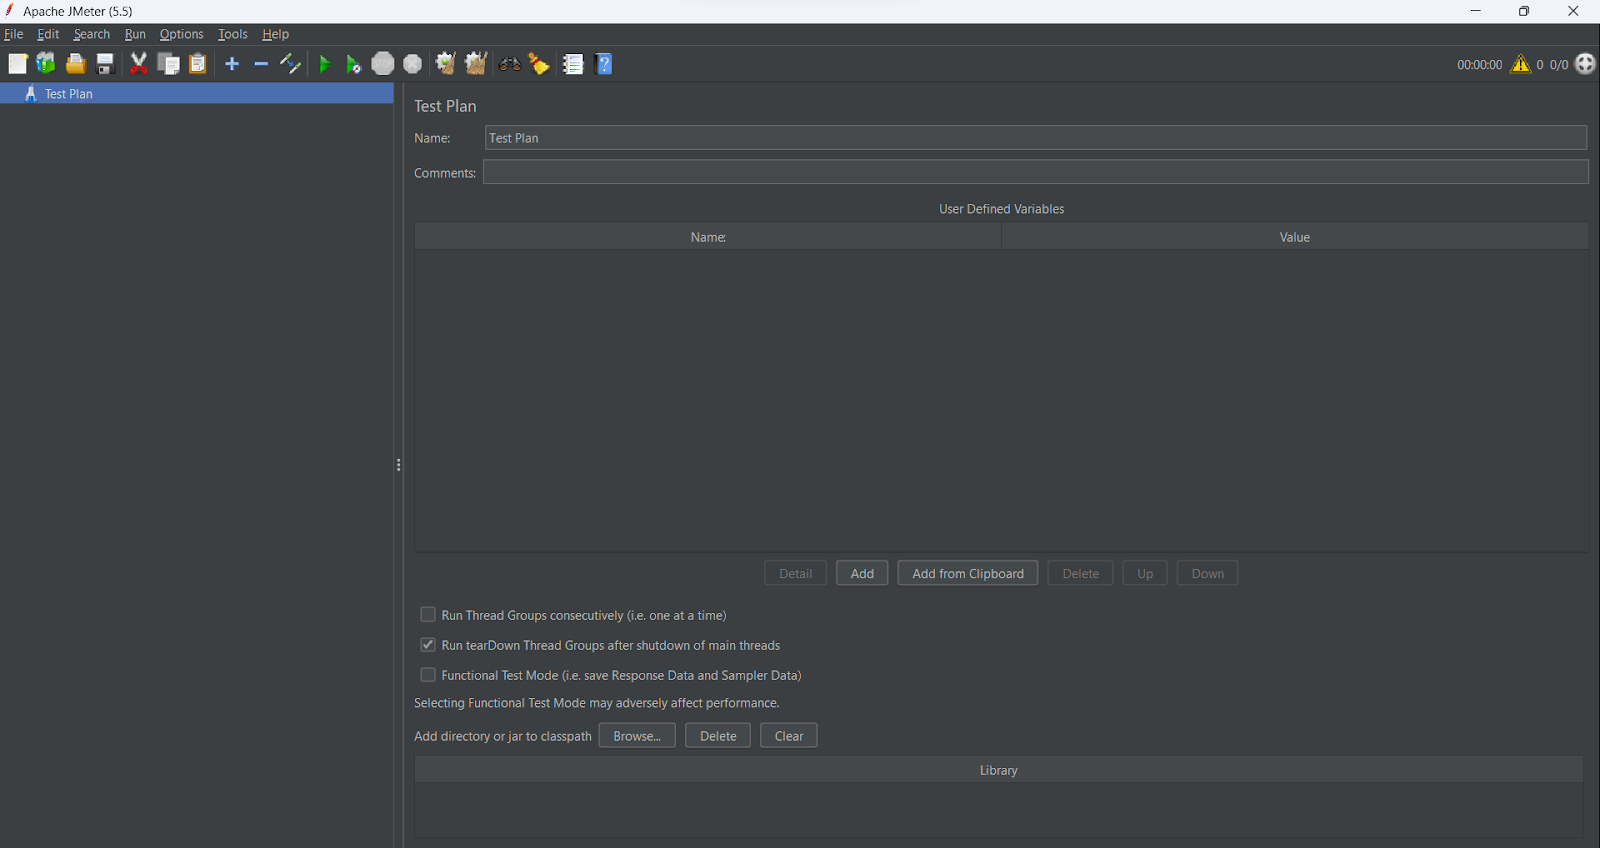
2. Now save the jmeter.bat (for Windows) or jmeter.sh (for other OS) file and execute it.
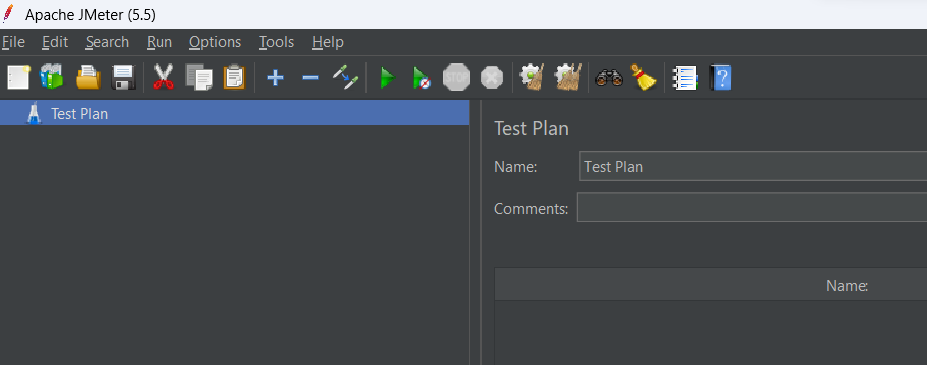
3. In a few seconds, you should see JMeter GUI:
Create a performance test for a REST API
To create a REST API performance test, proceed with the following steps:
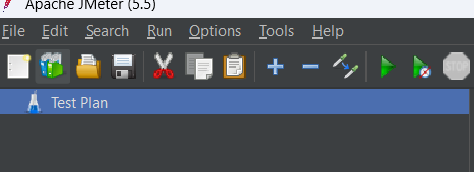
1. Select the second button ( templates) to use a template to test REST APIs:
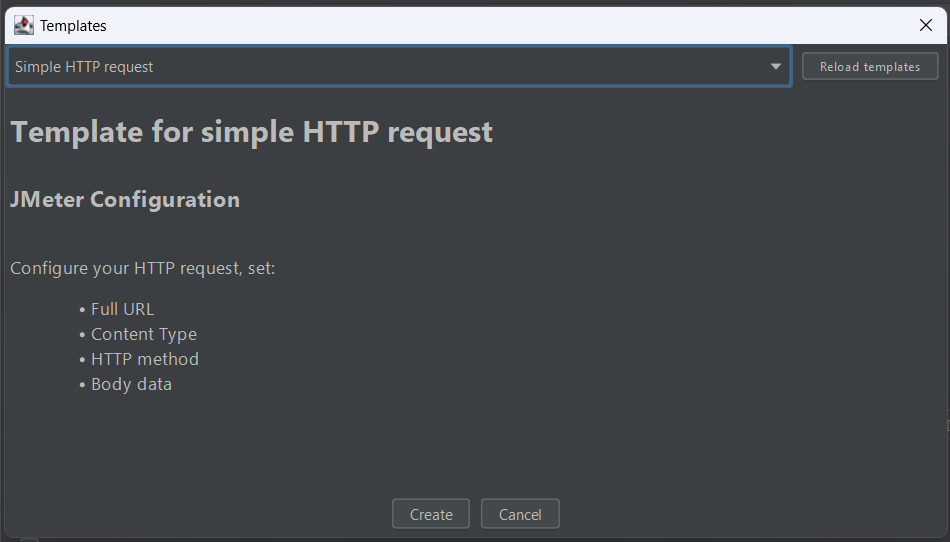
2. Select the Simple HTTP request and click the Create button:
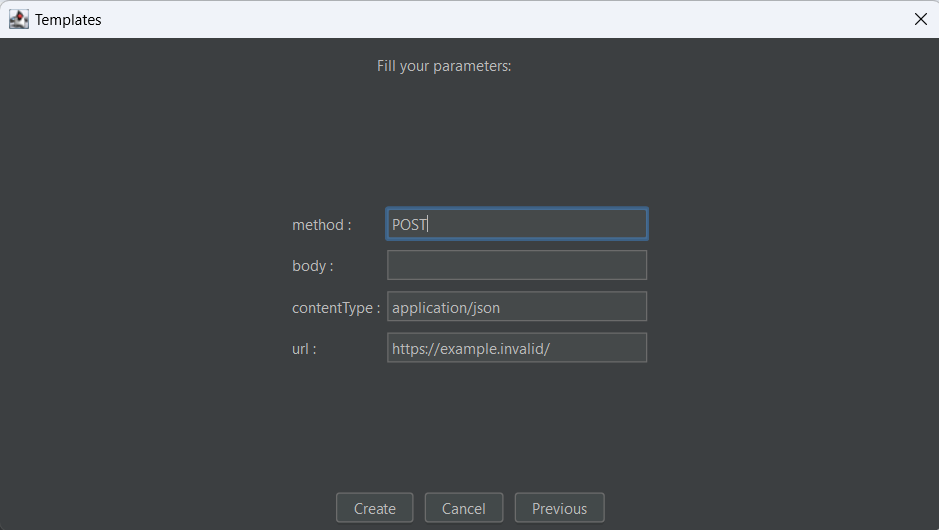
3. Leave the default values untouched and click the Create button:
4. At this point, you have created several JMeter elements:
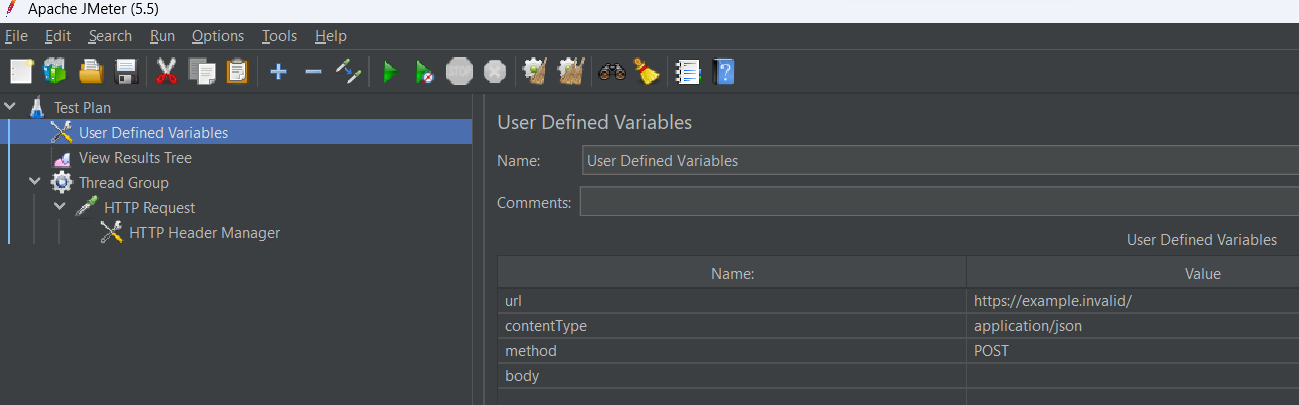
5. Select User-Defined Variables and change the variables for the values stated below:
- url: http://localhost:32783/fhir/r4/Patient/1
- method: GET
- contentType: application/json

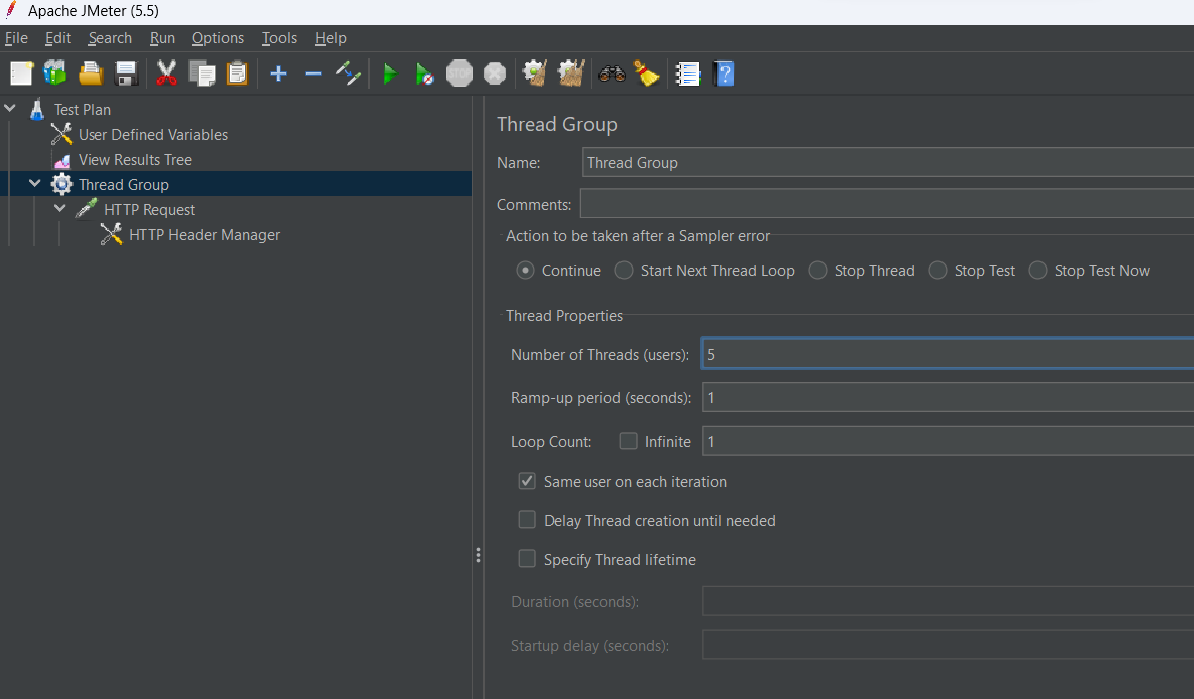
6. Choose the Thread Group section and change the Number of Threads (users) from 1 to 5:
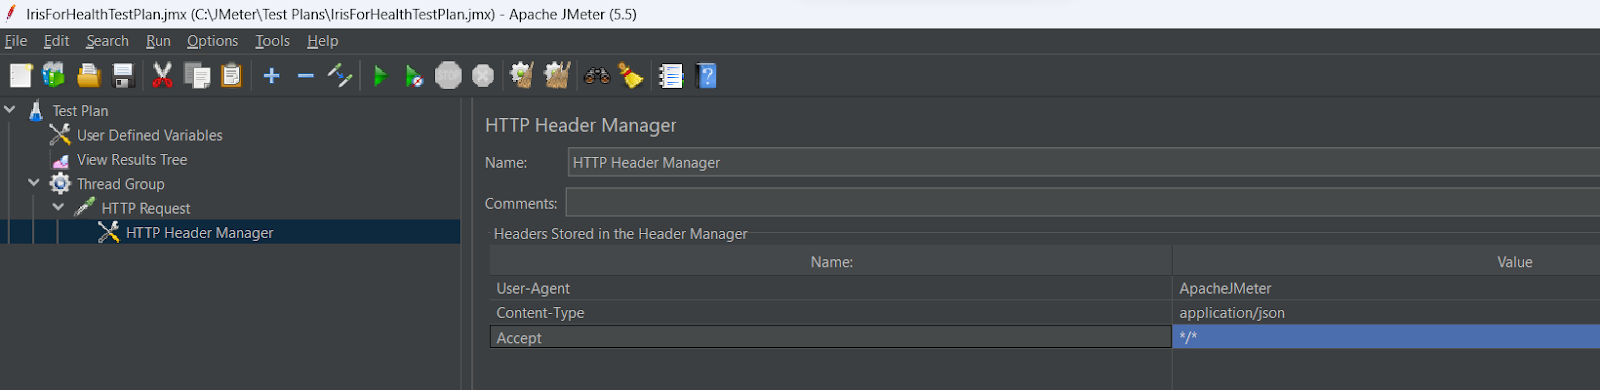
7. Go to the HTTP Header manager and create the parameter Accept with the value */*:
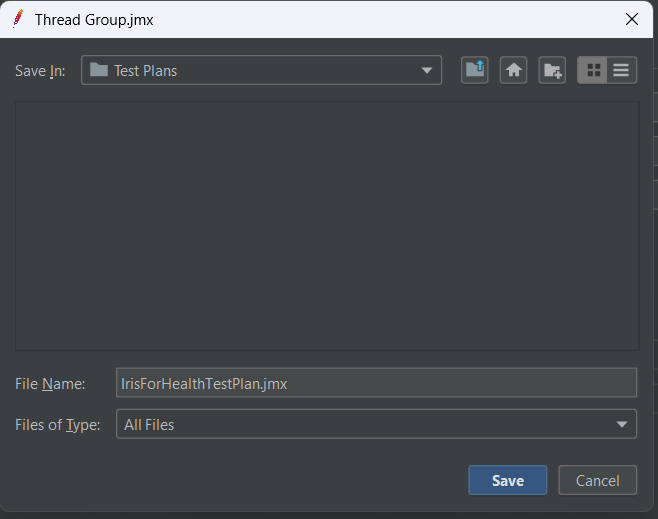
8. With all parameters configured,take a minute to save our Test Plan. Click the button Save ( ) and select any name and folder:
9. Now, Select the Thread Group again and click the button Start ( ) to run our first test:

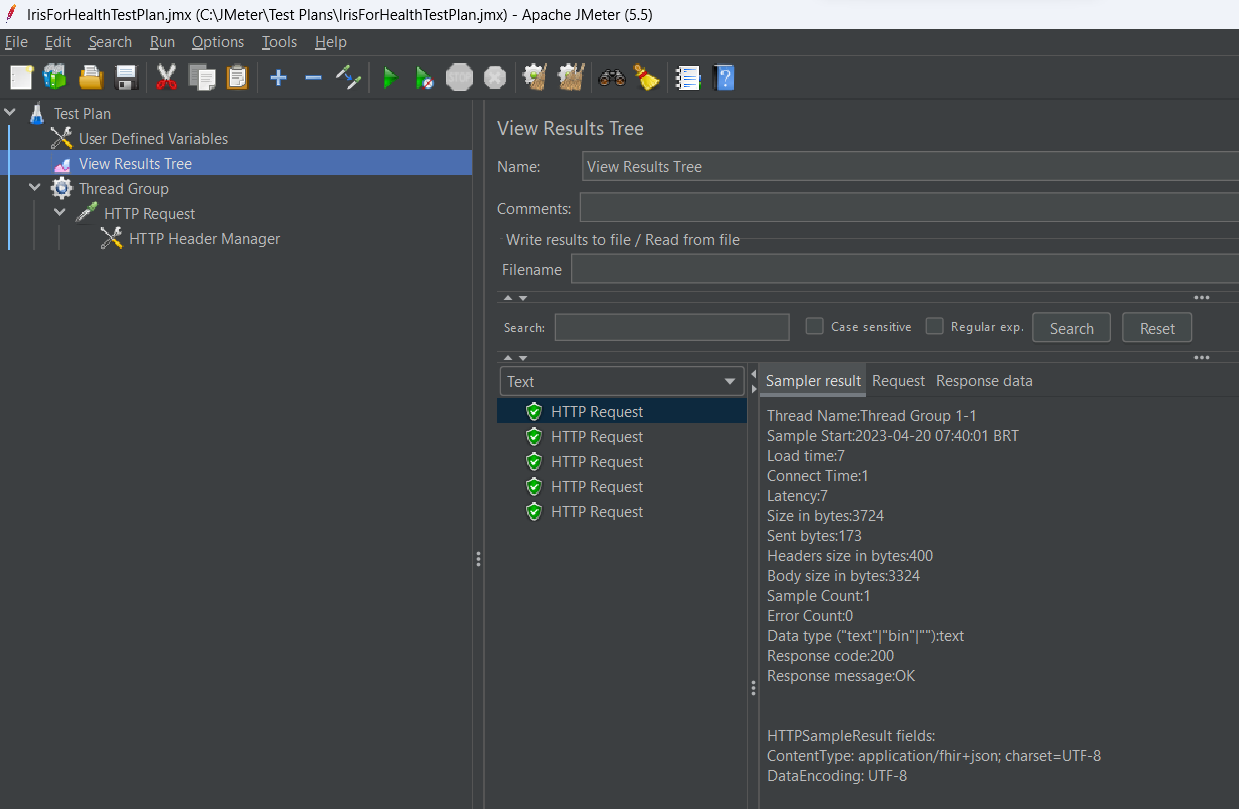
10. You can see the results for each request on View Results Tree > Sampler result tab:
Check out the Test results in an HTML Dashboard
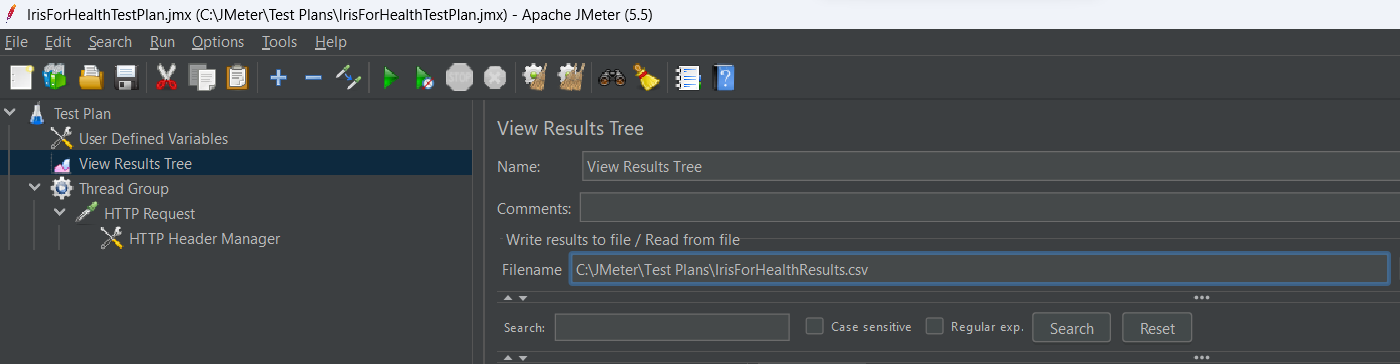
1. Select the section View Results Tree and set an arbitrary Filename:
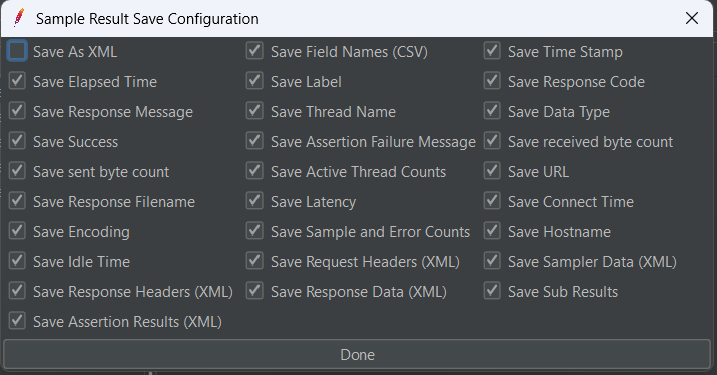
2. After that, click the Configure button and check all the options, except for Save as XML, and click the button Done:
3. Save the project (button  )
)
4. Run the Test Plan again (button ) to write the results inside the CSV file.
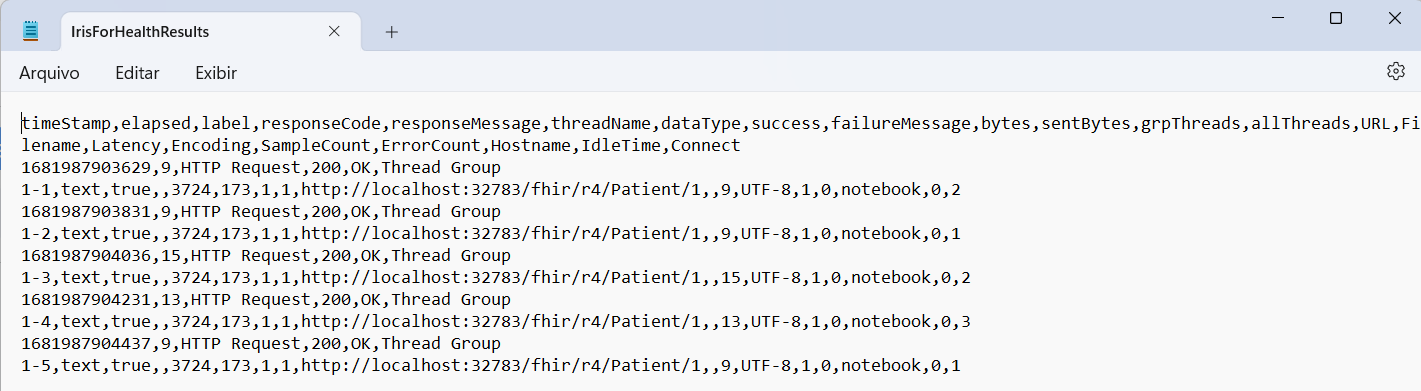
5. Check out the CSV file with the test results:
6. Those CSV results will help us generate the HTML Dashboard.
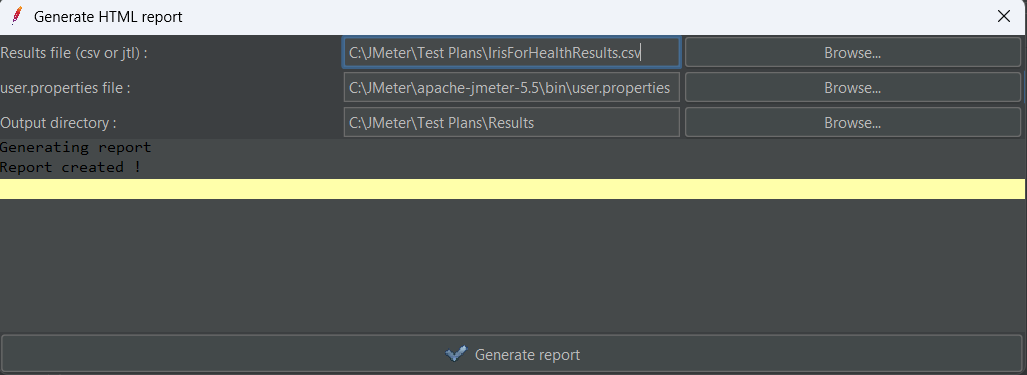
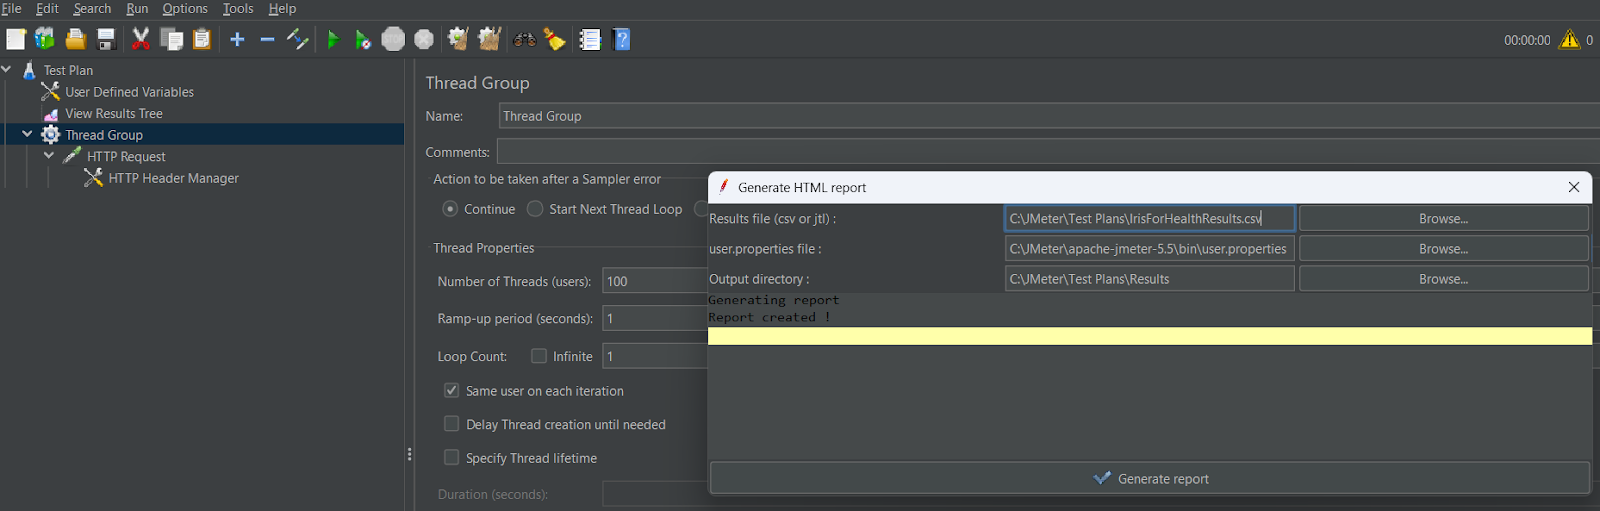
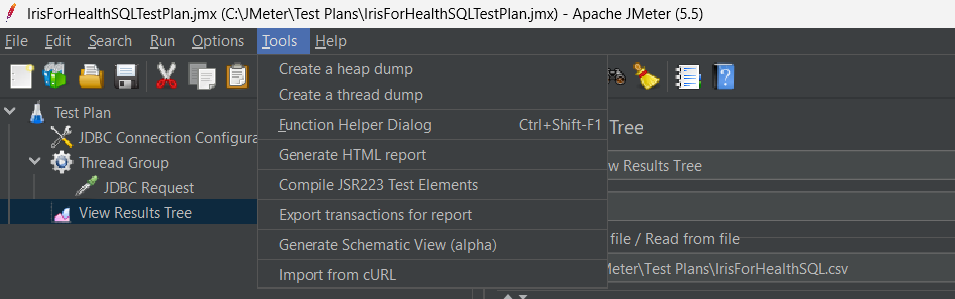
7. Go to Tools > Generate HTML Report, set the values as cited downward, and click the button Generate Report:
- Results file (CSV or JTL): path to the CSV file configured above
- user.properties file: <JMeter installation folder>\bin\user.properties
- Output directory: any folder

8. After some time, we are supposed to get a success message (Report created):
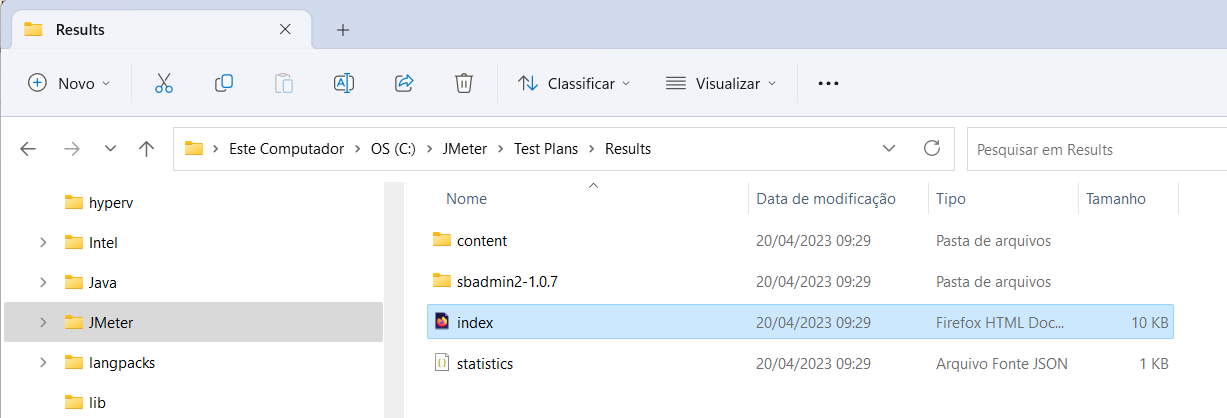
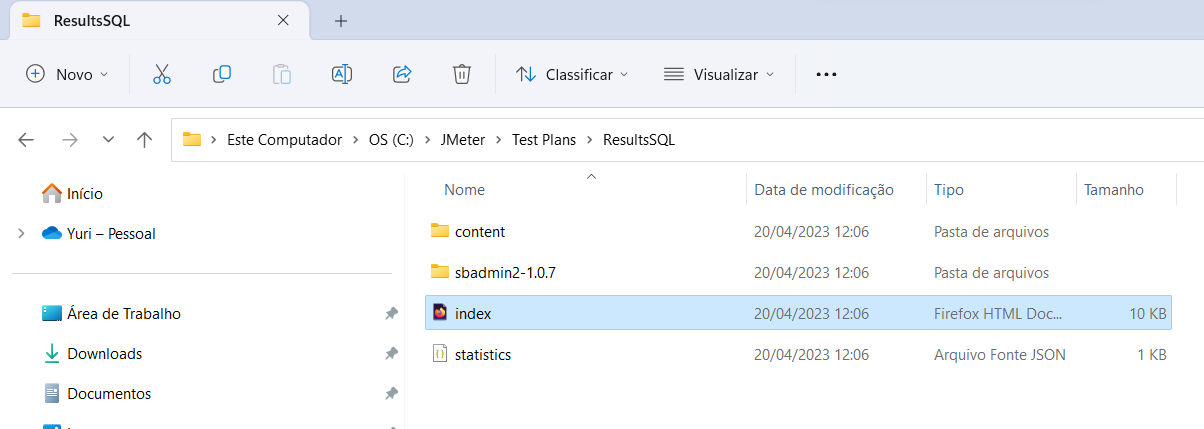
9. At this point, go to the Output directory and open index.html with your web browser:
10. You should get the request summary pie chart and a side menu to see the test results:
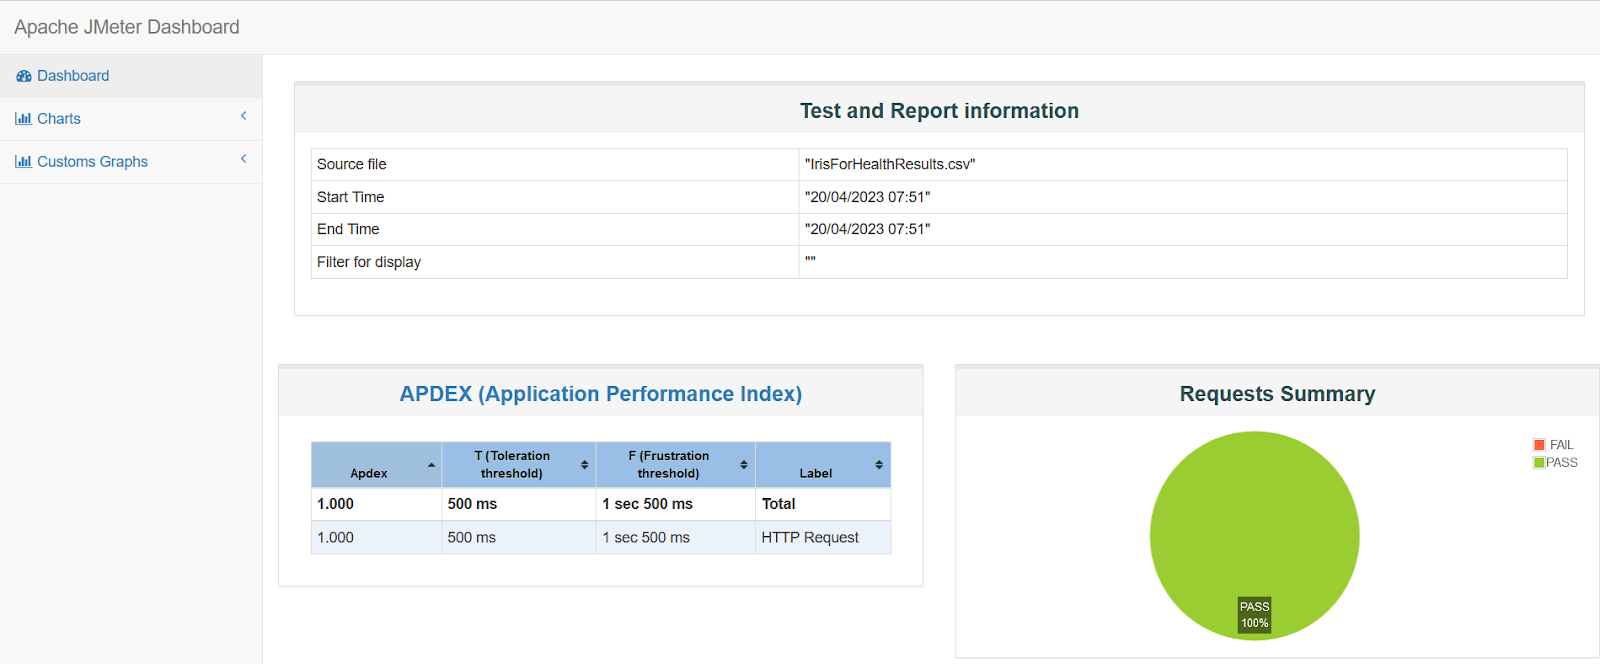
11. Click on the Charts menu and analyze Over Time, Throughput, and Response Times charts:

12. Increase the number of threads, run the test plan again, generate the HTML Dashboard report once more (remember to delete output folder content first), and check the index.html to see the results with 100 concurrent users:
13. Repeat the above-mentioned steps for 10,000 concurrent users or any other number you require.
Testing your database
In this section, you will learn how to test performance and load SQL commands. To do this, execute the steps indicated below:
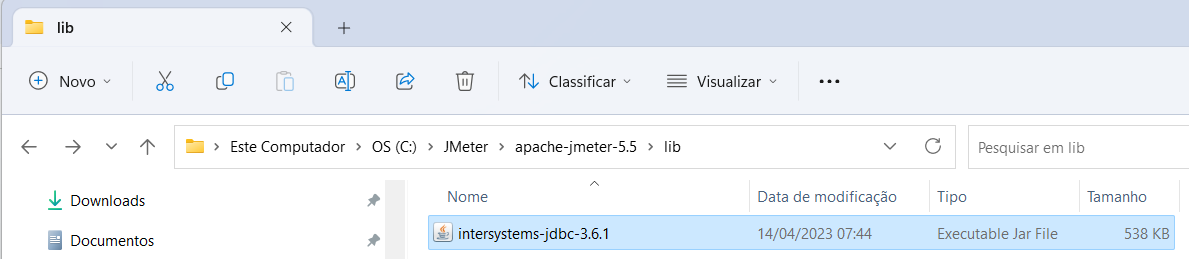
1. Download InterSystems IRIS JDBC driver from this URL: https://raw.githubusercontent.com/intersystems-community/iris-driver-distribution/main/JDBC/JDK18/intersystems-jdbc-3.6.1.jar
2. Copy the file shown in the picture to JMeter installation folder\lib (in my case it is C:\JMeter\apache-jmeter-5.5\lib):
3. When you are done with that, close your JMeter window and open it again and execute the <JMeter installation folder>\bin\jmeter.bat or jmeter.sh
4. You will see JMeter ready for a new Test Plan at this point:
5. Select the second button ( templates) to use a template to test JDBC requests:

6. Select JDBC Load Test and click the button Create:

7. JMeter should create the test elements as presented in the image:
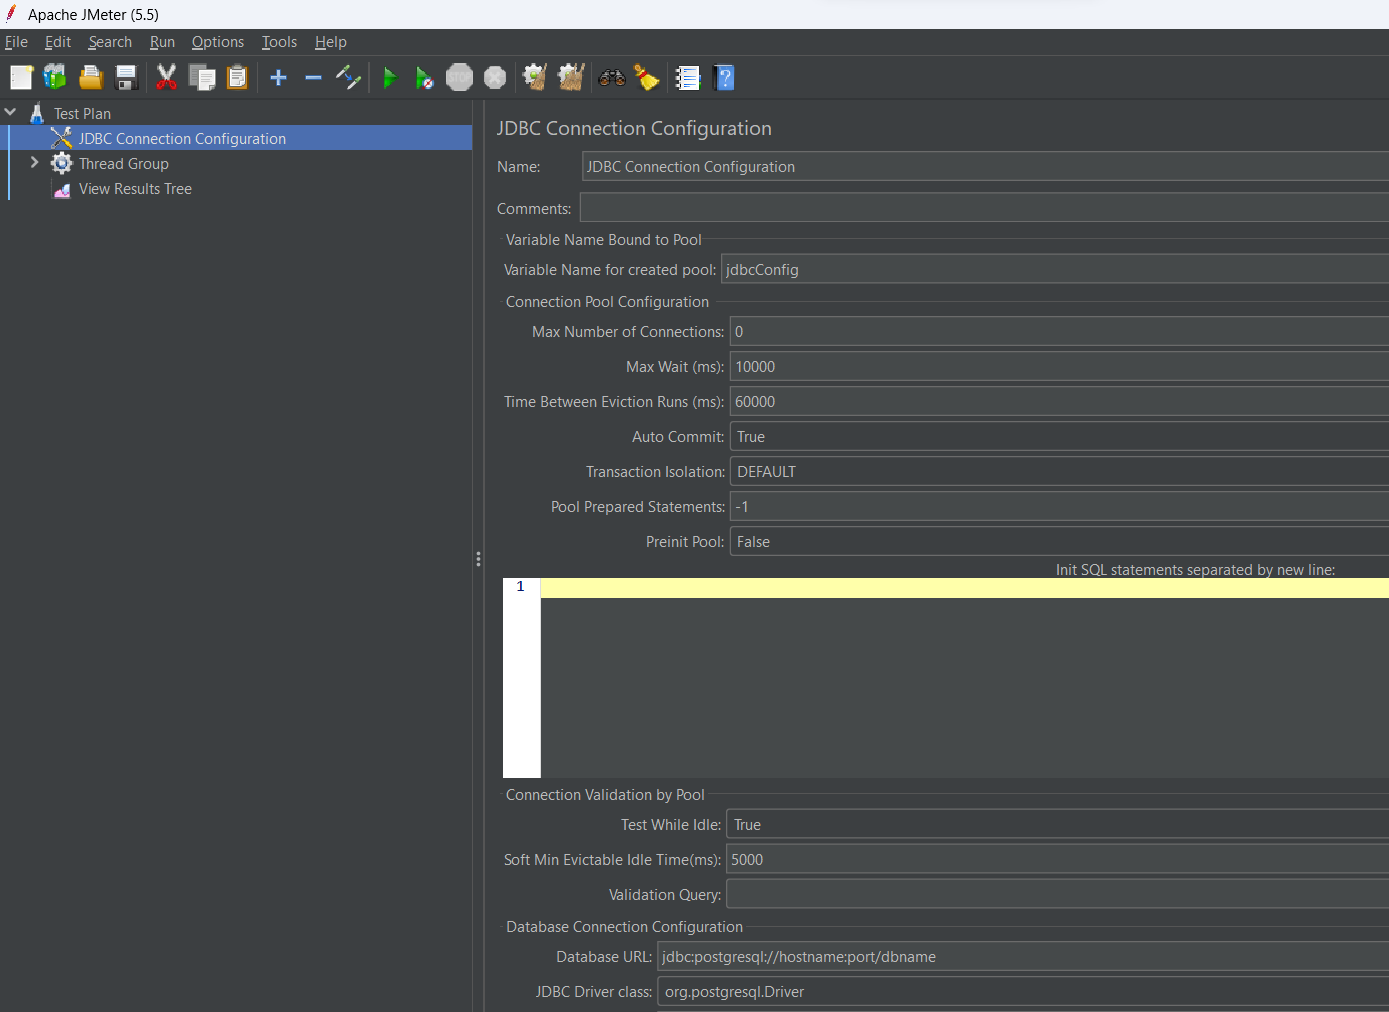
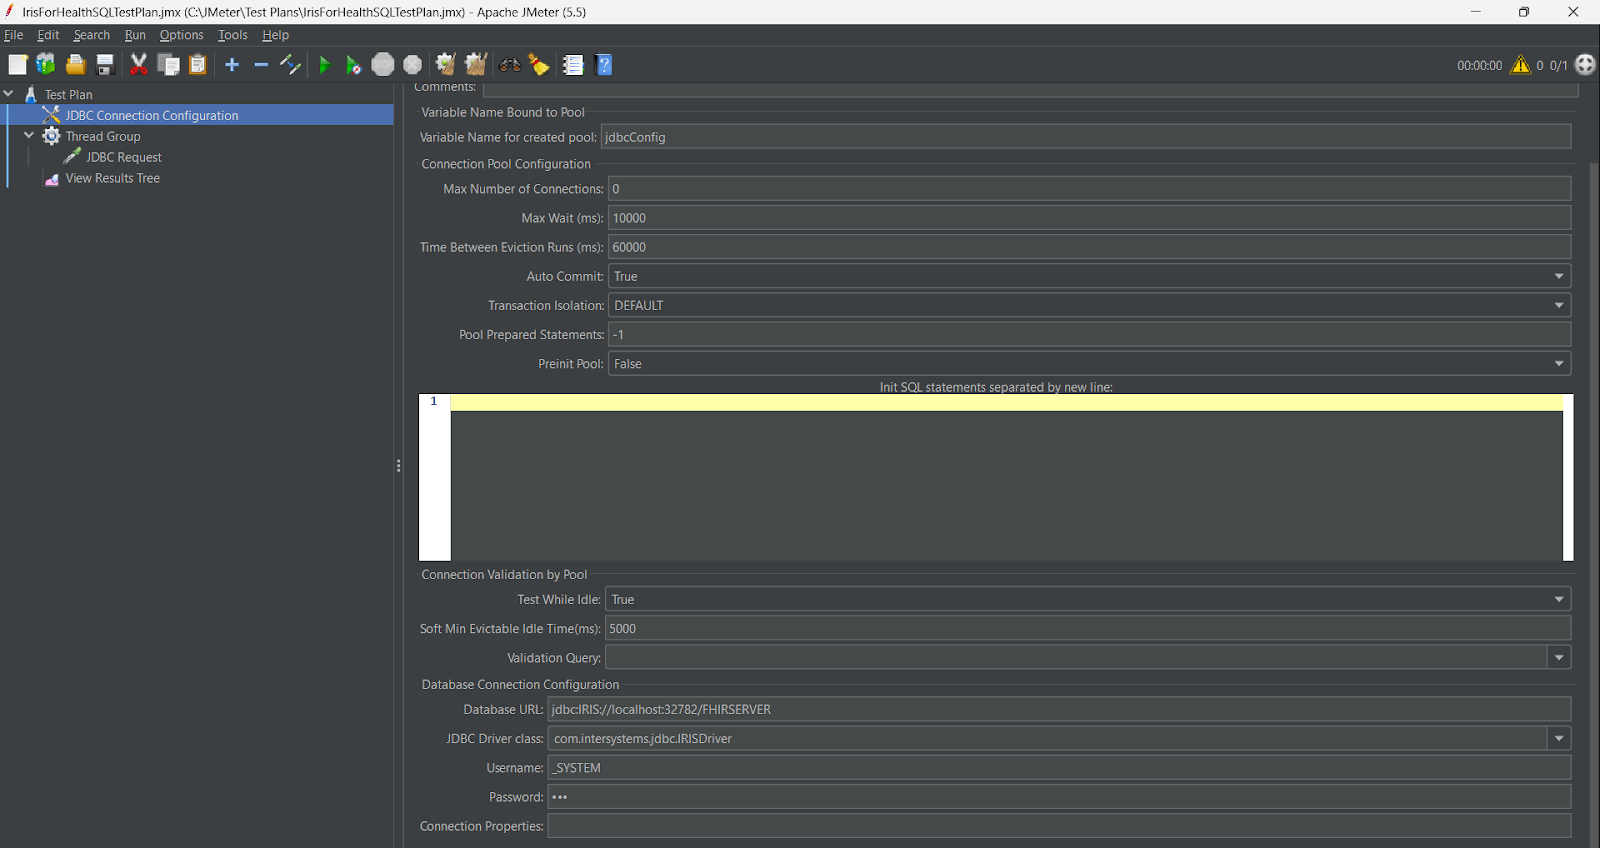
8. Select JDBC Connection Configuration and set the properties as noted beneath:
- Database URL: jdbc:IRIS://localhost:32782/FHIRSERVER
- JDBC Driver class (select Edit and put the value): com.intersystems.jdbc.IRISDriver
- Username: _SYSTEM
- Password: SYS
9. Select JDBC Request and set up the following properties:
- Query Type: Select Statement
- Query: SELECT ID1, Key, MDVersion, VersionId, _id, _lastUpdated, _profile, _security, _source, _tag, active, address, addressCity, addressCountry,addressPostalcode, addressState, addressUse, birthdate, deathDate, deceased, email, family, gender, generalPractitioner, given, identifier, "language", link, name, organization, phone, phonetic, telecom FROM HSFHIR_X0001_S.Patient
10. Select View Results Tree and set up the next properties:
- Filename (any folder and file name): C:\JMeter\Test Plans\IrisForHealthSQL.csv

11. Click the button Configure and select all the options apart from Save as XML, and click the button Done:

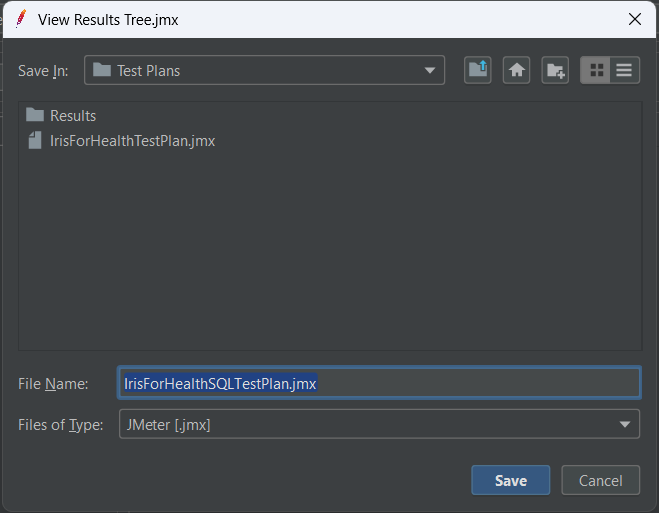
12. It's time to immortalize your project. Click the Save button ( ) and store your project in any folder and file:
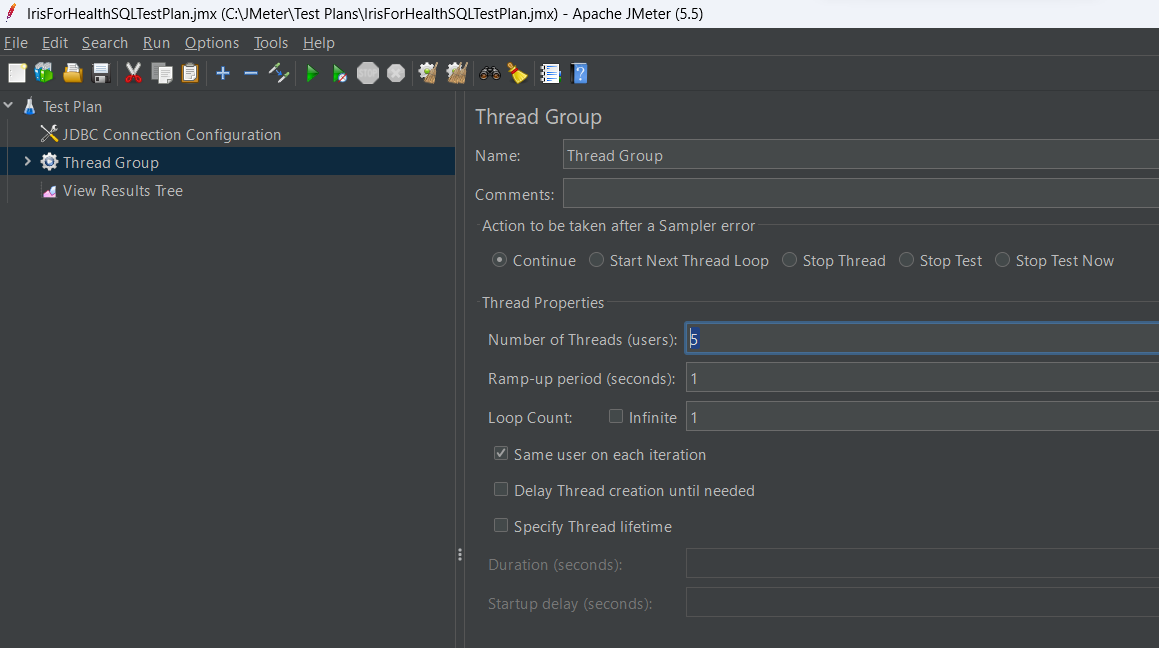
13. Select the Thread Group and change the Number of Threads (users) to 5:
14. Save the changes () and execute the test ( ).
).
15. Go to Tools > Generate HTML Reports:
16. Set up the values documented below to generate the HTML report:
- Results file (CSV or JTL): folder and file for results CSV
- user.properties file: JMeter installation folder\bin\user.properties
- Output folder: any folder

17. Go to the Output directory and open index.html:
18. See your test results for the SQL statement tested: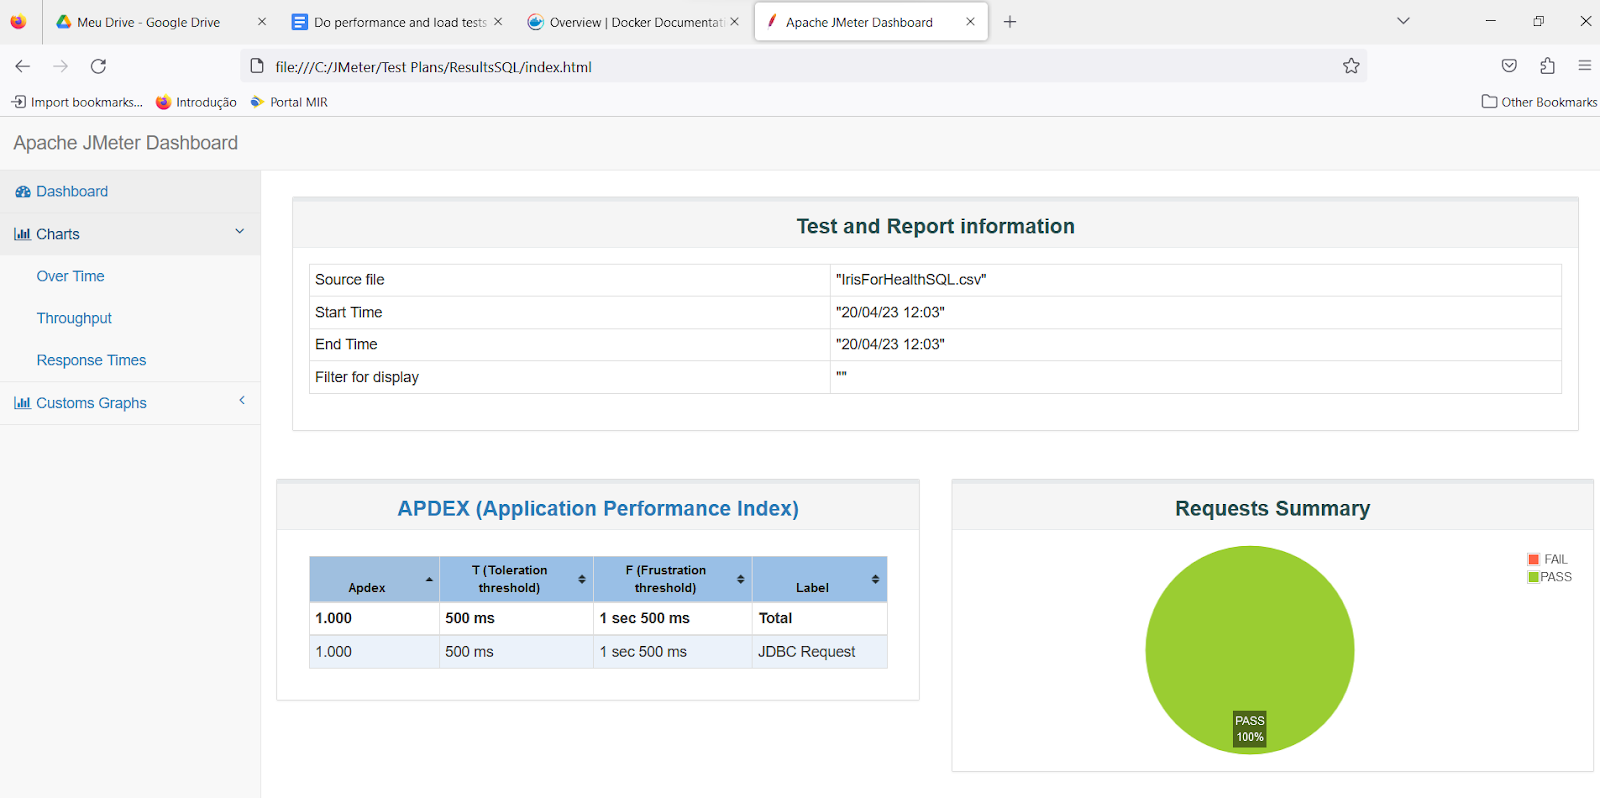
We can include many SQL or REST API requests into the same Test Plans and write custom scripts to do advanced tests. To know more about this skim through the JMeter documentation: https://jmeter.apache.org/usermanual/index.html.
Enjoy it!