How to develop in IRIS BI (also with change management)
IRIS BI
We offer you to embed business intelligence into your applications in order to give your users an opportunity to ask and answer sophisticated questions about their data. Typically, your application will include customizable dashboards that can provide insight into data from Business Intelligence models known as cubes.
In contrast with traditional BI systems that use static data warehouses, Business Intelligence keeps being constantly synchronized with the live transactional data.
We will use DeepSee User Portal as a dashboard builder and DeepSeeWeb - as the display of dashboards.
Logging on to Business Intelligence
To log on to Business Intelligence, do the following in the Management Portal:
- Switch to the appropriate namespace as follows:
- Select Switch.
- Choose the namespace.
- Click OK.
- Select Analytics. The system always displays a list of the tools for Business Intelligence:
- Architect — Enables you to define cubes.
- Analyzer — Allows you to define pivot tables.
- User Portal — Launches the User Portal, which includes the Analyzer and the Dashboard Designer.
- Tools — Provides access to the MDX Query Tool, the Term List Manager, Quality Measures, and the Model Browser.
- Admin — Provides access to the Business Intelligence Logs, the Folder Manager, Settings, and the Cube Manager.
The Management Portal provides access to all Business Intelligence tools, including the back-end tools such as the Architect and the User Portal. Since the User Portal is intended for end users, it does not enable most users to return to the Management Portal.
Architect
First of all, you need to define the data structure in the architecture. To do that, you need to create a cube based on the class. The Architect enables you to define cubes and subject areas. You can use this tool, Studio, or both.
The Class Viewer provides a constructive view of the class properties of your base class (apart from relationship properties). It makes it easy to create InterSystems IRIS Business Intelligence elements based on those properties. It is also critical to know that although this view provides a convenient way to access some properties, you can likewise use a source expression to access any data. These source expressions are evaluated when the cube is built. Thus they do not affect your runtime performance.
You can fine a detailed guide on how to build a cube here
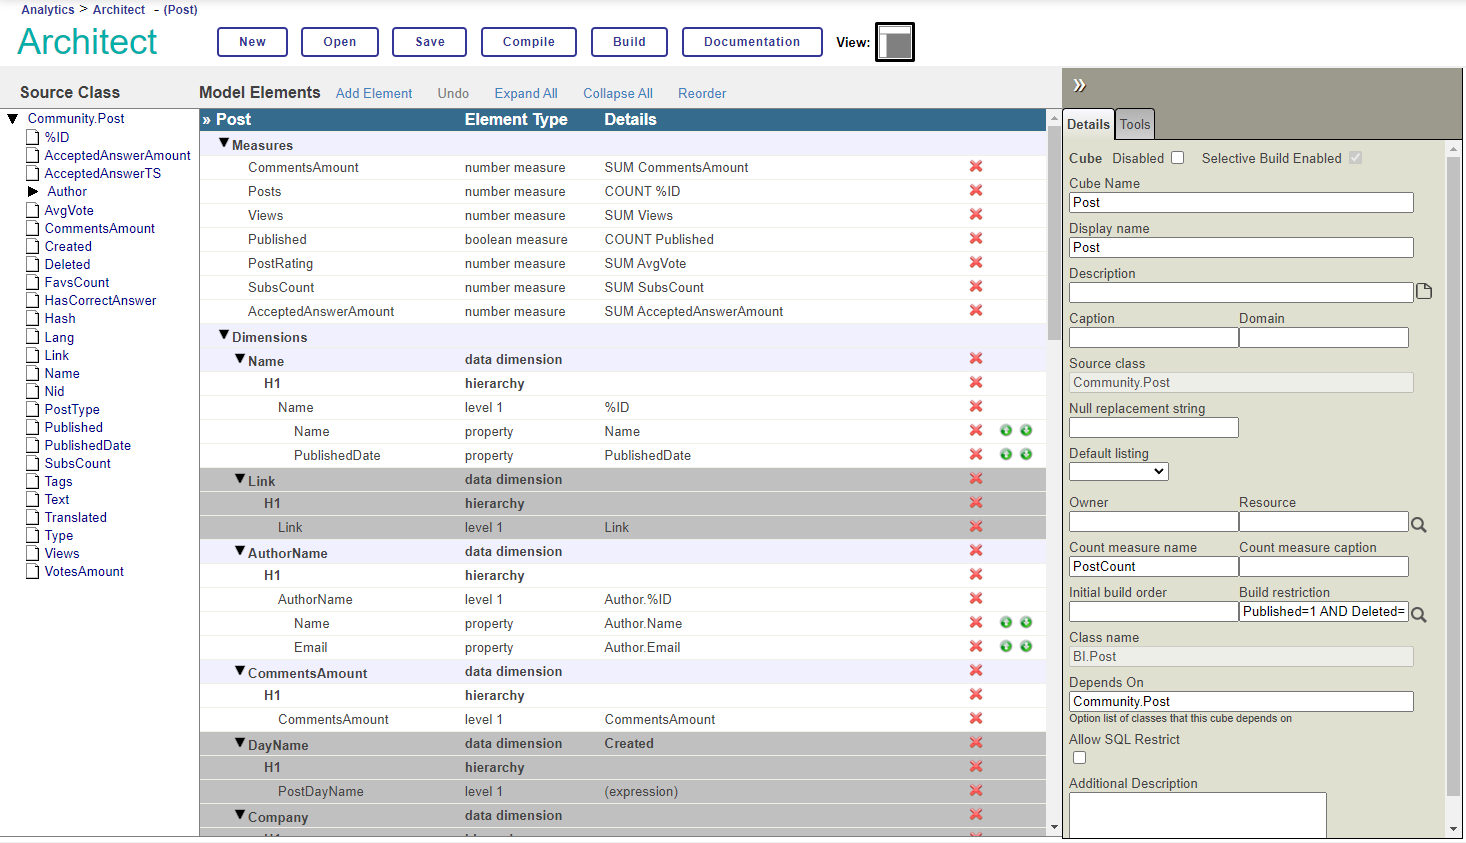
Example of a finished cube
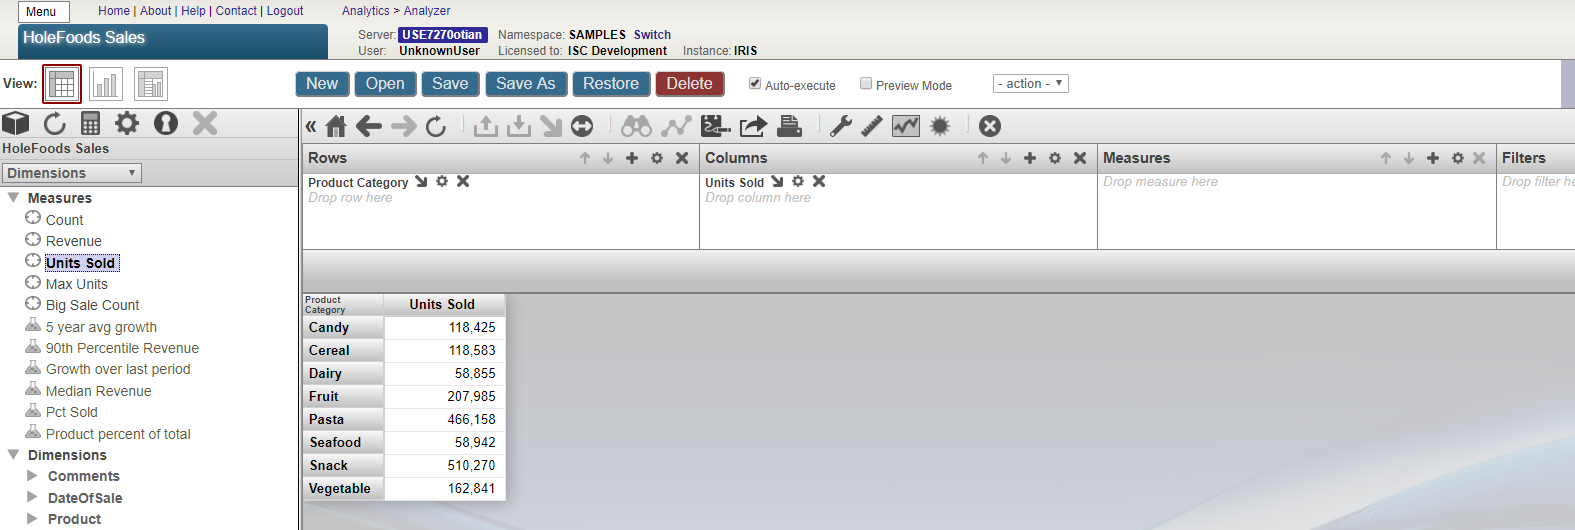
Creating Pivot Tables
Once you have built the cube, the next step is to create a pivot table to use in DeepSeeWeb. To do this, use the Analyzer tool. This tool enables you to define pivot tables. It looks like the following image.
Selecting a Subject Area
A subject area provides the elements that you use as the basis of any pivot table. To select the subject area:
- Click the Change button
or click the Select Subject Area link.
- Click the name of the subject area.
- Click OK.
The Model Contents area lists the contents of the subject area that you are currently viewing. For instance, this area might look like this initially:
If you have not worked with the current subject area before, it can come in handy to examine its contents. First, use the drop-down list to select the kind of item to display in this area. Select one of the following:
- Dimensions — Choose this to display the basic model defined in this subject area. In this case, the Model Viewer can show you the following sections:
- Pivots — Pick this to display any pivot tables defined in this subject area.
- Quality Measures — opt for this to display any quality measures available in this subject area.
- Detail Listings — Select this to display any detail listings defined in this subject area.
The purpose of the Model Content area is to enable you to create pivot tables. To make it happen, drag and drop items into the Pivot Builder area on the right, as described in the next section.
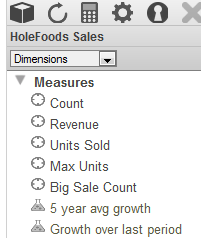
Measures
To display a list of measures, choose Dimensions from the drop-down list in the Model Contents area. Then expand the Measures folder. This folder lists all measures in the subject area. For example:

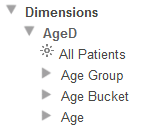
Dimensions
To display a list of dimensions, select Dimensions from the drop-down list in the Model Contents area. Then expand the Dimensions folder. This folder lists the dimensions and the levels, members, and properties that it contains. It might also list related subject areas, with their dimensions, levels, and so on.
DeepSee User Portal
The User Portal is intended to be utilized directly by end users (in contrast to such back-end tools as Studio and the Management Portal). The User Portal is designed in a way which should enable you to do the following tasks:
- View and use dashboards and pivot tables as well as all pieces of information which contain a key. For Ensemble users, this information can include Ensemble business metrics. For DeepSee users, this information is displayed like aggregated views of your data that you can investigate in various ways. You can organize these items into folders for easier management. You can also attach keywords to those items to make it easier to find them more quickly next time.
- Share your dashboards and pivot tables with other users. The User Portal is a shared environment. It means that the same items are visible to all users who have access to the User Portal for a given Caché namespace.
- Create dashboards, which generally display pivot tables and other elements such as meters and scorecards. Dashboards are typically intended to address specific business needs.
- Access the DeepSee Analyzer that can help you create pivot tables or perform ad hoc analysis of data.
- Share and access links to web pages and Zen reports.
- (For Ensemble workflow users) Manage your workflow tasks.
In a supported browser, go to the following URL:
http://localhost:57772/csp/samples/_DeepSee.UserPortal.Home.zen
or in Portal Home follow: Analytics -> User Portal
The User Portal looks like the following image:
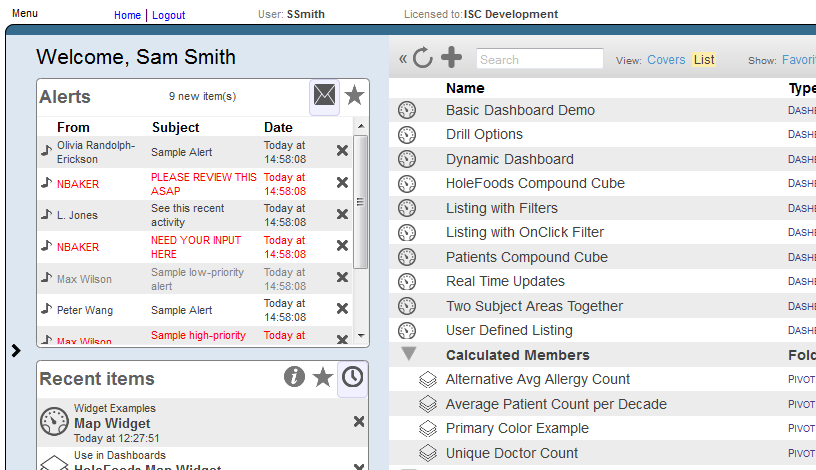
- The left area contains worklists, which are rectangular areas that have tools. For details, check out “Using Worklists in the User Portal.” In SAMPLES, these areas are initially blank.
- The main area on the right shows the public DeepSee pivot tables, dashboards, and other items. Here you can open items, delete them, and mark them as favorites. You can also expand or collapse the folders. The top area provides a search option. Regarding a dashboard, this area displays the title of the dashboard if there is one. Otherwise, this area indicates the name of the dashboard. This area does not show items that are marked as private. If you are an Ensemble workflow user, the main area will also display an item labeled Workflow Inbox.
- The Menu link in the upper left corner contains options to create and open dashboards and pivot tables, and perform other tasks in DeepSee. If you are assigned the
%Developerrole, this menu also includes an option to access the Management Portal. - The Home link at the top displays this page.
- The Logout link enables you to log out.
The User Portal is a shared environment. Many of the items you see are also visible to other users.
About Pivot Tables and Dashboards
Pivot tables are central to InterSystems DeepSee; they select and aggregate data. The following figure shows an example of a pivot table that illustrates the number of patients and the average allergy count per patient, grouped by age and gender.
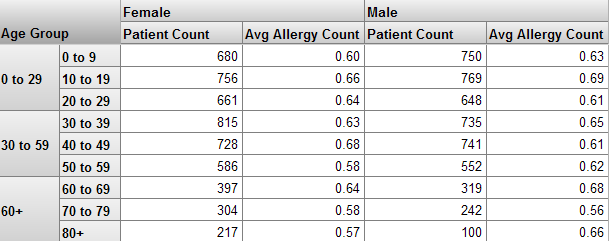
Using this sample as a reference, let us discuss the key terms in DeepSee:
- A level is used to group the source data. A level has members. Each member, in turn, corresponds to a specific set of records in the source data. For instance, the
Age Grouplevel has the members0-29,30-39, and60+. TheGenderlevel has the membersFemaleandMale. - A measure is a value displayed in the body of the pivot table. It is based on the values in the source data. For a given context, a measure aggregates the values for all applicable source records and represents them with a single value. For example, the measure
Patient Countis the number of patients, and the measureAvg Allergy Countis the average number of allergies per patient.
You typically see a pivot table within a dashboard, as follows:
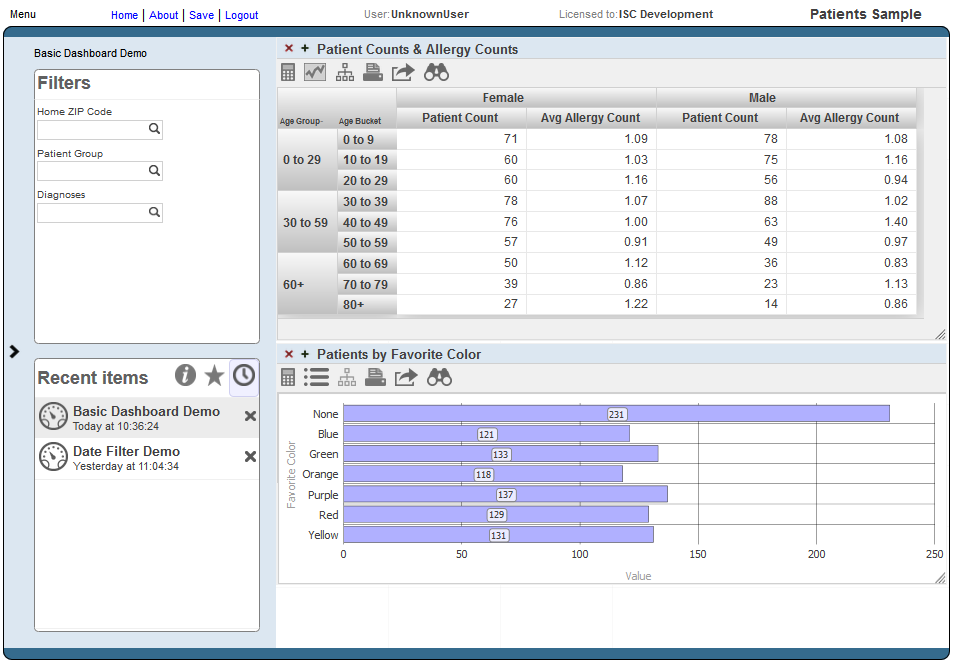
Pay attention to the multiple filters (shown in the Filters box) that this dashboard includes. You can use them to filter the items on this dashboard.
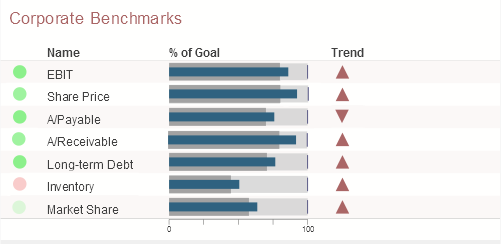
Dashboards can include other kinds of elements, such as meters and scorecards. A scorecard shows multiple rows of data in a tabular format that also contains features including value-dependent lamps and arrows. For instance:
A meter shows one or more values in graphical objects as depicted in the following image:

DeepSeeWeb
Description and installation instructions can be found here
DeepSeeWeb is a Renderer for DeepSee Dashboards in a Browser with MDX2JSON as a Server Side and JS web-client. Developed using AngularJS and Bootstrap.
After all the steps are done, you need to follow the link:
http://{host}:{port}/dsw/#/{namespcae}/{folder}/{dashboard}.dashboard
Example:
http://localhost:57772/dsw/#/IRISAPP/Test/Countries.dashboard
DeepSeeWeb will look like the following:

Comments
Thanks @Evgeniy Potapov ! Good article! What about change management for Cubes, Pivots and Dashboards?
Nice Article