Agent IRIS*
* In-Platform Agent-Based Simulation of a Connected Factory Cluster
Author: Sergey Lukyanchikov, InterSystems
1. Purpose
In this paper we prototype and explore how multiple agent-based models of robotic factories connected to other robotic factories (represented by their respective models) can be orchestrated using an all-purpose data platform – thereby simulating descriptive and predictive properties of a group of factories (a factory cluster). For the underlying prototype, NetLogo suite was used to do factory agent-based simulation (re-using “Robotic Factory” model [1]) while InterSystems IRIS data platform was used for NetLogo orchestration and factory/cluster end-to-end simulation.
The high potential that inter-factory linkages simulation has in integrated production network setting, was established in numerous academic and applied studies (e.g., Ferdows and Carabetta, 2006 [2]) since long ago. For research on the effects from various configurations of factory clusters, we would refer the reader to those studies. In this text, we focus on functional benefits from doing factory cluster simulation using agent-based approach.
The advantages of in-platform implementation of factory cluster simulations have been materialized more recently due to the evolution of computers and software making feasible parallel computations, near-real-time integration exchanges and seamless use of a full spectrum of modeling toolsets (e.g., Ng et al., 2011 [3]). Again, for research on the effects from various in-platform implementations of factory cluster simulation, we would refer reader to appropriate studies. In this text, we focus on the effects from orchestrating agent-based factory cluster simulation via an all-embracing universal data platform.
The three NetLogo interconnected robotic factory models participating in the prototype can also run outside of the data platform environment of InterSystems IRIS – thus preserving prototype’s agent-based simulation functionality but losing in-platform orchestration controls as well as cluster-level descriptive and predictive analytics.
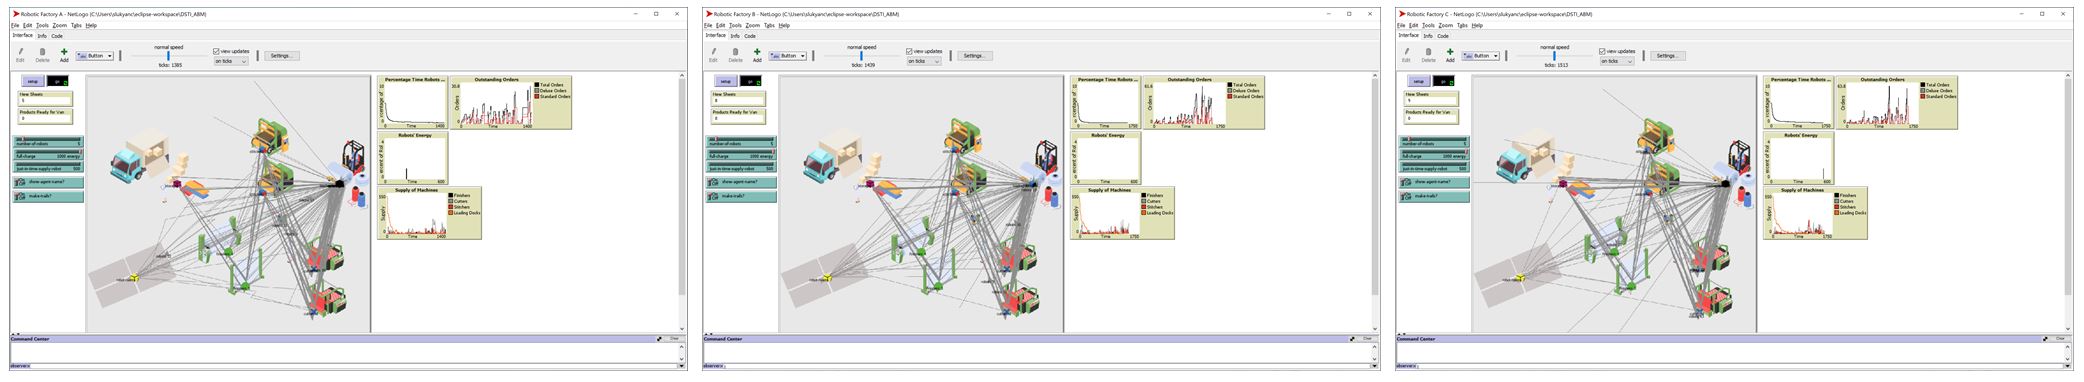 Figure 1: Three NetLogo interconnected robotic factory models (adaptation of U. Wilensky’s “Robotic Factory” model [1])
Through this paper, visual material was created at various stages of the prototype development illustrating implementation progress.
2. Entities, state variables, and scales
In the below table we summarize entities, state variables and scales:
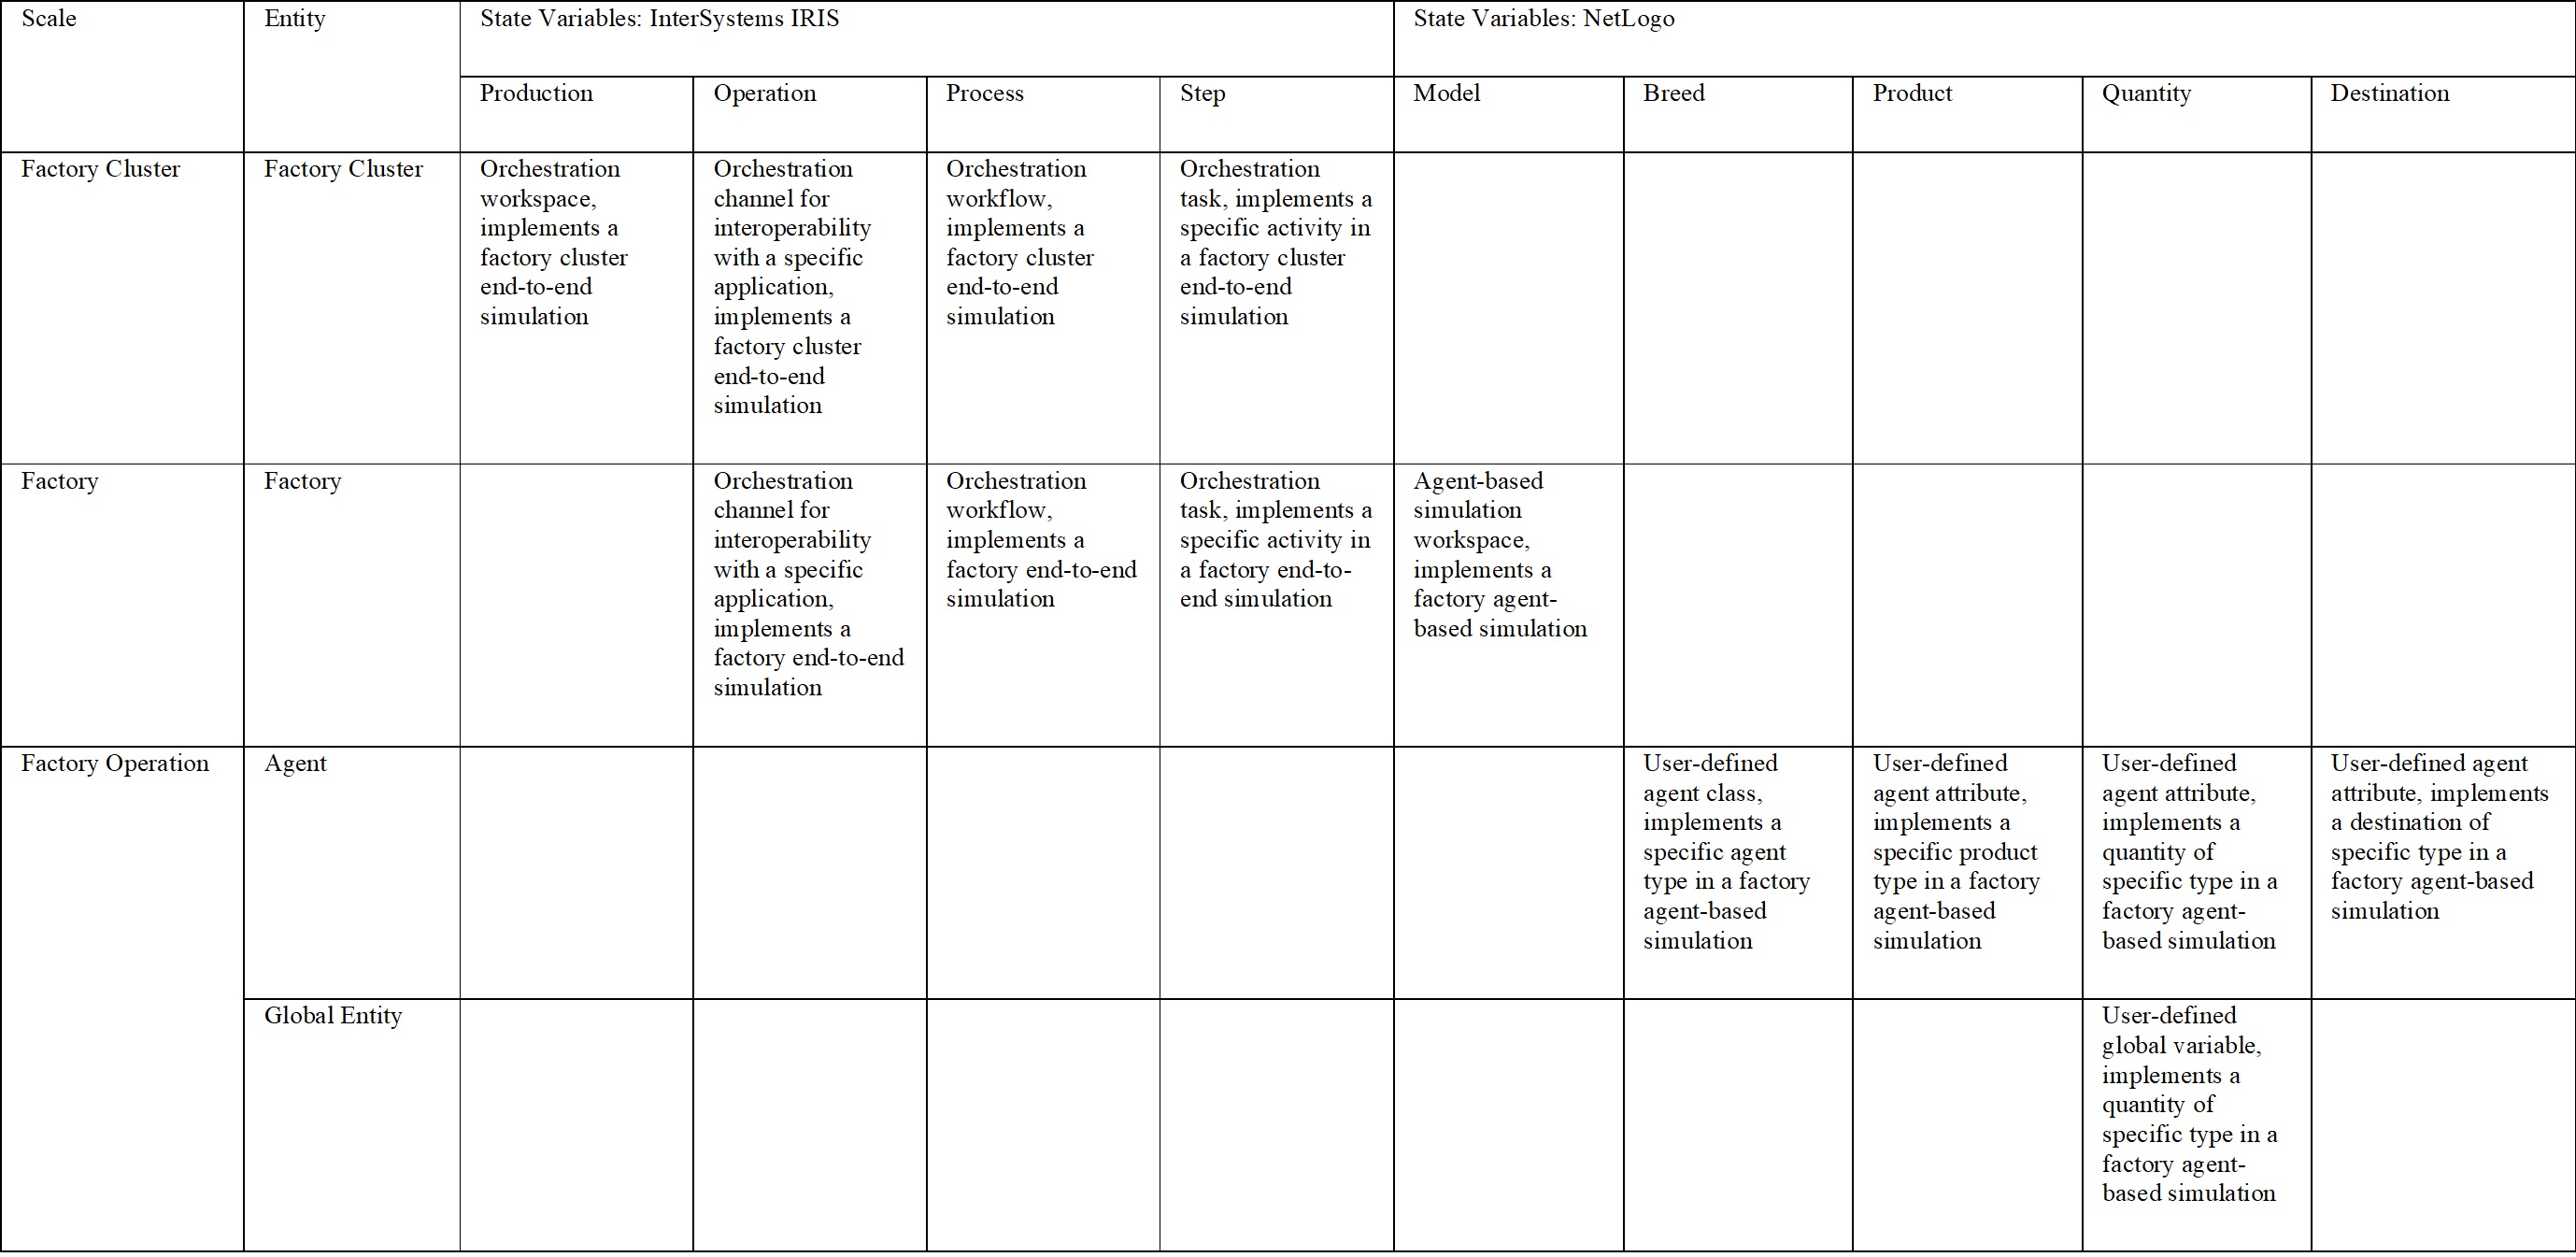 Table 1: Entities, state variables, and scales
2.1 Scales
We distinguish three scales: factory cluster – where interconnected factories are regarded as a single unit, factory – where a factory is considered a single unit, and factory operation – where factory parts are modeled individually.
Temporal dimension is captured through both hang and wait commands respectively in InterSystems IRIS and NetLogo. Both allow pacing execution speed to fit virtually any use case: from reproducing actual time scale to going at accelerated pace (e.g., for simulation as part of a forecasting mechanism, etc.).
Spatial dimension is captured using NetLogo spatial (2D) coordinates in combination with agents implemented as “patches”. Spatial coordinates (plus “world wrapping” options) allow representing virtually any factory floor layout.
2.2 Entities
Entities operating at cluster and factory scales, coincide with those scales: factory cluster – a set of factories connected via their inputs/outputs, and factory – a factory servicing its flow of incoming customer orders and providing its output as input to the other factories.
Factory operation scale is shared by two entities: agents – robots, production machinery, warehouses (loading docks and storages); and the global entity – a set of all the global variables used in NetLogo models implementing both reality-mappable and abstract attributes.
2.3 State Variables
Each of the major components of the prototype that we explore, InterSystems IRIS and NetLogo, has its own state variables. InterSystems IRIS provides the following state variables: production (more), operation (more), process (more), and step (more). Their descriptions can be found in Table 1 above, we will just provide examples of each variable materialized in InterSystems IRIS:
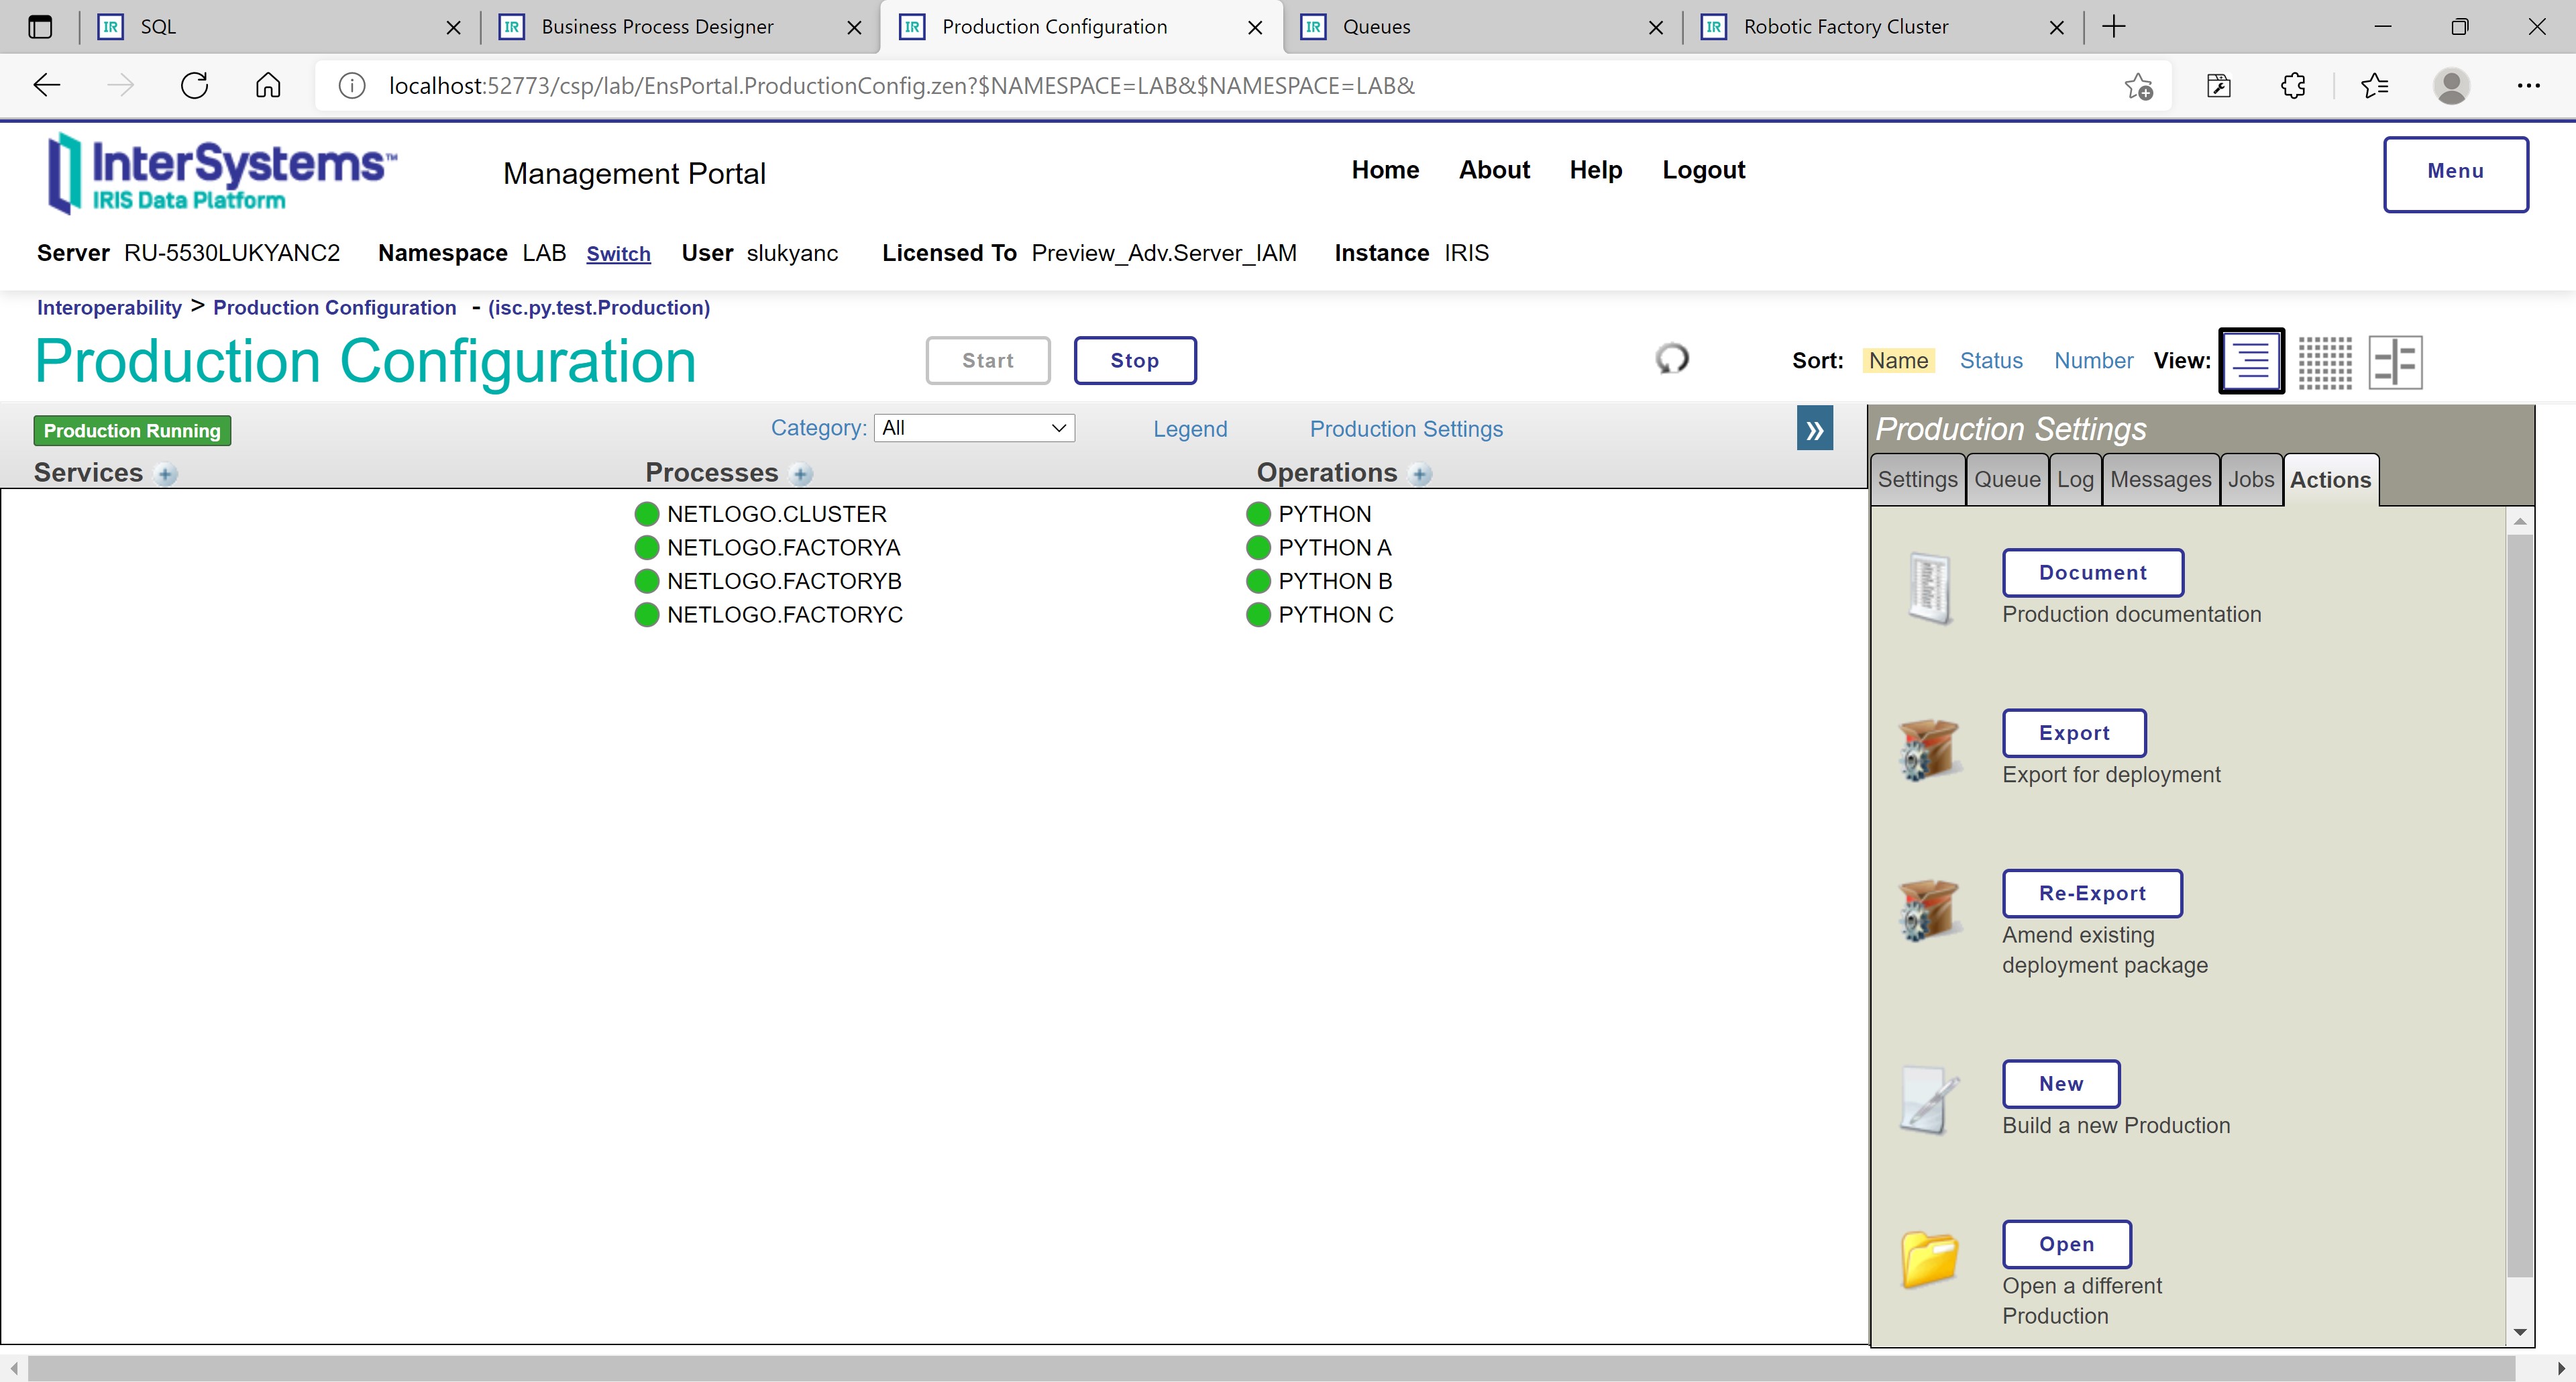 Figure 2: InterSystems IRIS production containing operations and processes
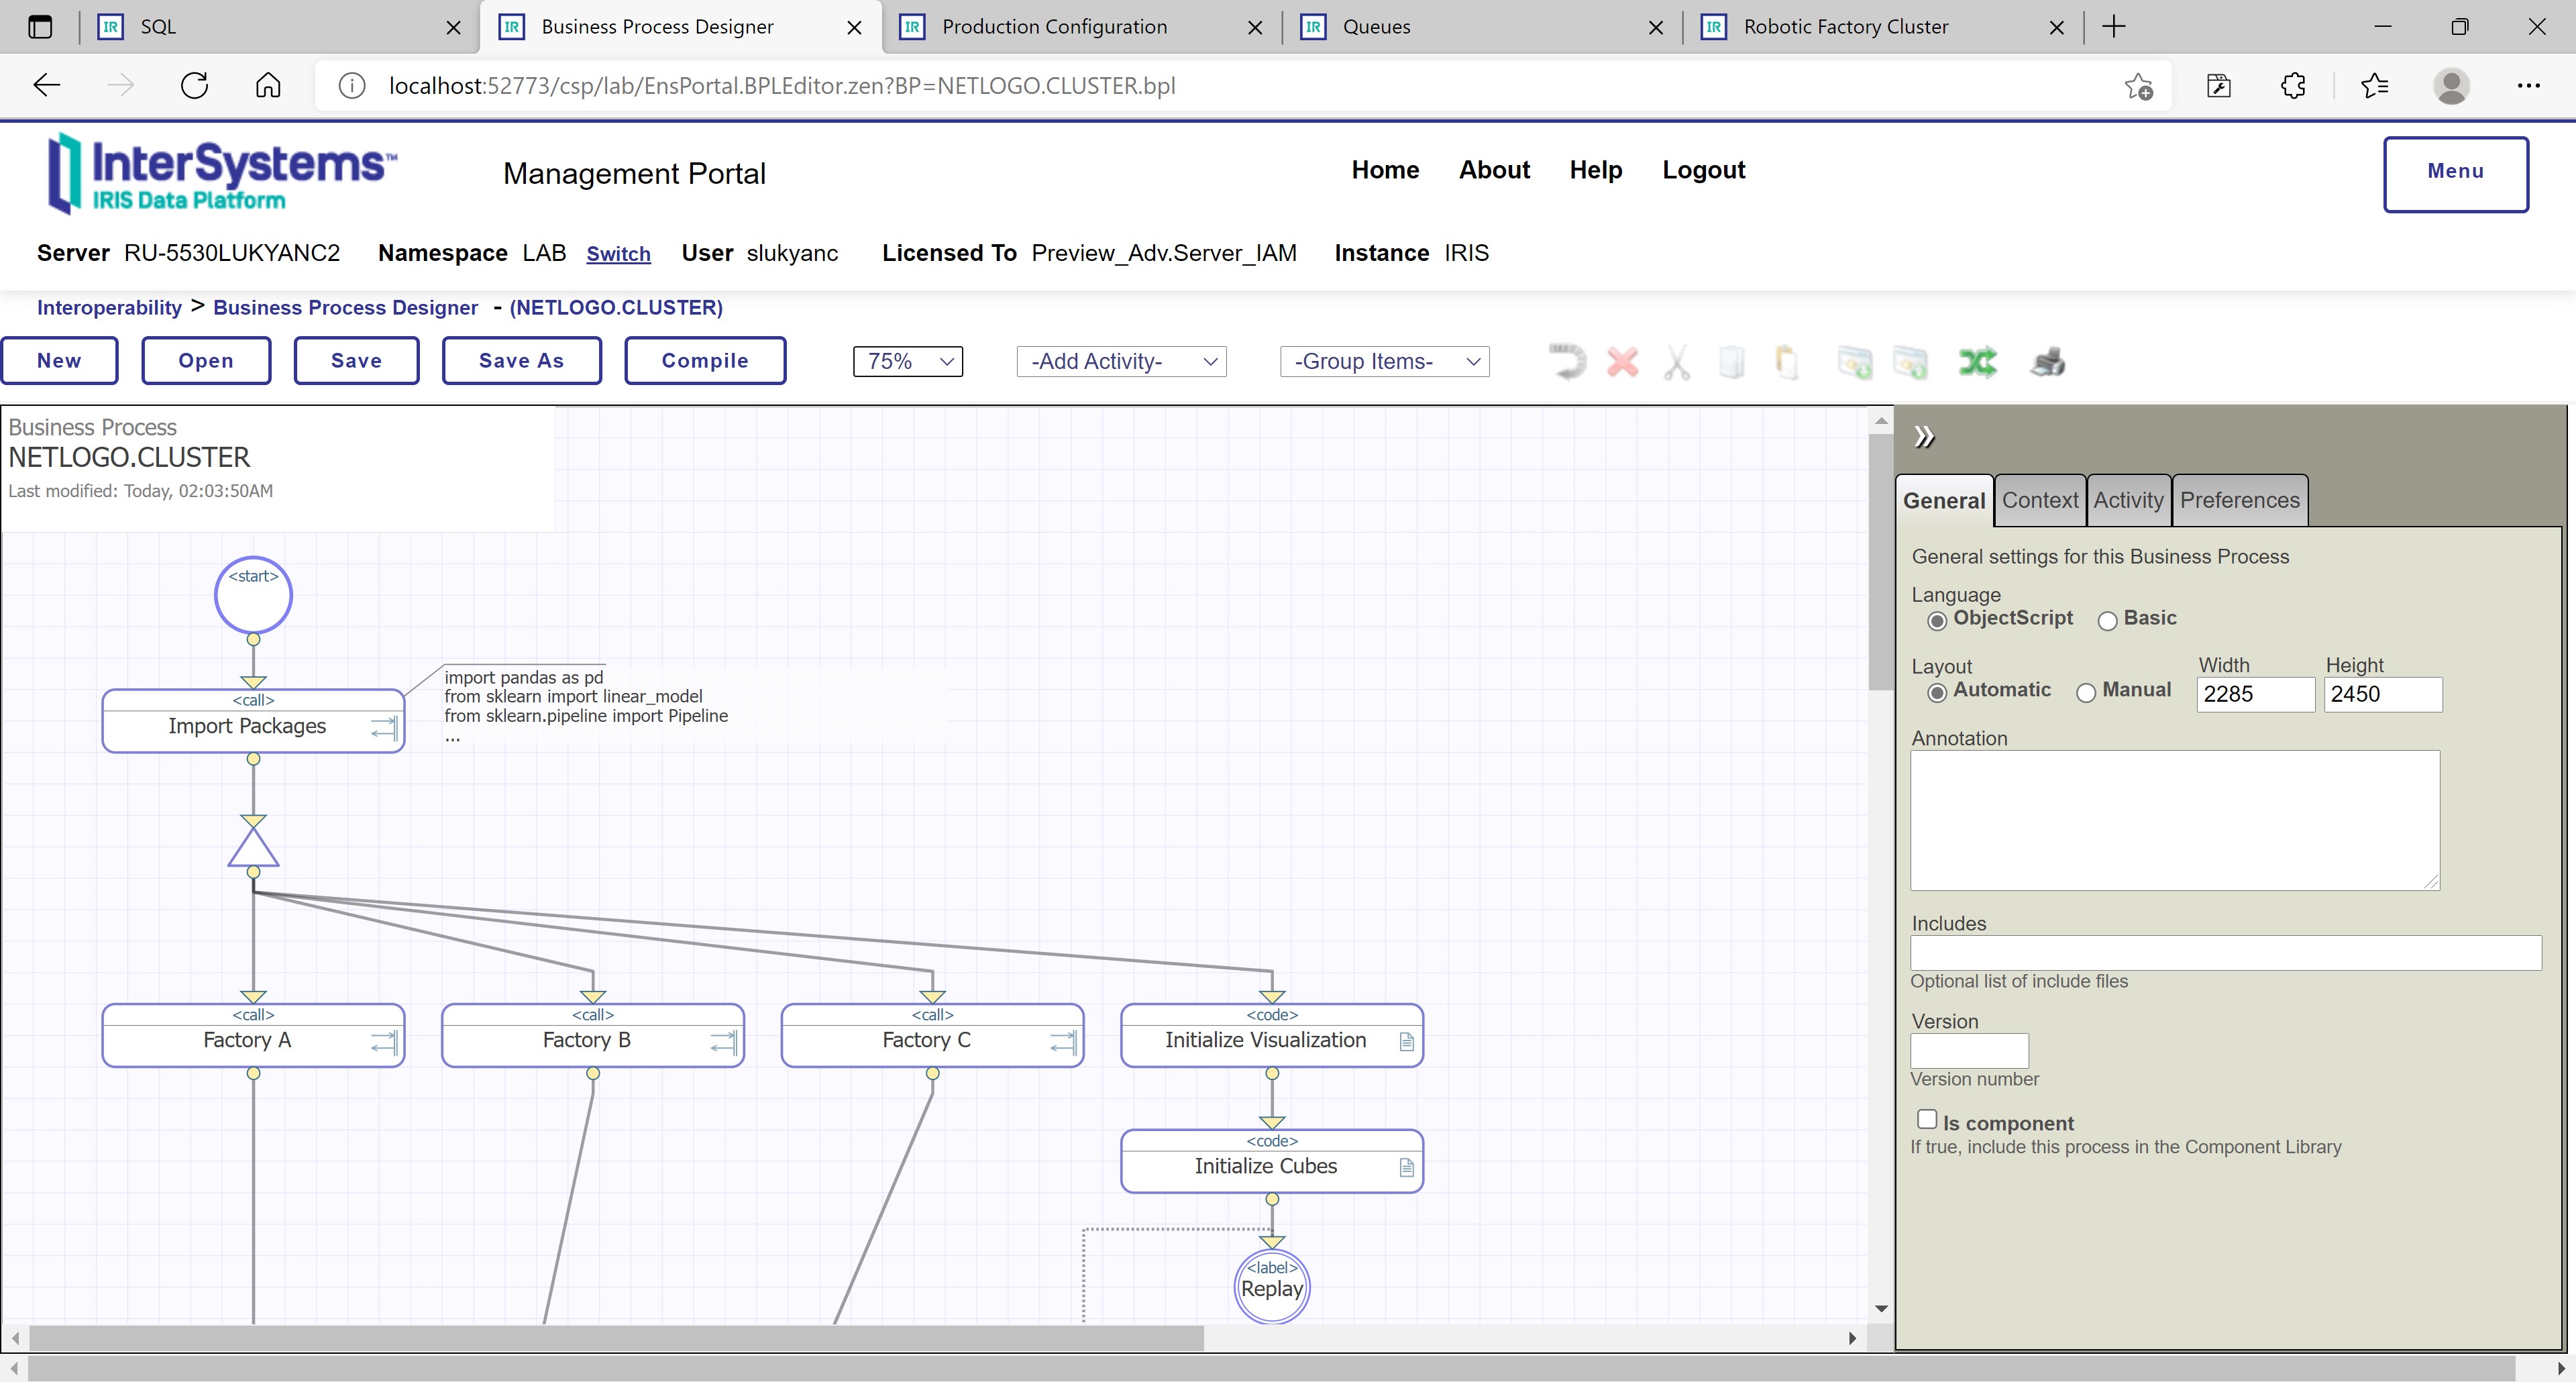 Figure 3: InterSystems IRIS visual process editor with steps in a process workflow
Operations and processes included on isc.py.test.Production production (see Figure 2 above) are all based on ML Toolkit extensions for InterSystems IRIS, in particular, on community Python Gateway component. One of the operations – PYTHON – implements cluster-level interoperability with Python (installed on the same computer as InterSystems IRIS). The other three – PYTHON A/B/C – implement factory-level interoperability with NetLogo via Python (using Python OS-level process access and management functions). Process NETLOGO.CLUSTER orchestrates cluster-level end-to-end simulation, processes NETLOGO.FACTORYA/B/C orchestrate factory-level end-to-end simulations.
The state variables provided by NetLogo are model (more), breed (more), product (more), quantity (more), and destination (more). Their descriptions can be found in Table 1 above, we will just provide examples of each variable materialized in NetLogo:
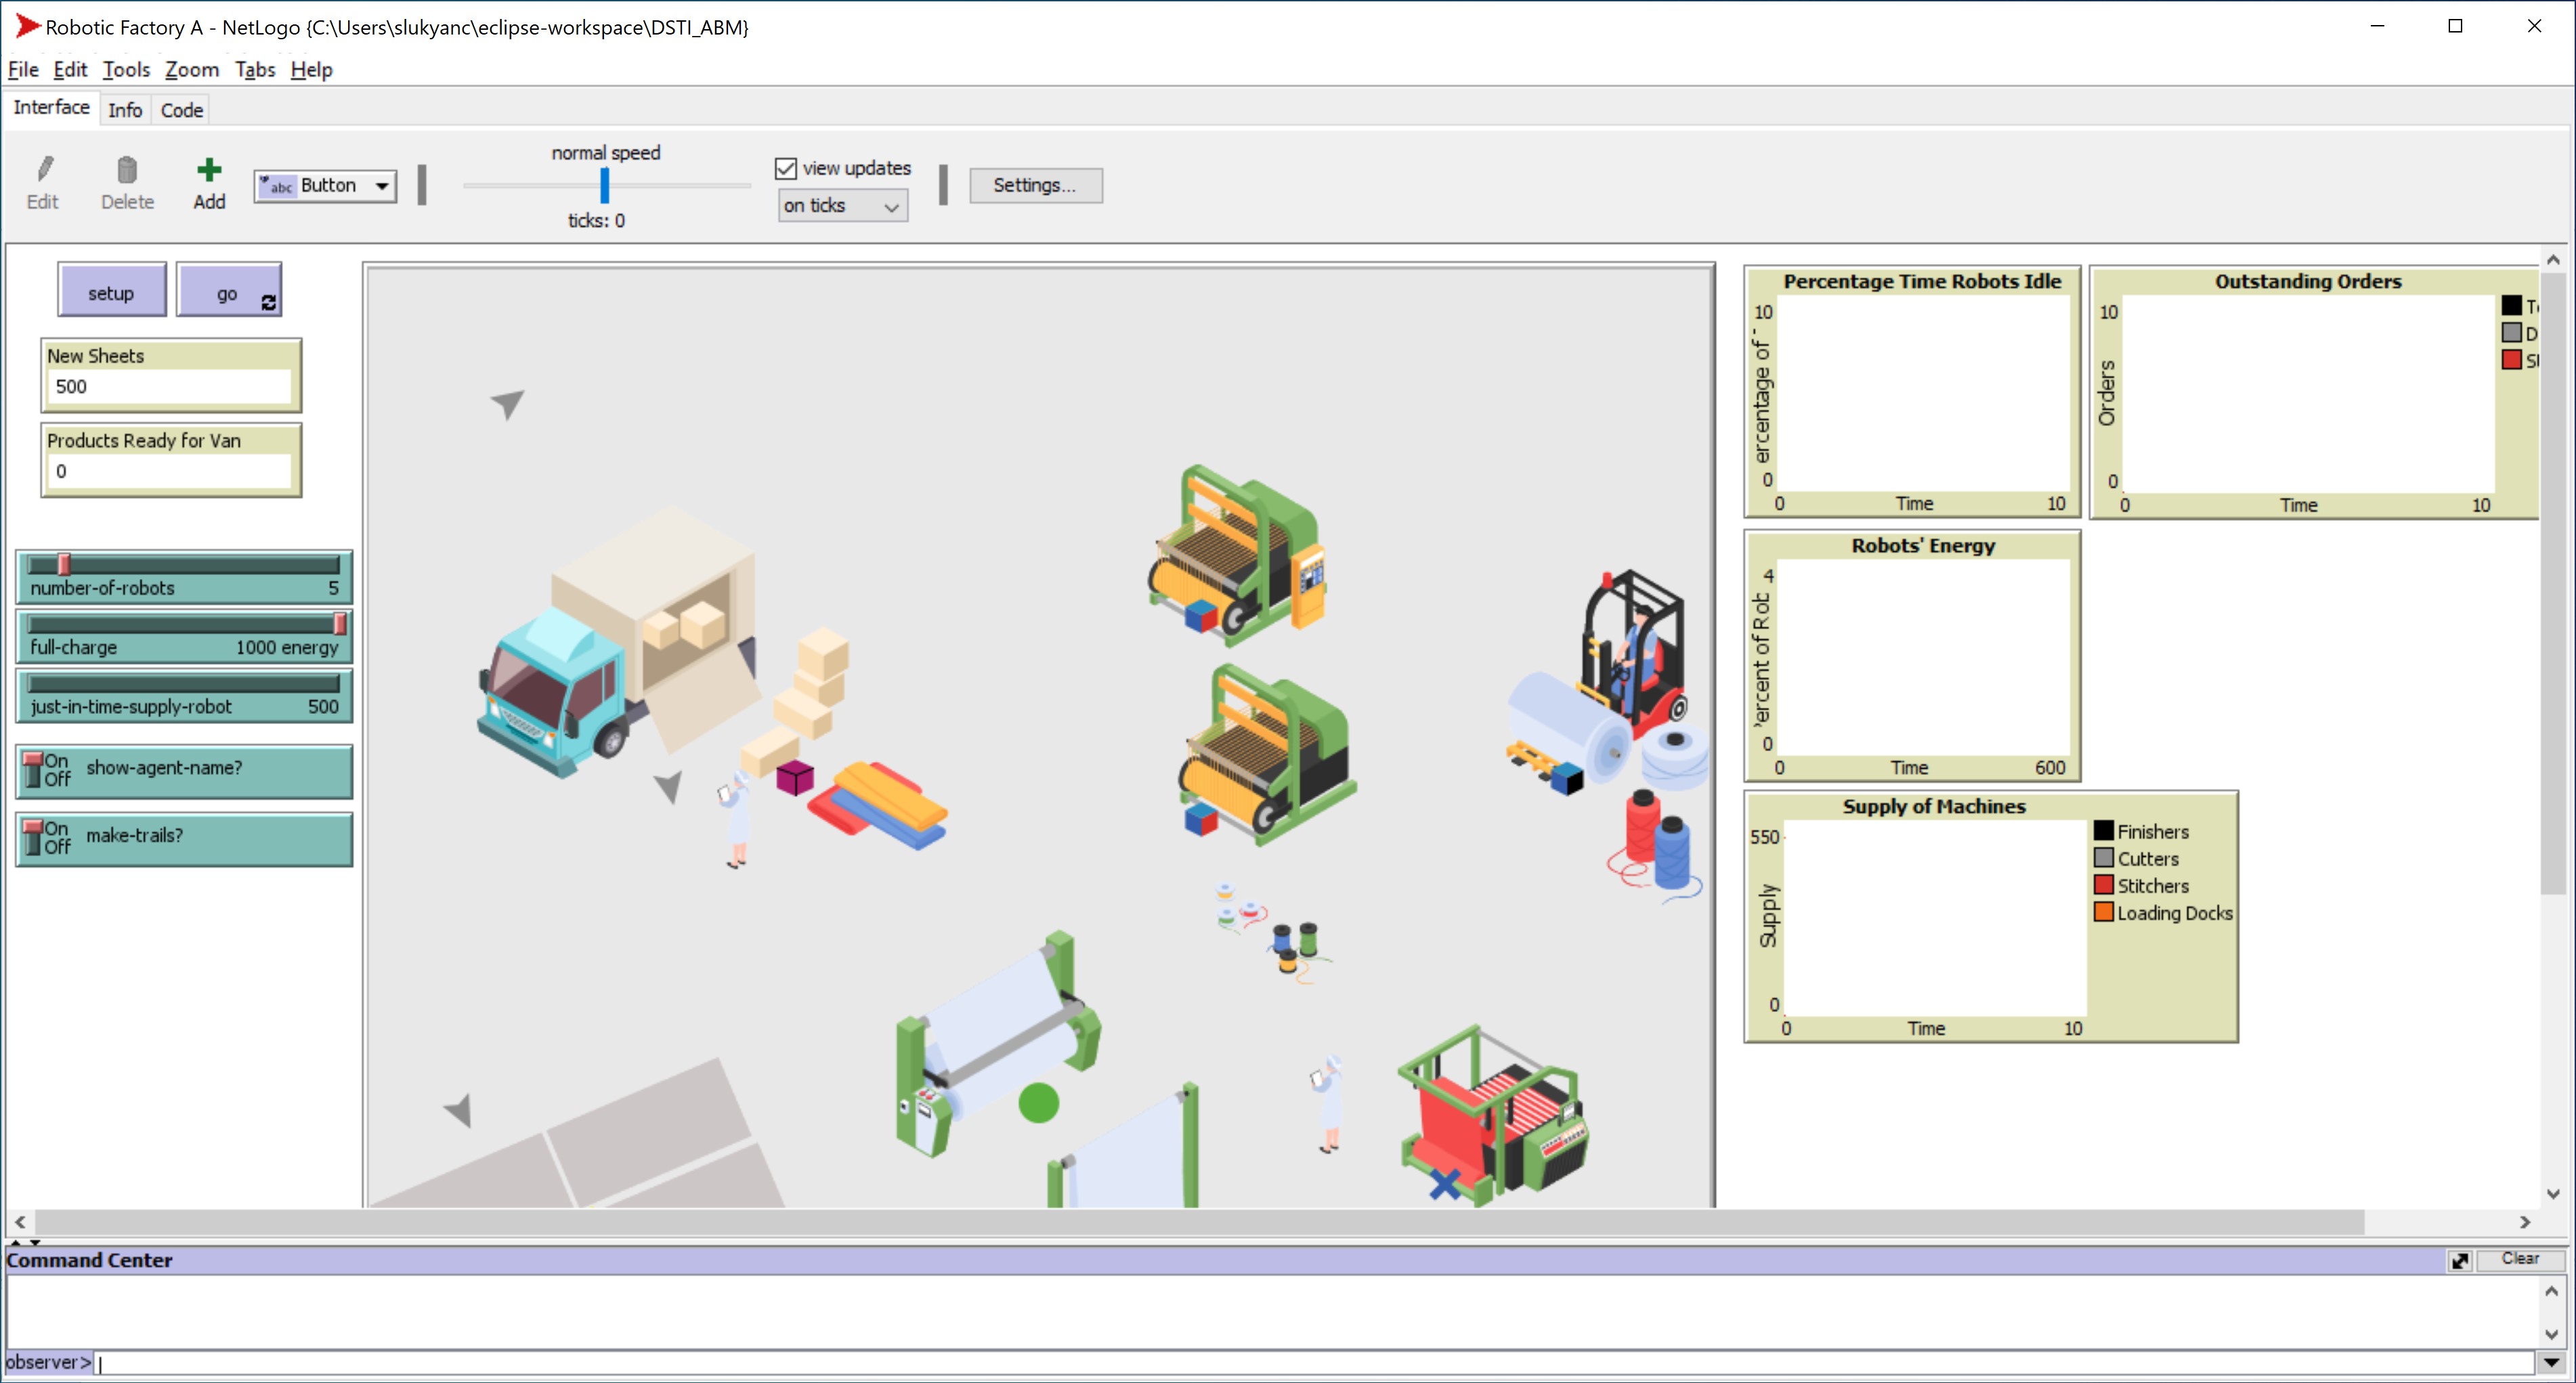 Figure 4: NetLogo model UI view set up for a run (adaptation of U. Wilensky’s “Robotic Factory” model [1])
 Figure 5: NetLogo model code view with implementation of breeds, products, quantities, and destinations (adaptation of U. Wilensky’s “Robotic Factory” model [1])
Robotic Factory A model (see Figure 5 above) implements agent breeds (e.g., breed [ cutters cutter ]), products types (e.g., product-type property of robots), product quantities (e.g., product and supply properties of any agent breed), and robot destinations (e.g., destination property of robots).
3. Process overview and scheduling
Our prototype was based on the following assumptions, mostly originating from “Robotic Factory” [1] and adapted for a factory cluster setting:
- The items stored at warehouses of each factory (loading-docks and storages in terms of our NetLogo breeds) can only be accounted under supply quantity type. I.e., no production takes place at warehouses with no finished products expected
- The items stored at robots of each factory (robots) can only be accounted under product quantity type. I.e., no production takes place at robots with no production supplies expected
- The items stored at machines of each factory (cutters, stitchers, and finishers) can be accounted under either supply or product quantity type, depending on whether those items are expected to be written off into a machine’s production process, or they are expected to be received from a machine’s production process
- Each simulation cycle, for each factory a set of customer orders (agent breed orders) is incremented under a uniform probability (i.e., on random cycles with a fixed proportion of cycles in which orders are added to the set) by a randomly growing number of orders. Each order carries a request for one unit of a finished product (i.e., either one standard product or one deluxe product)
- Each simulation cycle, customer orders are serviced by each factory within the limit of each factory’s inventory of outgoing items (products) at its stitchers (where assignment of not yet finished items to customer orders takes place). Each customer order serviced by a factory brings it a unit of cash (cash global variable) while reducing its inventory of finished products and reducing its pool of outstanding orders
- What remains unused from a factory cycle’s output becomes a potential dispatch (dispatch global variable) to other factories in the cluster. If within the same cycle, after servicing customer orders there is still enough finished product inventory for doing a dispatch to other factories, the dispatch is done (finished products inventory is reduced, the dispatch quantity is reflected in the .csv file and becomes available for intake at the other factories in the cluster)
- Factories form their intake of supplies to be used in production processes by buying supplies for cash or by receiving other factories’ outputs. Intake is done each simulation cycle, its quantity is a sum of cash available at the factory, and of outputs dispatched by the supplying factories (read more about our cluster configuration in the next section)
- Routing of the robots among production machines, managing their picking up and dropping off items, managing their energy levels is done in a fashion like the one implemented in “Robotic Factory” [1] – one difference being that in our prototype robots can transport more than one unit of items among the machines (thus allowing the whole prototype to cope with growing numbers of customer orders)
In the below diagram, we see the three InterSystems IRIS processes (NETLOGO.FACTORYA, NETLOGO.FACTORYB and NETLOGO.FACTORYC) that represent Factories A, B and C in InterSystems IRIS production, and the three corresponding NetLogo models:
 Figure 6: Factory-level components of the prototype (adaptation of U. Wilensky’s “Robotic Factory” model [1])
Each InterSystems IRIS process launches a NetLogo experiment using the corresponding NetLogo model – and performs continuous reading of factory-level experiment dynamics metrics (on each simulation cycle, metrics are exported by NetLogo models in .csv files with fixed names in a fixed work directory). On top of factory-level processes, we added a cluster-level InterSystems IRIS process: NETLOGO.CLUSTER. It launches factory-level processes and performs continuous computation of cluster-level metrics:
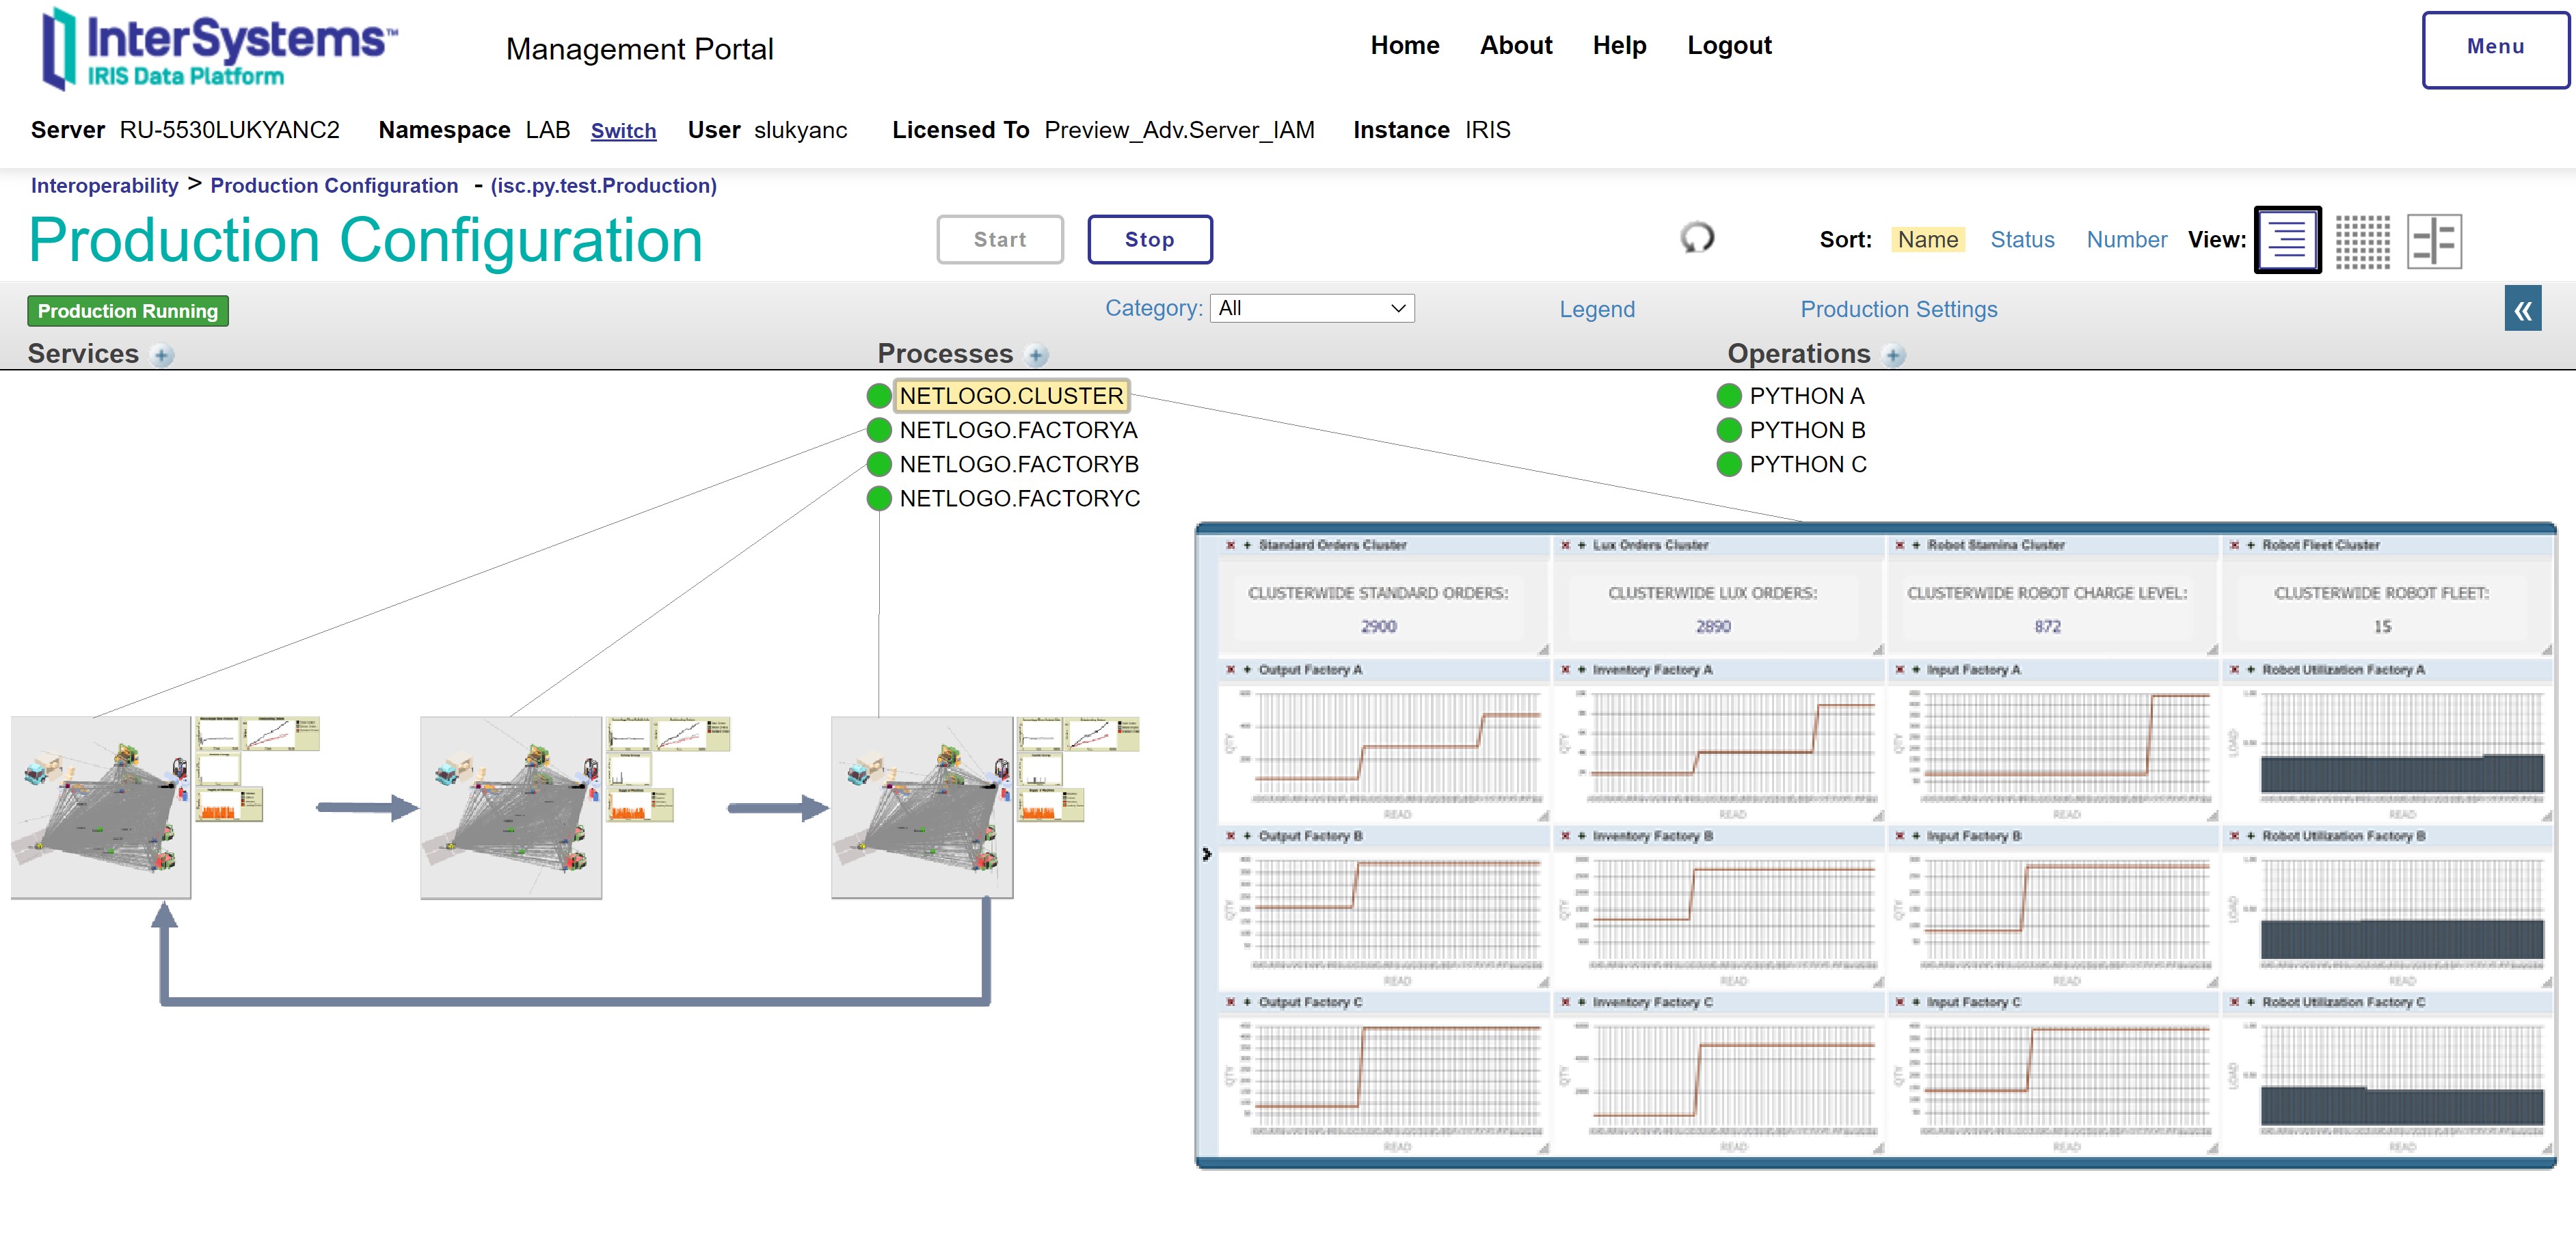 Figure 7: Cluster-level components of the prototype (adaptation of U. Wilensky’s “Robotic Factory” model [1])
Cluster-level and factory-level metric values are persisted in InterSystems IRIS tables, becoming facts for InterSystems IRIS OLAP cubes that underlie various visualization components, see below the snapshot of a cluster-level (cockpit) dashboard:
 Figure 8: Cluster- and factory-level metrics visualized in a dashboard in InterSystems IRIS
Execution progress of InterSystems IRIS processes is reflected in the visual trace report (see Figure 9 below). We can follow the exact sequence, duration and outcome status of actions executed across all the InterSystems IRIS processes and operations:
 Figure 9: Process execution tracing report in InterSystems IRIS
We can control the status of all the message queues behind InterSystems IRIS processes and operations using queue monitor:
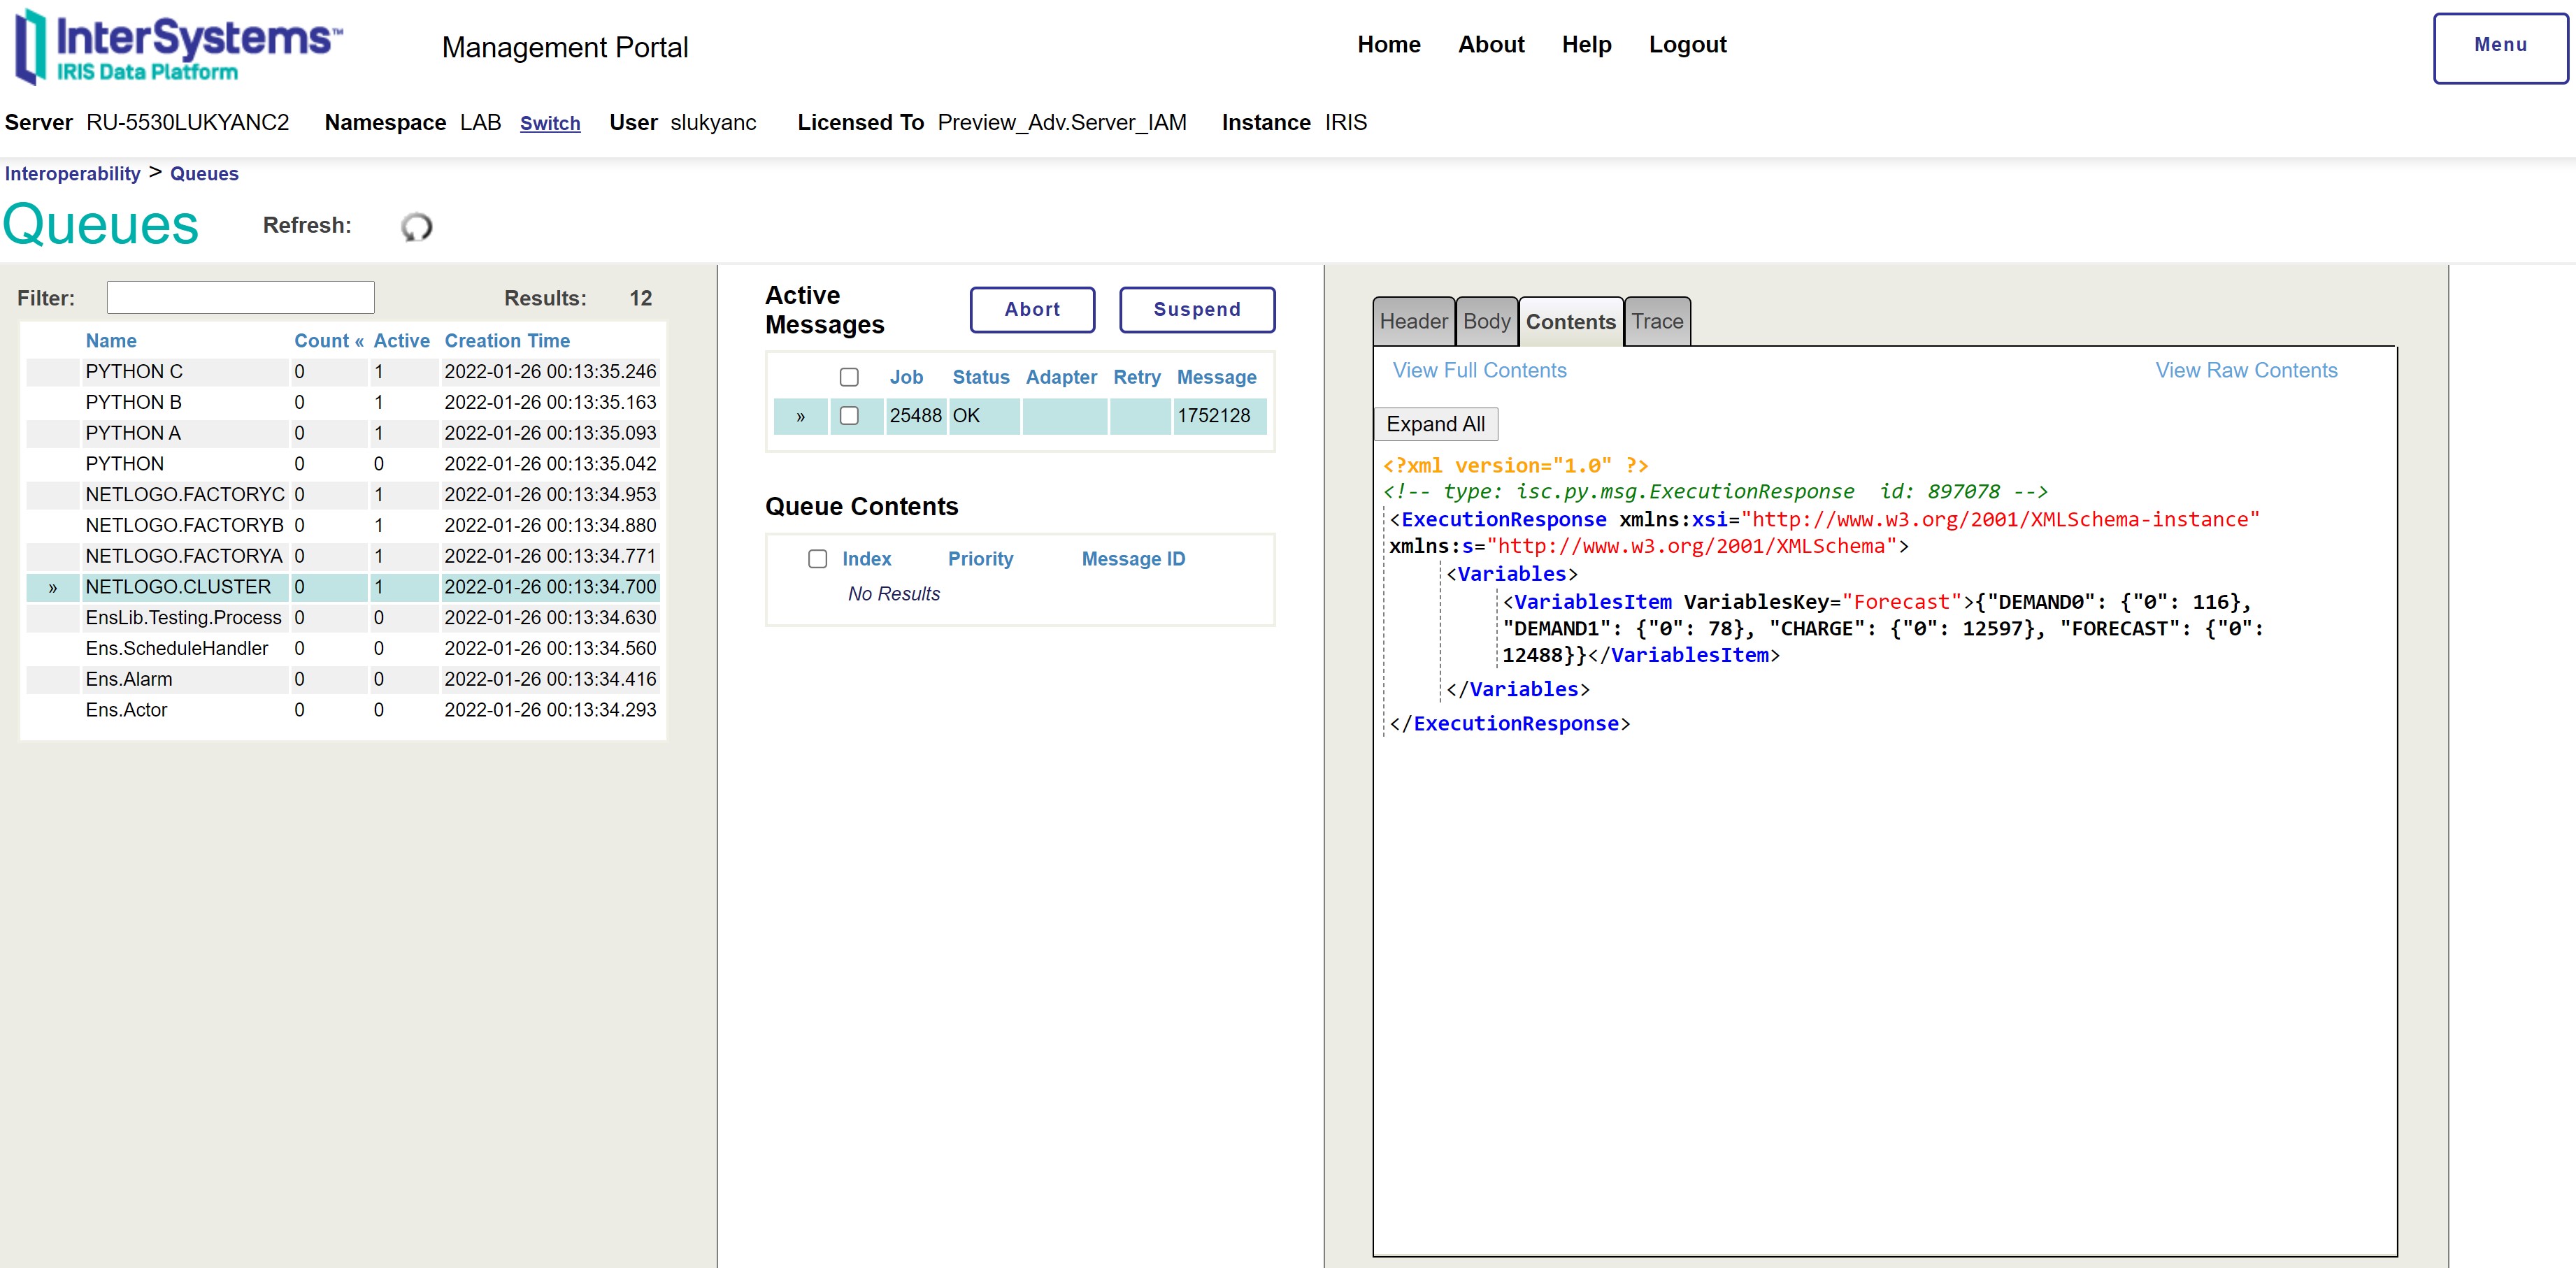 Figure 10: Queue monitor in InterSystems IRIS
As it was mentioned in section “Entities, state variables, and scales” above (subsection “Scales”), there is no explicit process schedule or cycle duration intended in the prototype. By varying the length of execution delays in InterSystems IRIS processes and NetLogo models, we can implement any required execution pace. The lack of pre-determined execution sequence among InterSystems IRIS processes and NetLogo models is fundamental for emergence and stochasticity aspects of the prototype (read more in the next section).
4. Design concepts
4.1 Basic principles
Agent-based simulation using factory-level NetLogo models allows to approximate rather fairly the dynamics of some major factory-level metrics: supplies intake, inventories, product output, robot utilization, etc. However, for cluster-level metrics, a simple aggregation of factory-level metrics read from separate factories, is not enough – we need to model connections among the factories. This is where InterSystems IRIS starts playing its orchestrator role by simulating inter-factory exchanges and dependencies. For example, in our prototype, output from factory C is input for factory A. Factory C locks the work directory and re-writes OutputC.csv file containing (among other metrics) its current simulation cycle’s dispatch, say, 10 units. Factory A systematically (at a frequency implemented in Factory A model) attempts reading OutputC.csv and importing Factory C output from it as supply intake (input) – if the work directory is not locked by other models or processes. InterSystems IRIS process NETLOGO.CLUSTER systematically (at its own frequency) attempts reading OUTPUTA, OUTPUTB and OUTPUTC tables – once the working directory is not locked by other models or processes. This way, InterSystems IRIS allows NetLogo models compete for access to the work directory, thus imitating real-life “execution congestion” taking place in any connected cluster of operations. On the other hand, InterSystems IRIS forces its “super-observer” NETLOGO.CLUSTER process participate in competition for access to the work directory (in company with factory-level NetLogo models), to guarantee that the output data it consolidates are not being altered during consolidation. We will describe other design aspects of our prototype further in this section.
4.2 Emergence
As mentioned above, NetLogo models and InterSystems IRIS processes (both factory- and cluster-level) compete for access to the work directory. I.e., apart from emergence implemented in each of the NetLogo models (i.e., stochasticity of operation quantities and robot destinations, read more below in subsection “Stochasticity”), an additional layer of emergence is added through InterSystems IRIS processes:
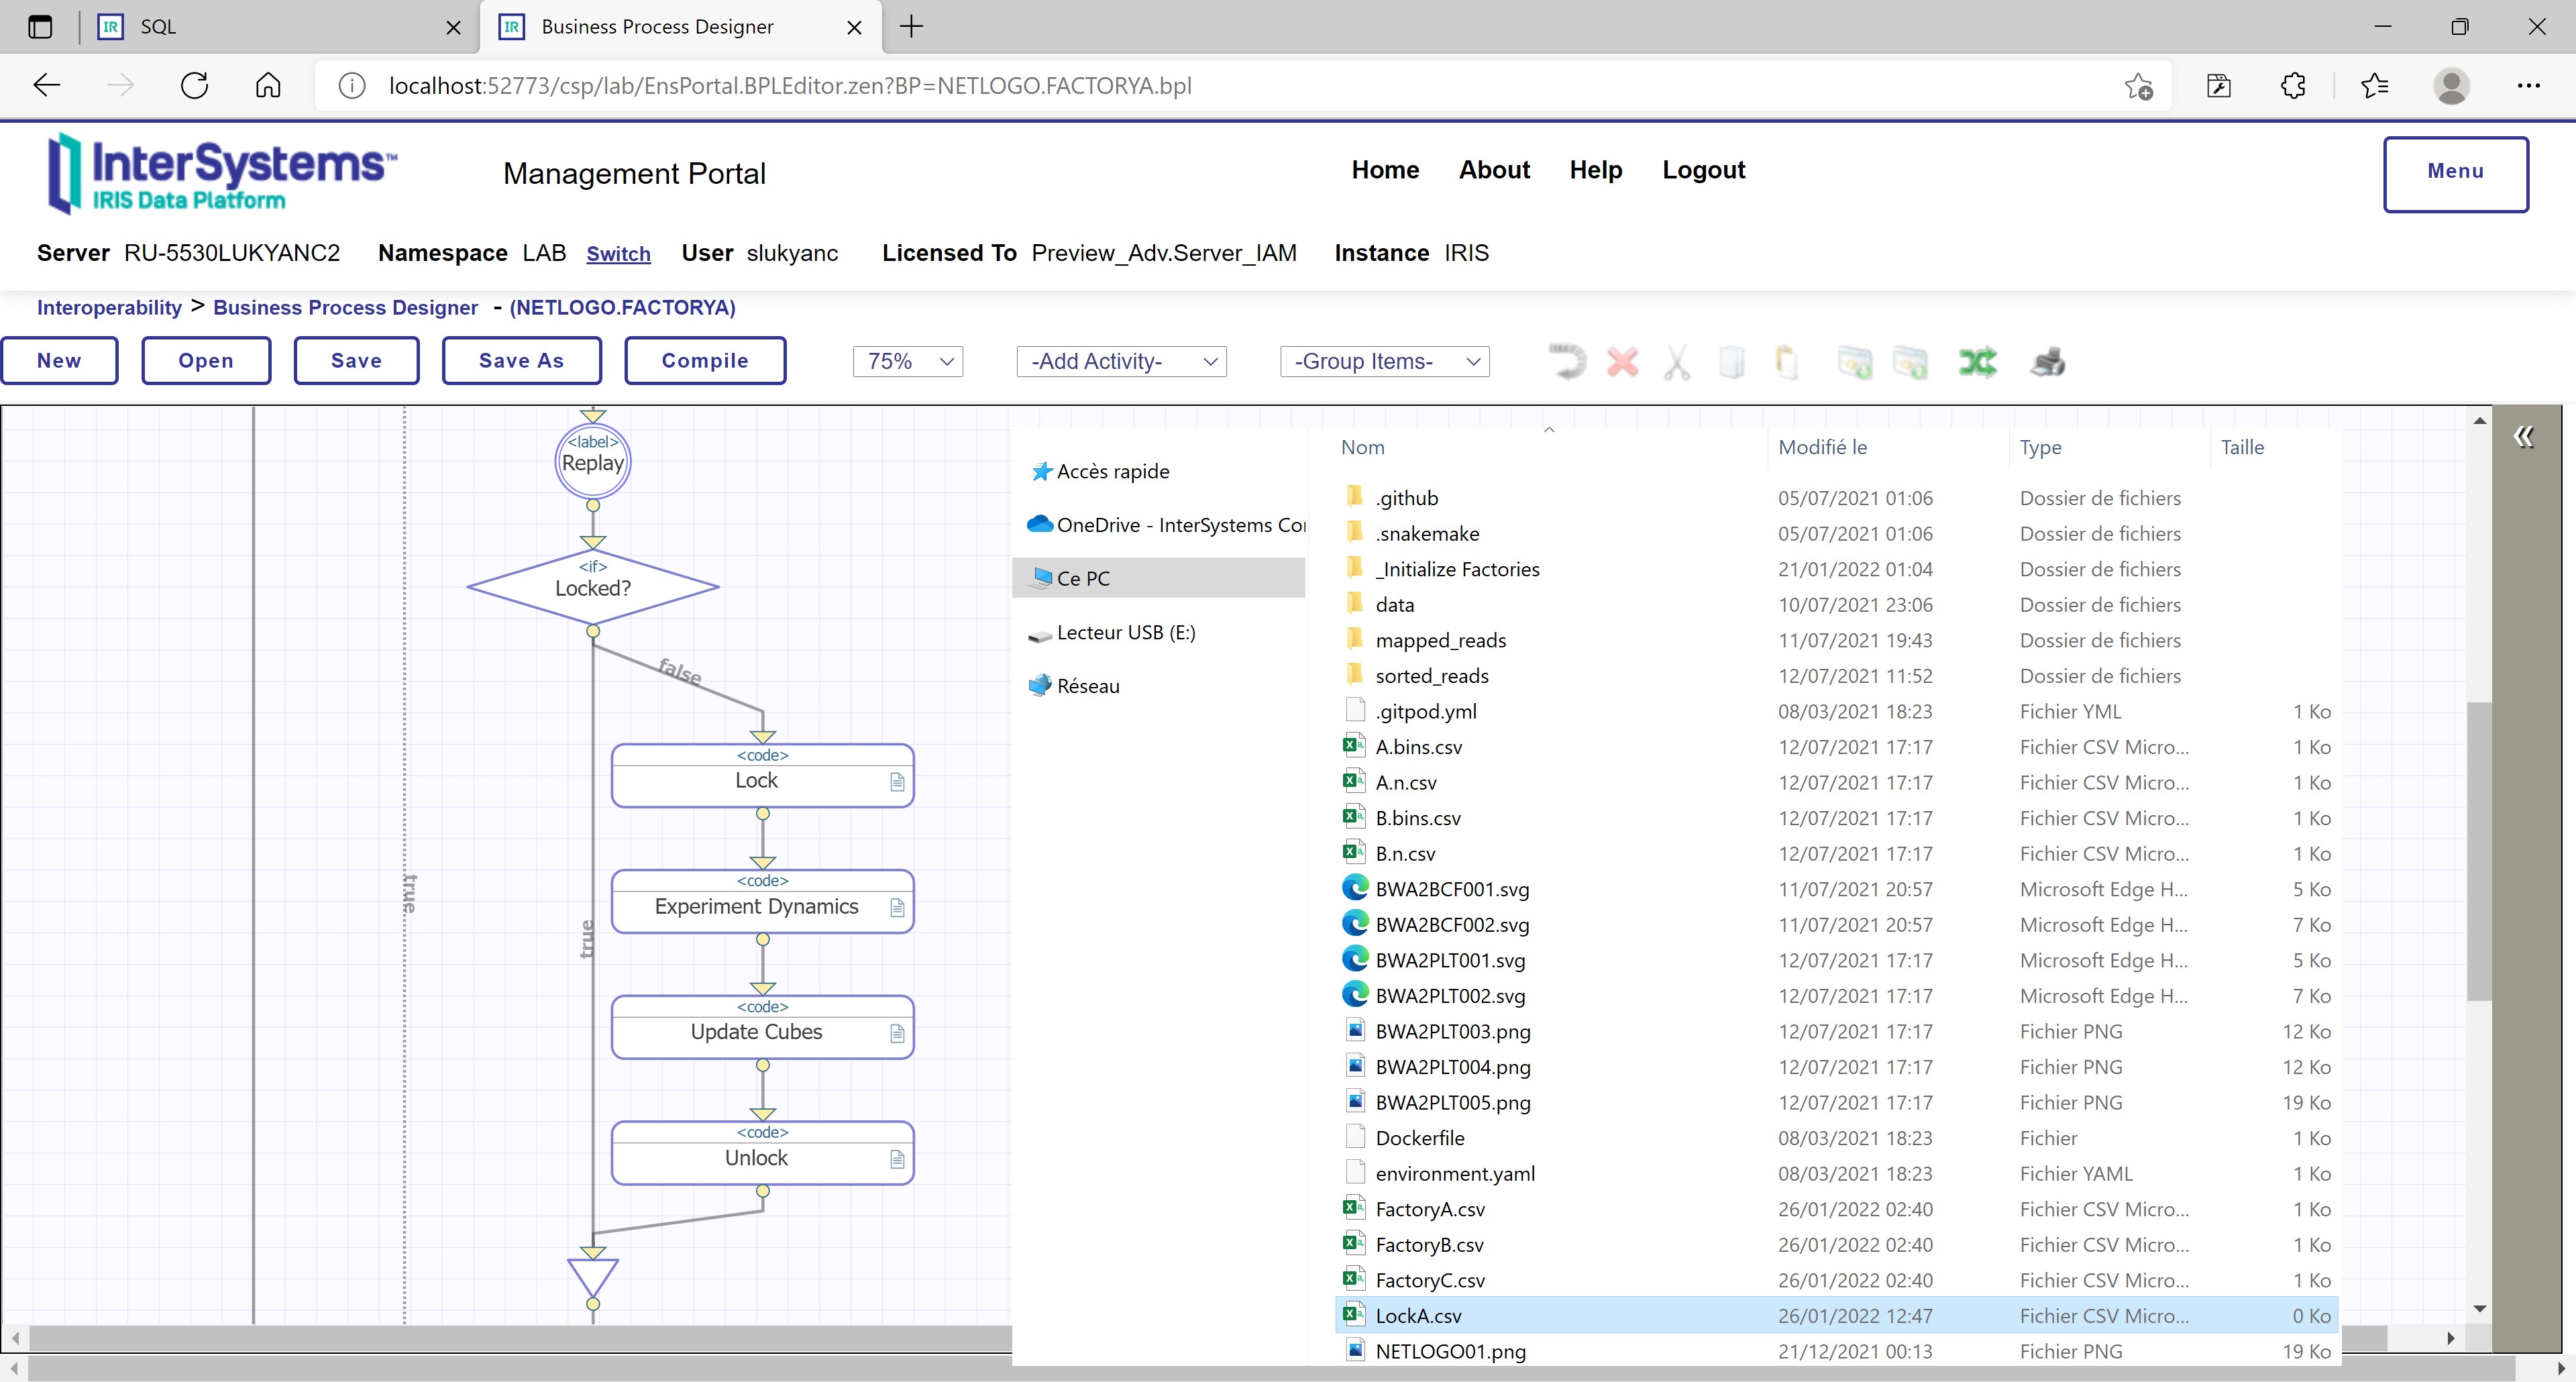 Figure 11: NETLOGO.FACTORYA process locks access to the work directory
Altogether, NetLogo and InterSystems IRIS reproduce competition for access to resources and information, inevitable in a factory cluster context.
4.3 Adaptation
Cluster-level adaptation is implemented in NetLogo models: as the pool of customer orders grows for a factory itself and for its consumer factory (e.g., Factory B consumes output of Factory A), factory-level demand (demand0 and demand1 global variables, standing for standard and deluxe demand, respectively) takes into account both the factory’s own outstanding orders and those of the consumer factory (req0 and req1 global variables, denoting consumer factory’s outstanding standard and deluxe orders):
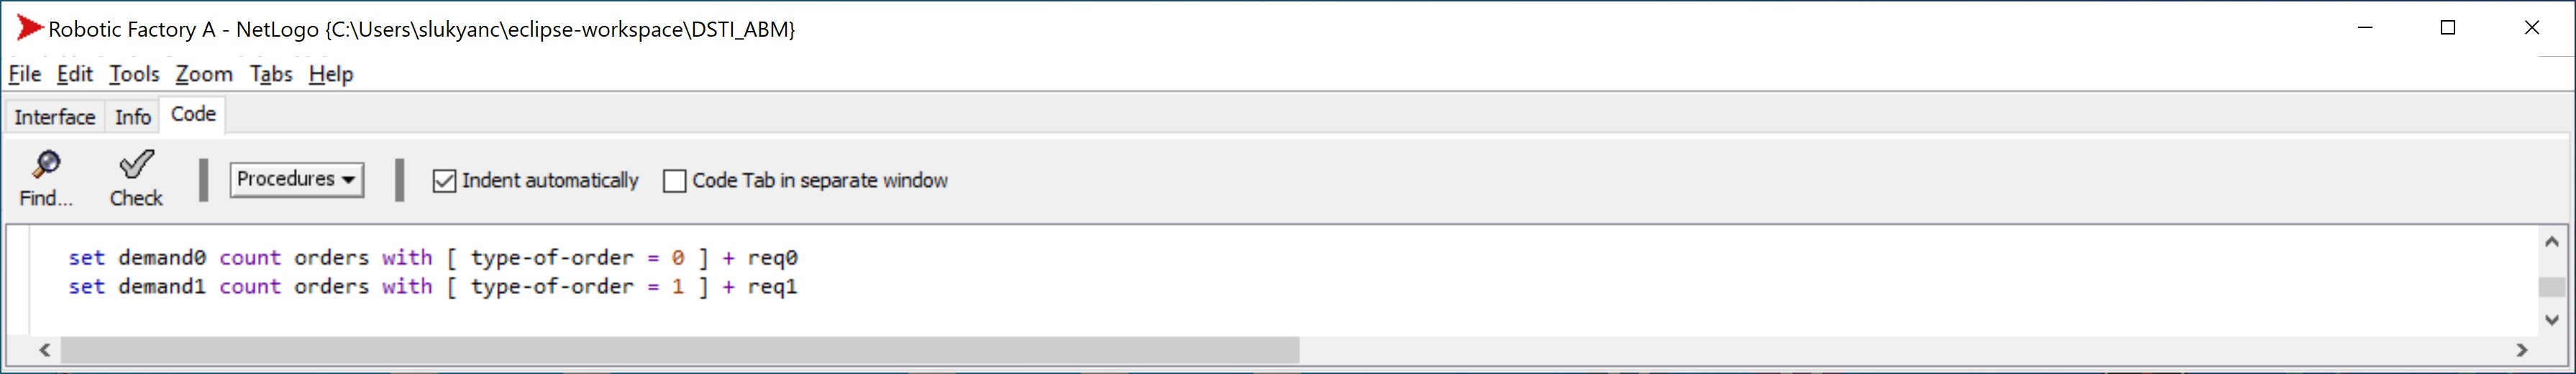 Figure 12: Factory A includes in its demand outstanding customer orders of Factory B
The current size of the customer orders pool is written on every simulation cycle by each factory into its OutputA/B/C.csv file, making it possible for supplier factories to read order pool size of consumer factories.
Factory-level demand participates in computing a factory’s write-off of supplies from its loading docks to production, on each simulation cycle:
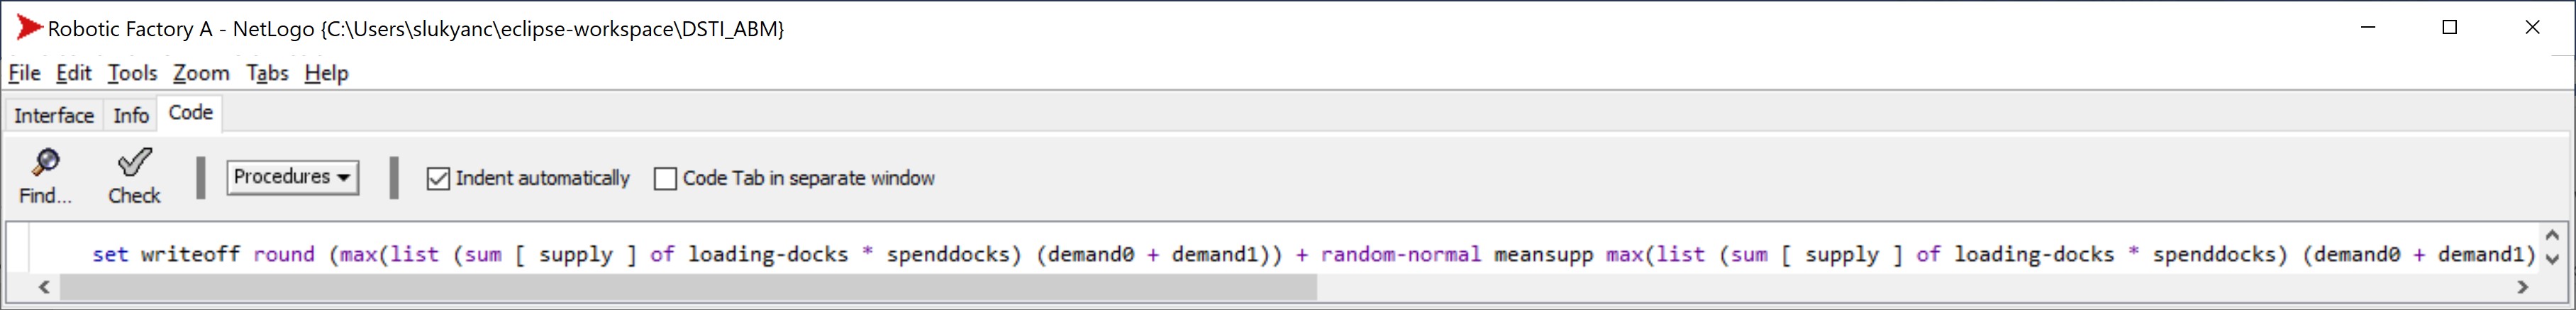 Figure 13: Factory A computes its write-off into production based on its demand
4.4 Objectives
The final objective of each factory is to service a growing flow of incoming customer orders by manufacturing standard or deluxe garments. Each factory has its own pool of customer orders, but it also attempts to dispatch the output that remains after servicing its orders in a particular cycle, to its consumer factory. As mentioned above, the size of the consumer factory’s outstanding orders pool is considered by the supplier factory while estimating demand and computing write-offs into production. Production execution at each factory is dependent on the performance of its robot fleet that transports items among its machines and warehouses. Therefore, reaching final objectives has critical dependency on the performance of a factory’s robot fleet. This explains why outstanding order pool sizes (by product type) neighbor robot fleet indicators (robot energy level and robot fleet size) in the cluster-level part of the cockpit dashboard. If we formulate the very essence of the objectives in several words, it would be “push the size of outstanding orders pool down while pushing the level of robot battery charge up”.
4.5 Learning
Putting aside that self-organizing capacity that agent-based approach has by design, we added to our prototype explicit machine learning mechanisms. We implemented training a linear regression model to extract dependency of the charge level of all the cluster’s robots (in the next n-th simulation cycle, e.g., the next 1 cycle) on the sizes of the cluster’s outstanding order pools for standard and deluxe items (observed during a certain moving period, e.g., last 50 simulation cycles). That machine learning mechanism was implemented in NETLOGO.CLUSTER process using ML Toolkit for InterSystems IRIS extension and is run in each cycle using PYTHON operation for interoperability with local Python:
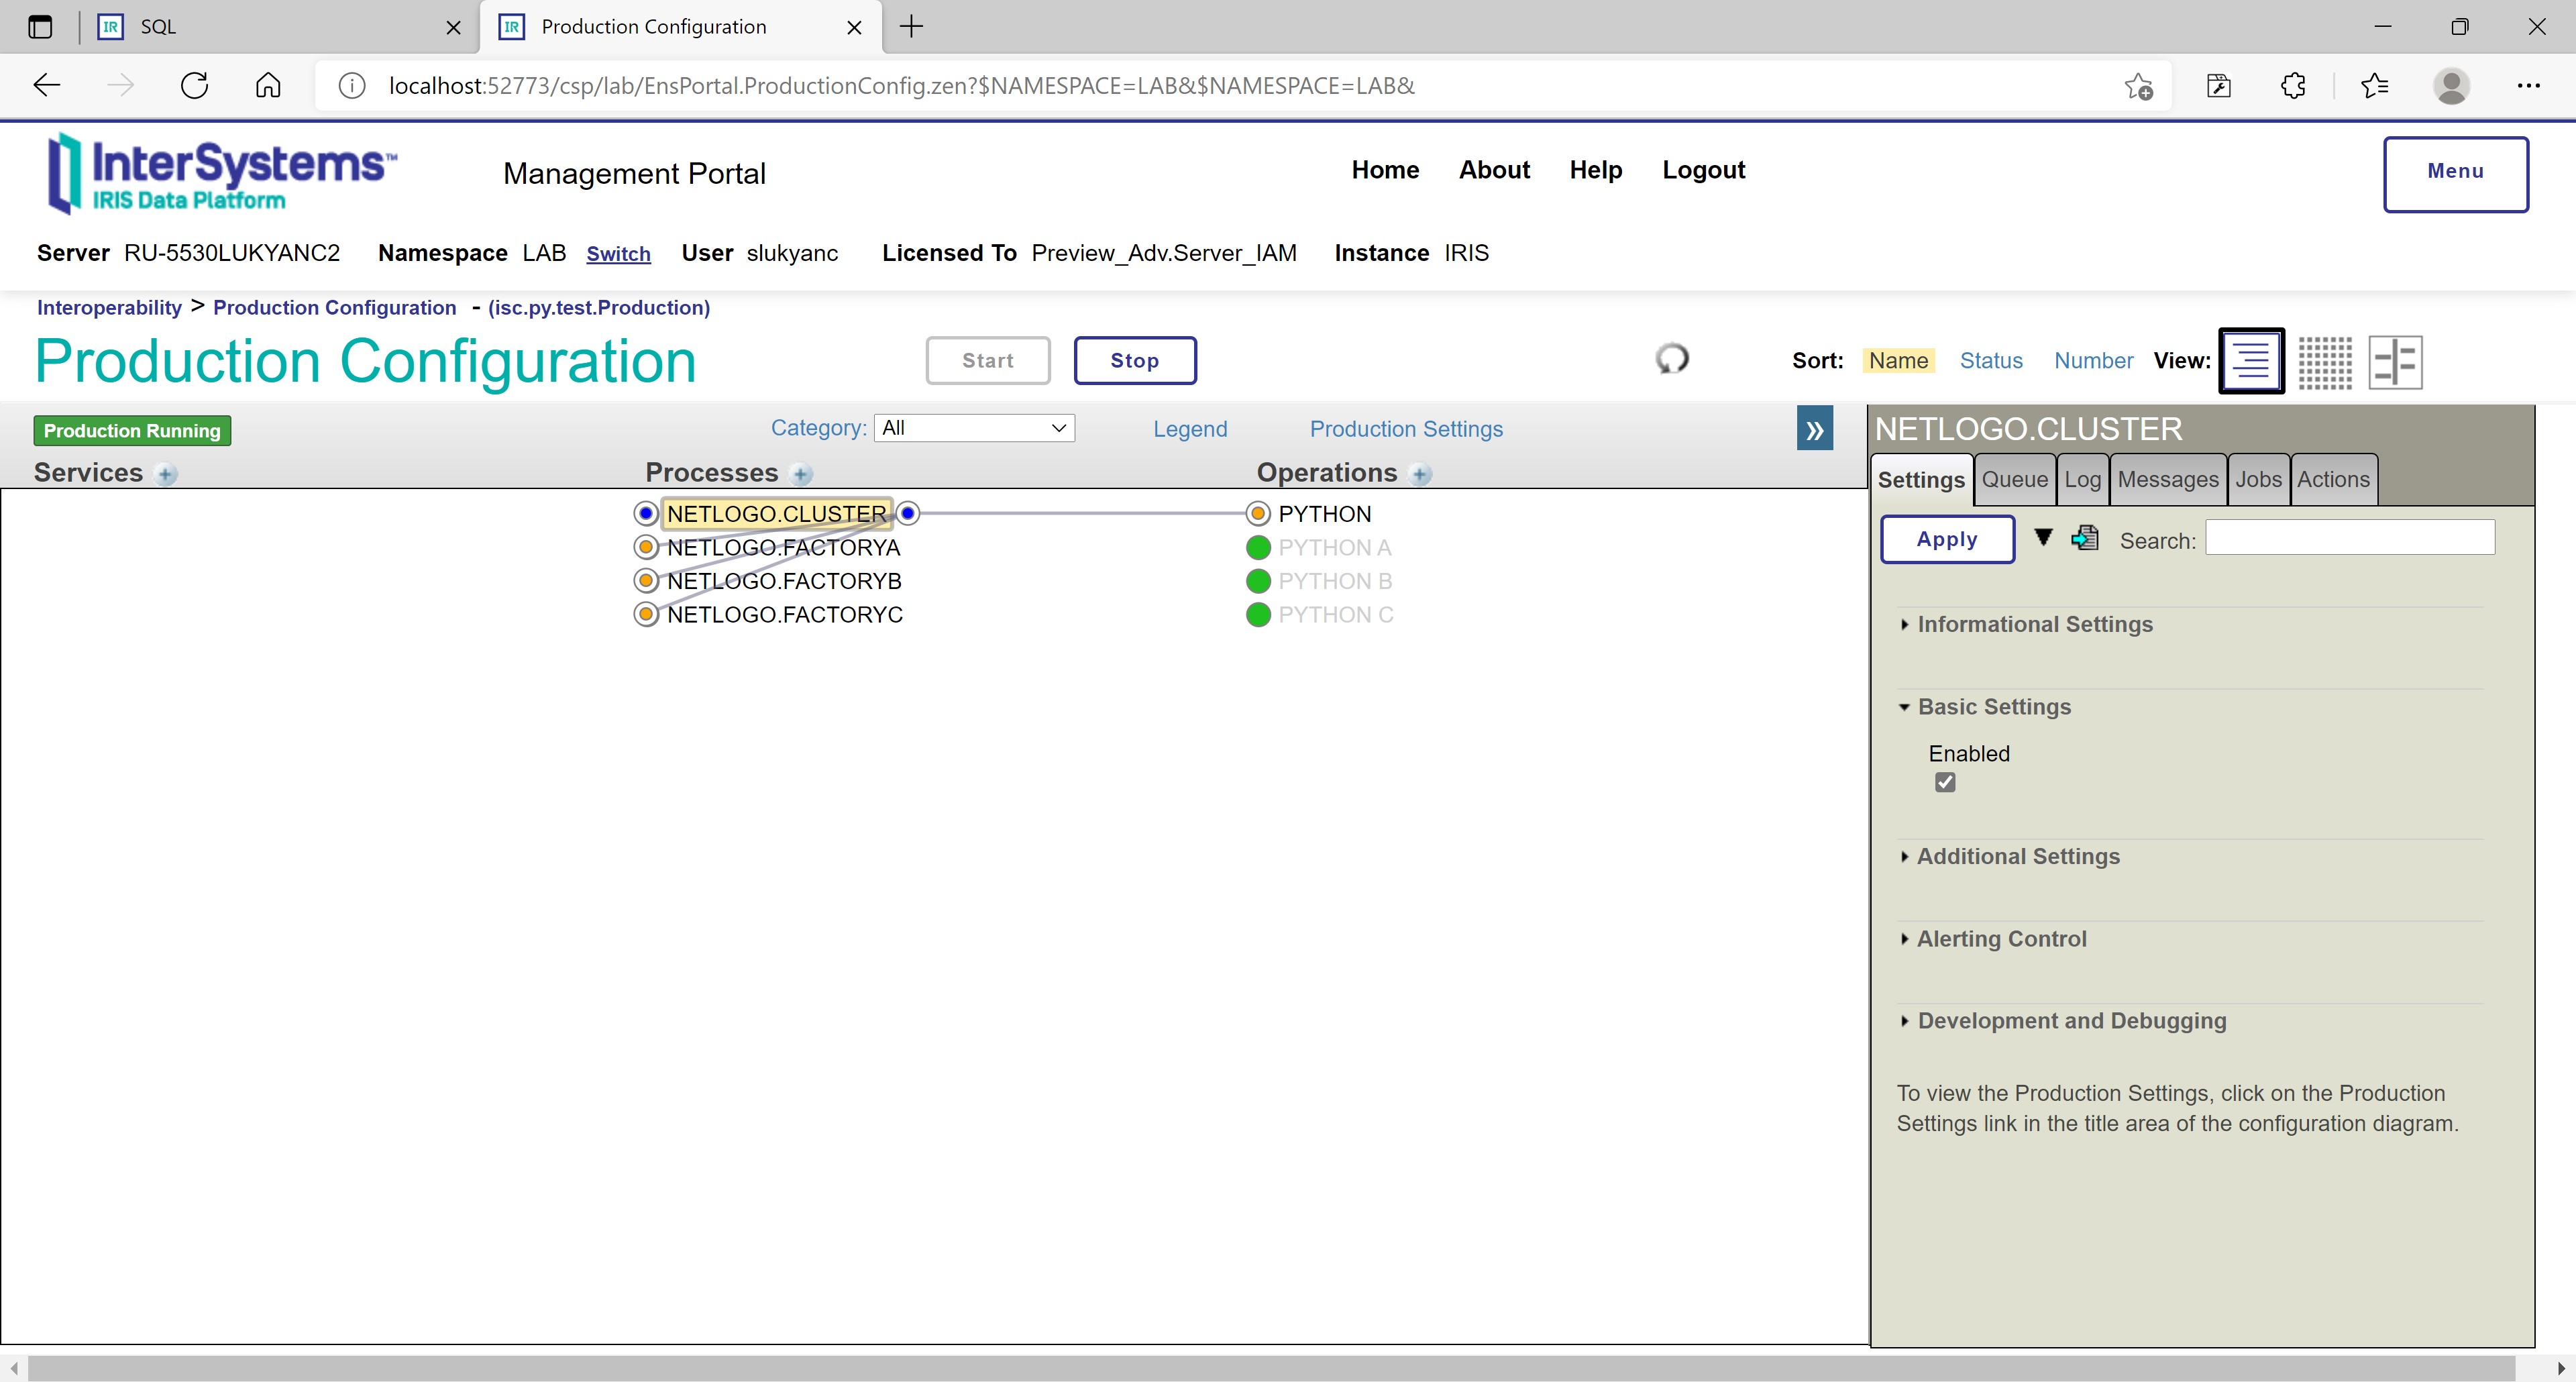 Figure 14: Cluster-level machine learning in InterSystems IRIS using an operation for Python interoperability
 Figure 15: Cluster-level machine learning in InterSystems IRIS
 Figure 16: Cluster-level machine learning in InterSystems IRIS – a linear regression model fit step in NETLOGO.CLUSTER process
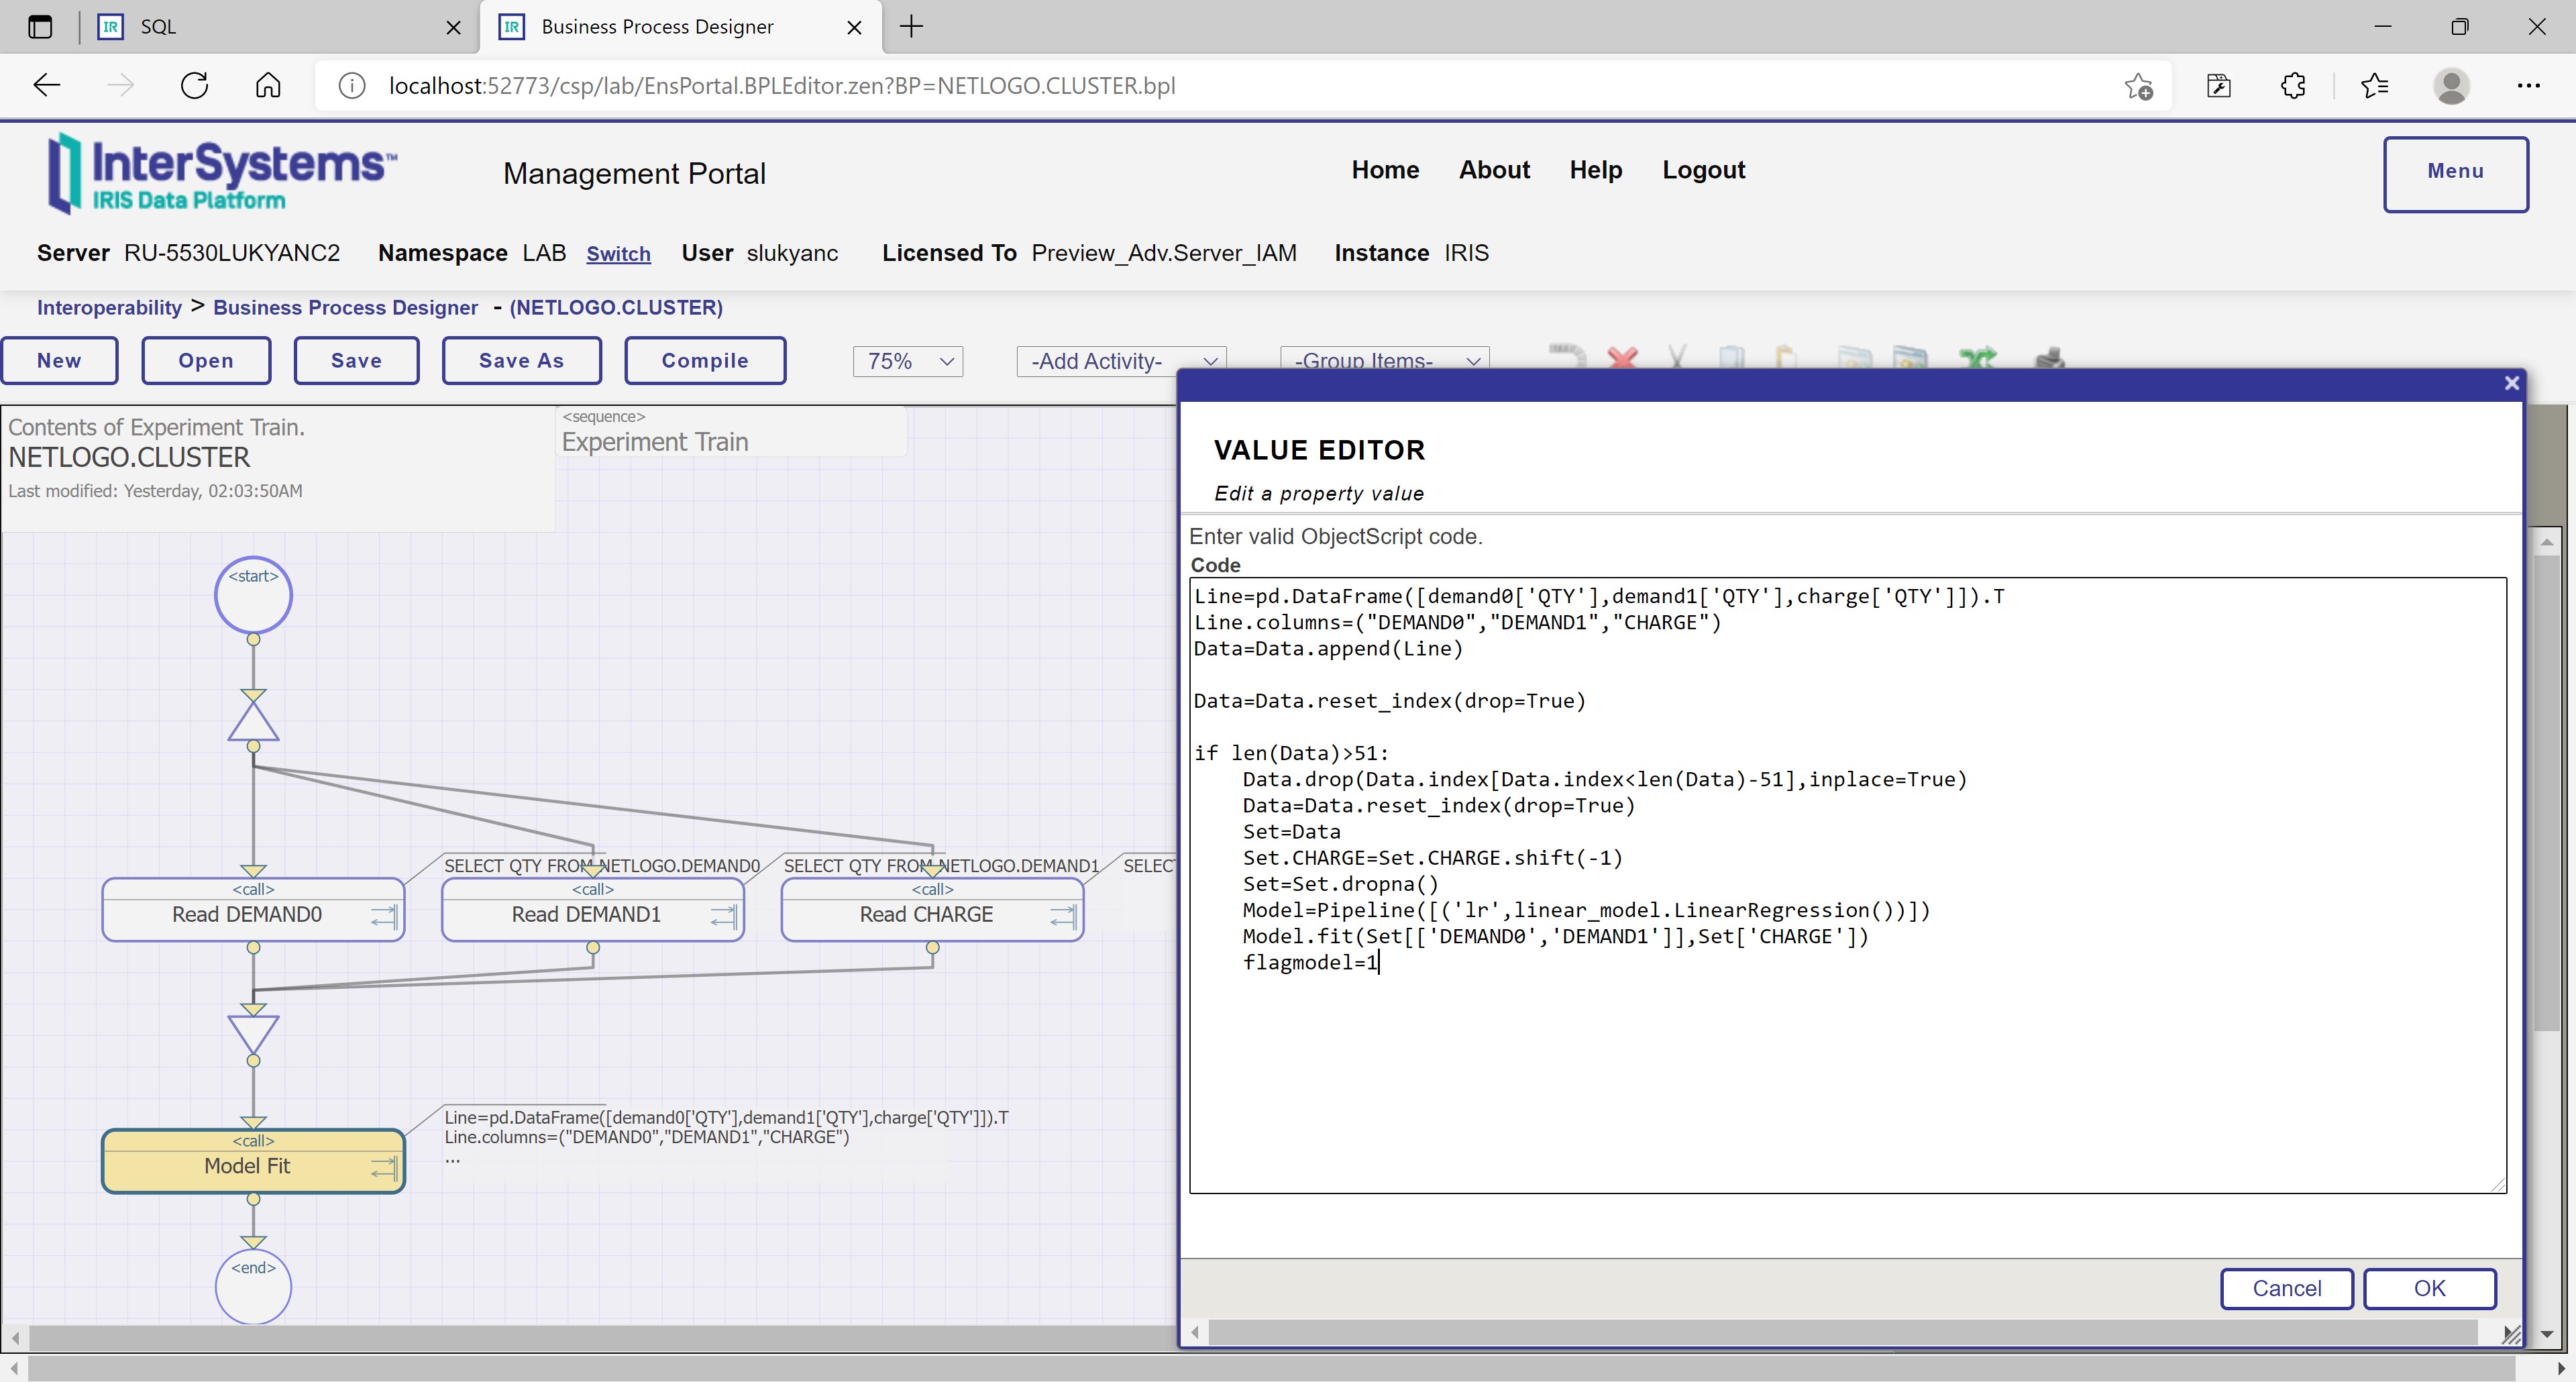 Figure 17: Cluster-level machine learning in InterSystems IRIS – a linear regression model fit step’s Python script in NETLOGO.CLUSTER process
Where there is a predictive model trained, there should be a prediction.
4.6 Prediction
Prediction method of the trained model is applied to the next read of the sizes of the outstanding order pools:
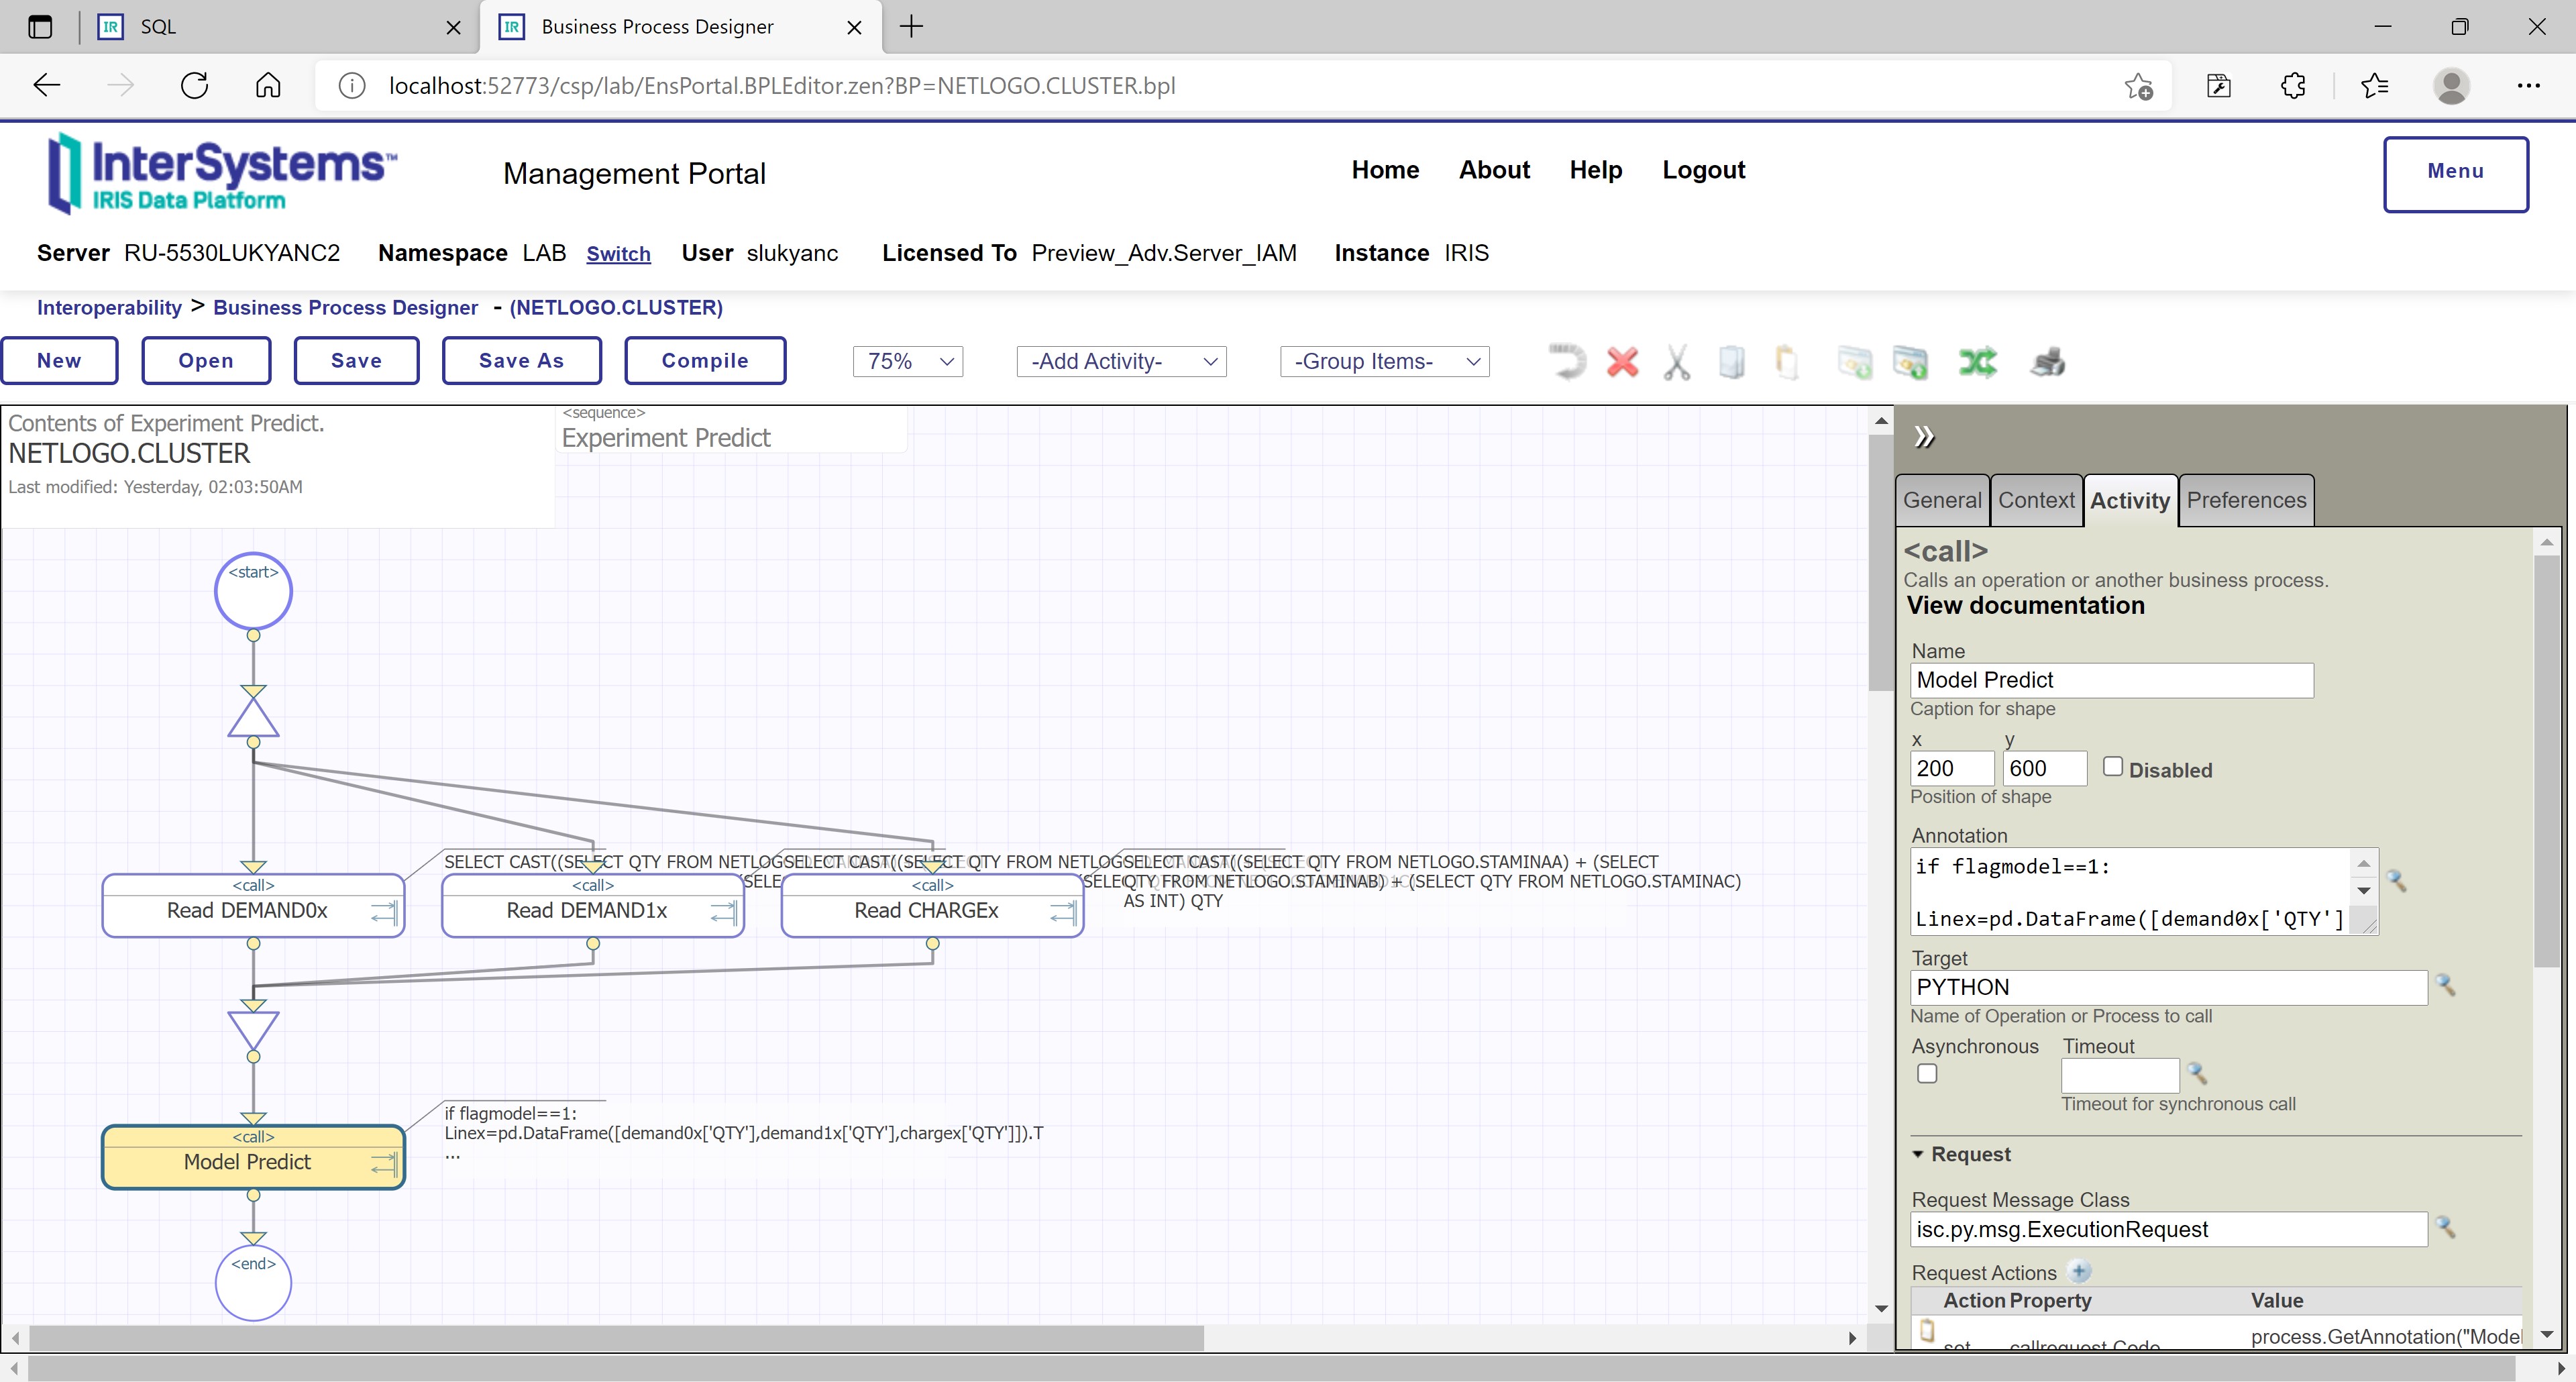 Figure 18: Cluster-level machine learning in InterSystems IRIS – a linear regression model predict step in NETLOGO.CLUSTER process
 Figure 19: Cluster-level machine learning in InterSystems IRIS – a linear regression model predict step’s Python script in NETLOGO.CLUSTER process
Now we have both the actual last read (i.e., in the current cycle) value of cluster-level summary robot charge level, and the forecast value for the next 1 cycle. We can extend the cockpit dashboard with this information:
 Figure 20: Cluster-level machine learning in InterSystems IRIS – a cockpit dashboard visualizing actual and forecast robot charge level
Prediction can be instrumental to detect potential problems with robot charge level:
 Figure 21: Cluster-level machine learning in InterSystems IRIS – a cockpit dashboard visualizing a detection of an approaching critical drop of robot charge level
4.7 Sensing
Robots that execute internal factory logistics do some basic sensing by detecting whether it is possible to pick up a machine’s output, whether recharging their batteries is needed, or whether their presence is urgently required without waiting for a recharge to complete. For that, they “sense” whether machines or warehouses are present in their neighborhood. The robot room (where recharging is done) “senses” whether robots are present in its neighborhood.
4.8 Interaction
Robots pick up items available at a machine or warehouse, transporting them to another machine or warehouse. Or more formally, robot agents “interact” with machine agents and warehouse agents. Those interactions are limited to changing inventory levels at giving and receiving agents, plus changing destination of robot agents. When robots recharge their battery, an interaction with the robot room takes place: a robot agent needs to spend a certain number of simulation cycles in the robot room (unless there is an urgent need for robots signaled somewhere on the factory floor). Besides factory-level interactions, we have cluster-level interactions implemented as inter-factory dispatch/intake.
4.9 Stochasticity
We modified the original “Robotic Factory” [1] NetLogo model by randomizing quantities in all major interactions:
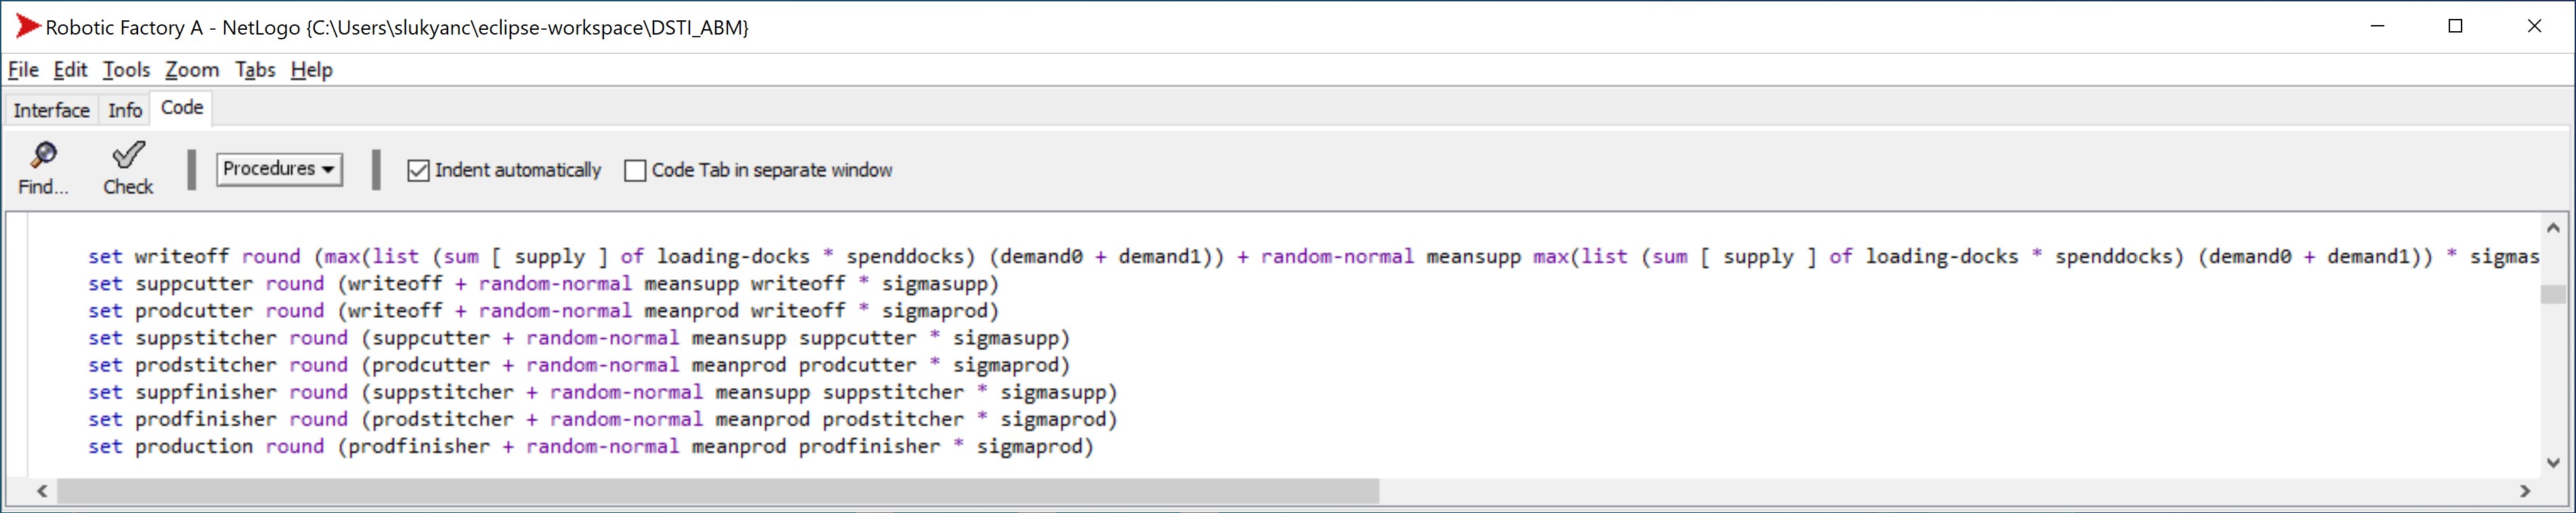 Figure 22: Randomizing major interaction quantities in NetLogo
Also, the number of customer orders generated at a factory within one cycle, is made random:
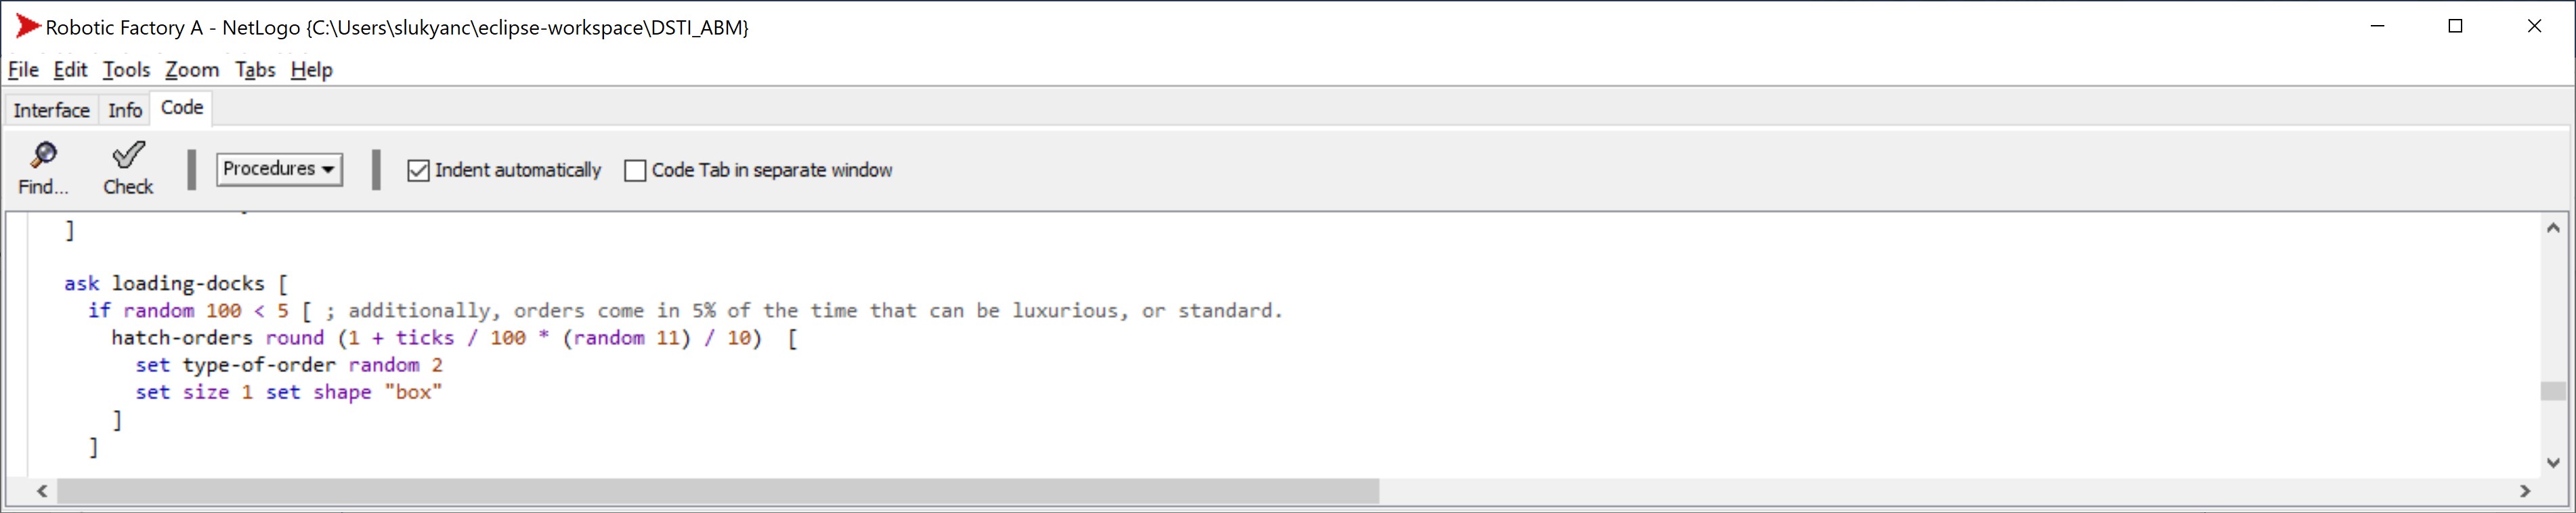 Figure 23: Randomizing number of generated customer orders in NetLogo
As well as the quantity of the dispatch of items to a consumer factory:
 Figure 24: Randomizing dispatch quantity in NetLogo
Altogether, the above-mentioned elements of stochasticity (combining with elements of emergence, mentioned earlier, as well as with stochasticity of destination choice and energy spend/recharge by the robots) assure random oscillations of all the key quantities in the prototype, making the behavior of the factory cluster non-deterministic.
4.10 Collectives
Collectives of robots, machines, and warehouses form a factory, while factories form the cluster – the collective that we prototype and explore. Factory-level collectives are generated in NetLogo models on simulation experiment setup:
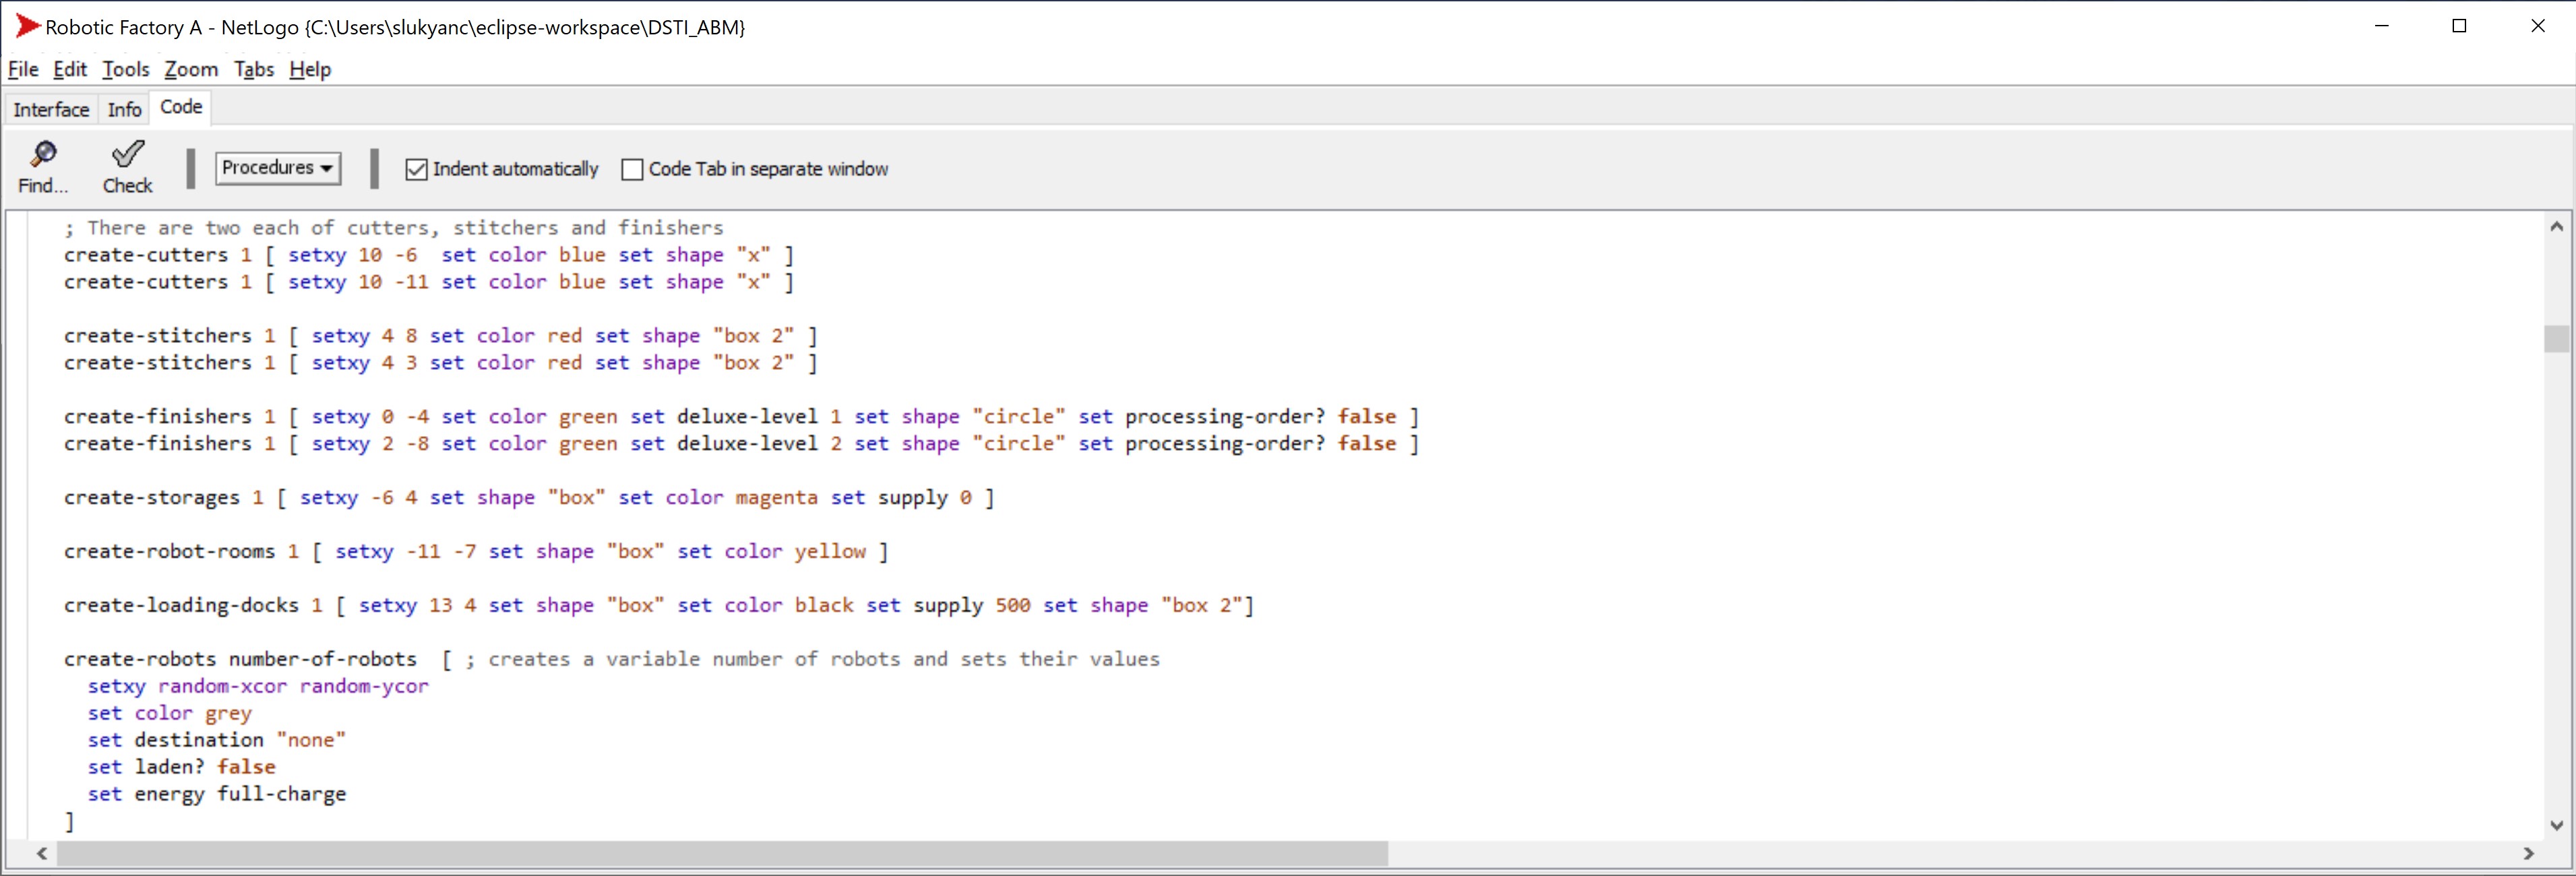 Figure 25: Generating factory-level collectives in NetLogo
The cluster-level collective of factories has a user-definable configuration, implemented in both NetLogo and InterSystems IRIS. For the purposes of this prototype, as mentioned earlier in section “Design concepts”, a configuration based on circular flow of inter-factory dispatch/intake interactions, has been applied. This configuration is put at work and orchestrated via NETLOGO.CLUSTER process in InterSystems IRIS (launches processes NETLOGO.FACTORYA/B/C and monitors their metrics):
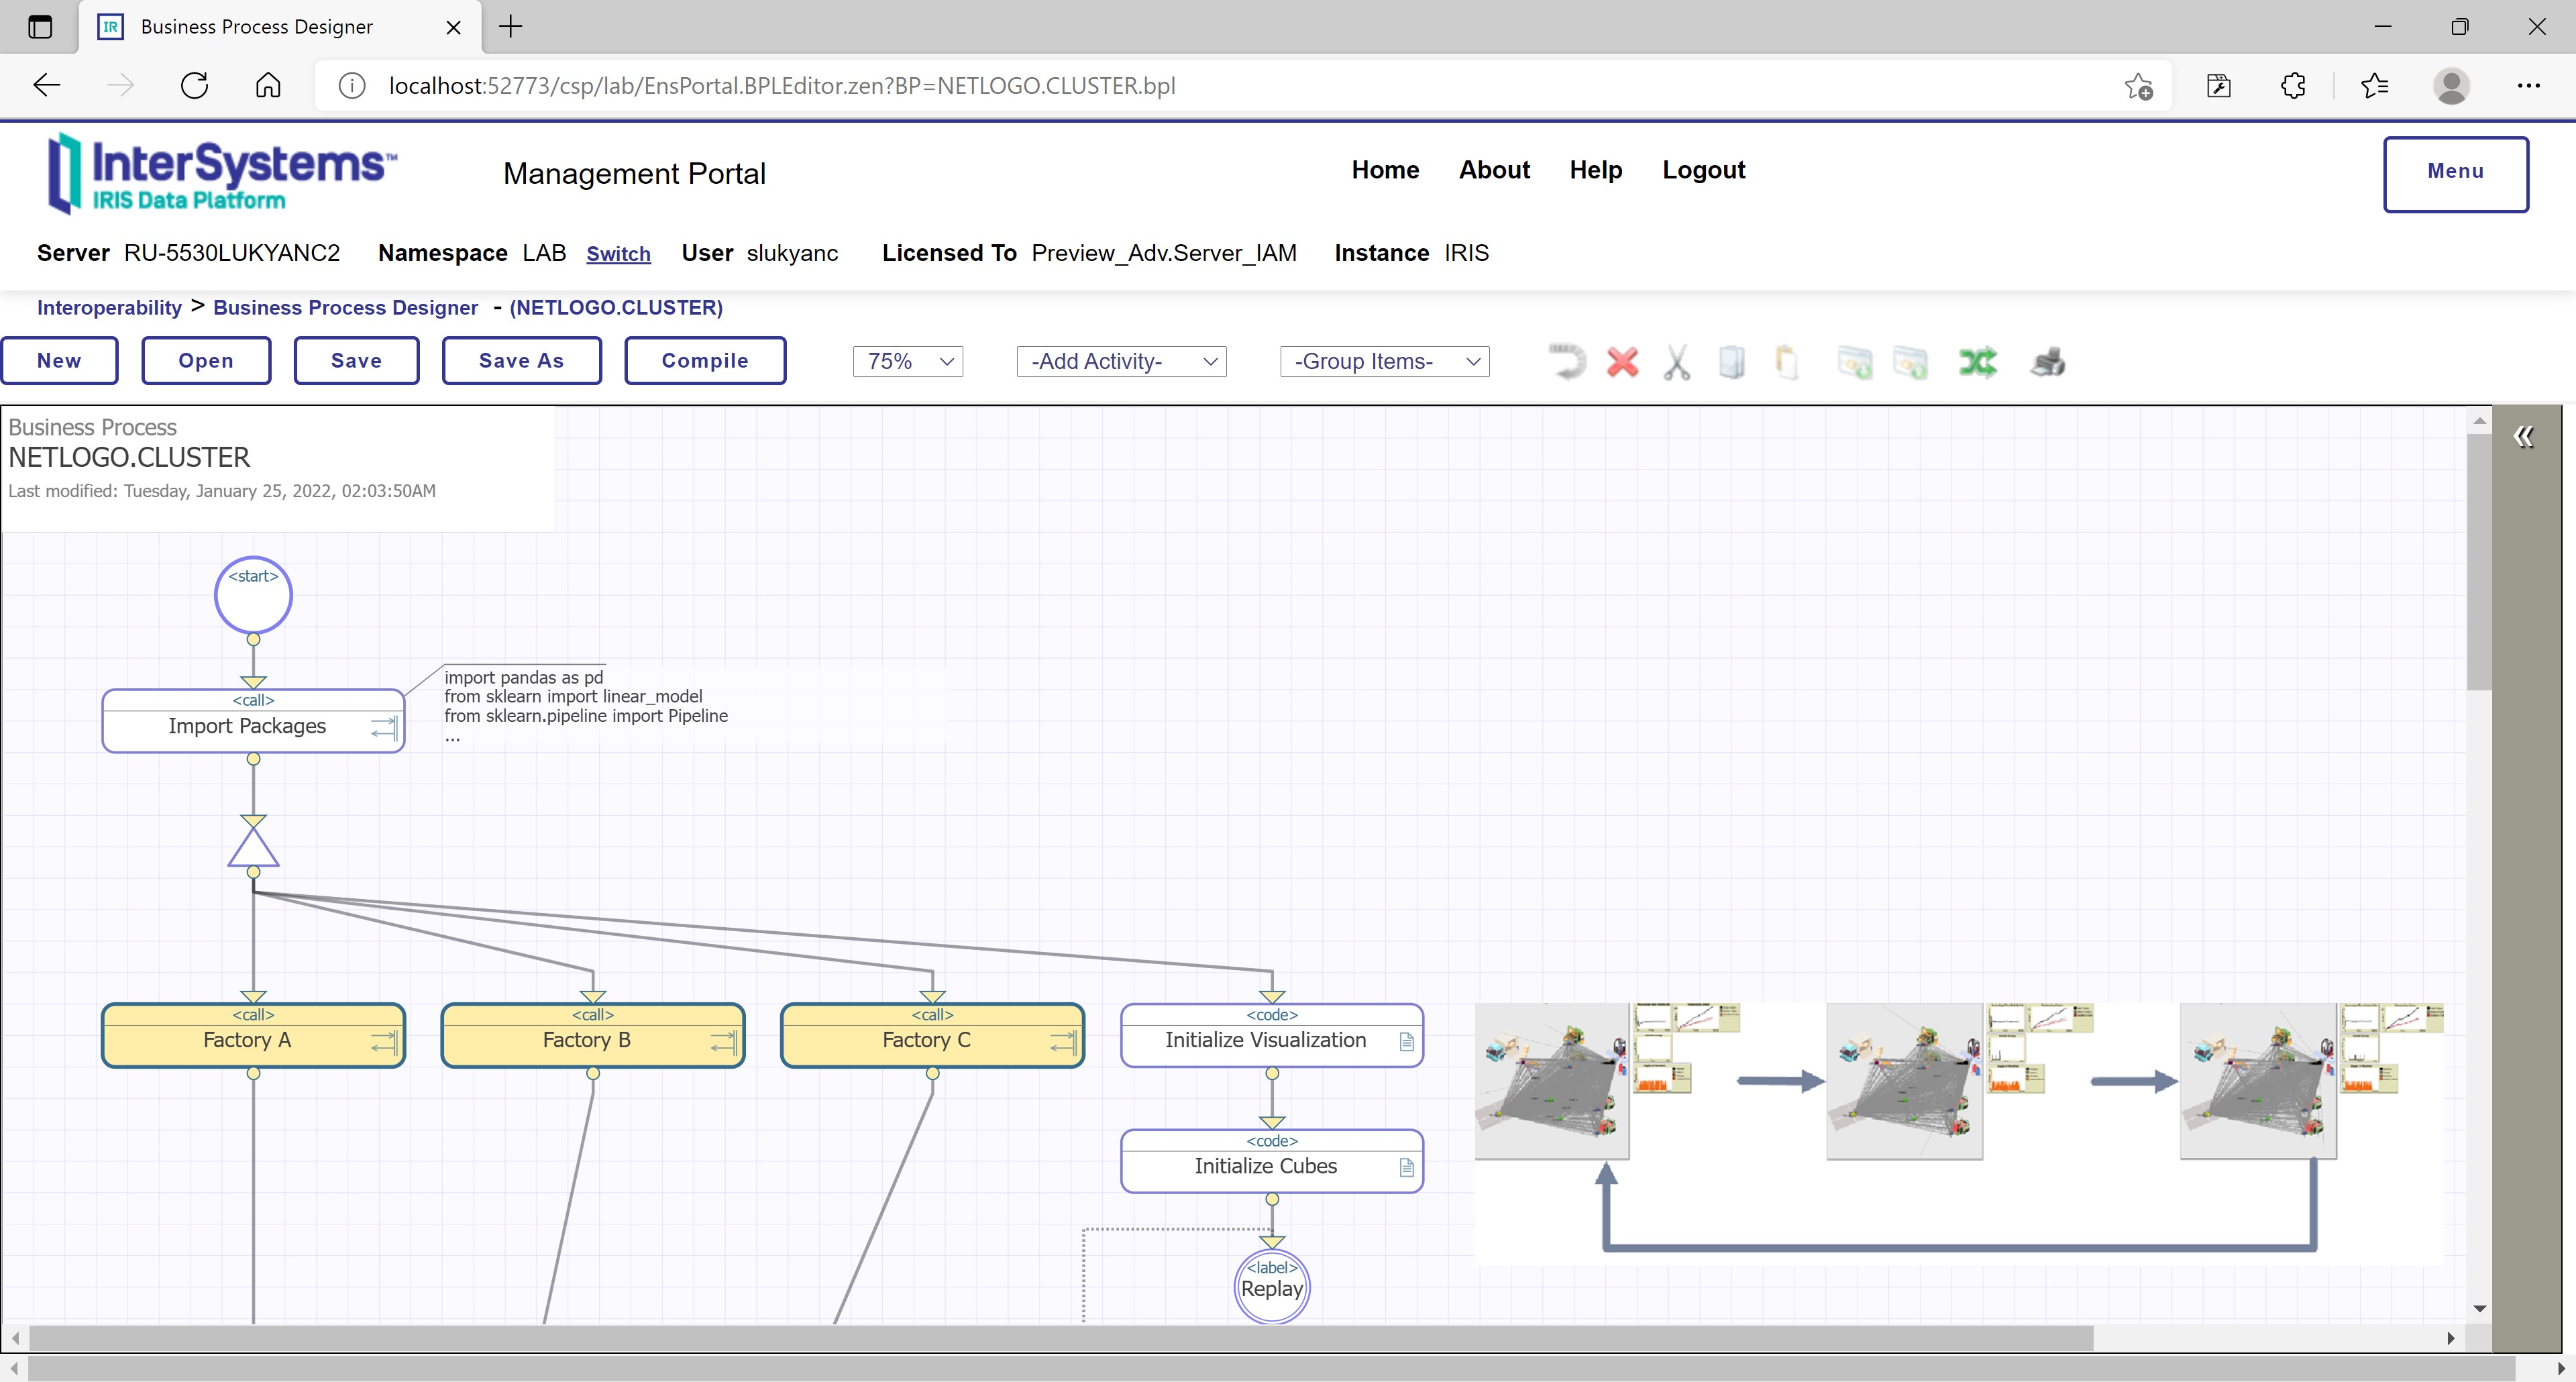 Figure 26: Orchestrating the cluster-level collective via InterSystems IRIS
Inter-factory interaction mechanisms in NetLogo have been described above in subsection “Interaction”. NetLogo models of the three factories make the implementation of the cluster-level collective complete.
4.11 Observation
Factory-level data generated via a NetLogo experiment, such as various quantities and other metrics, are systematically exported (on every simulation cycle) in a .csv file and become available for other NetLogo experiments plus for InterSystems IRIS processes:
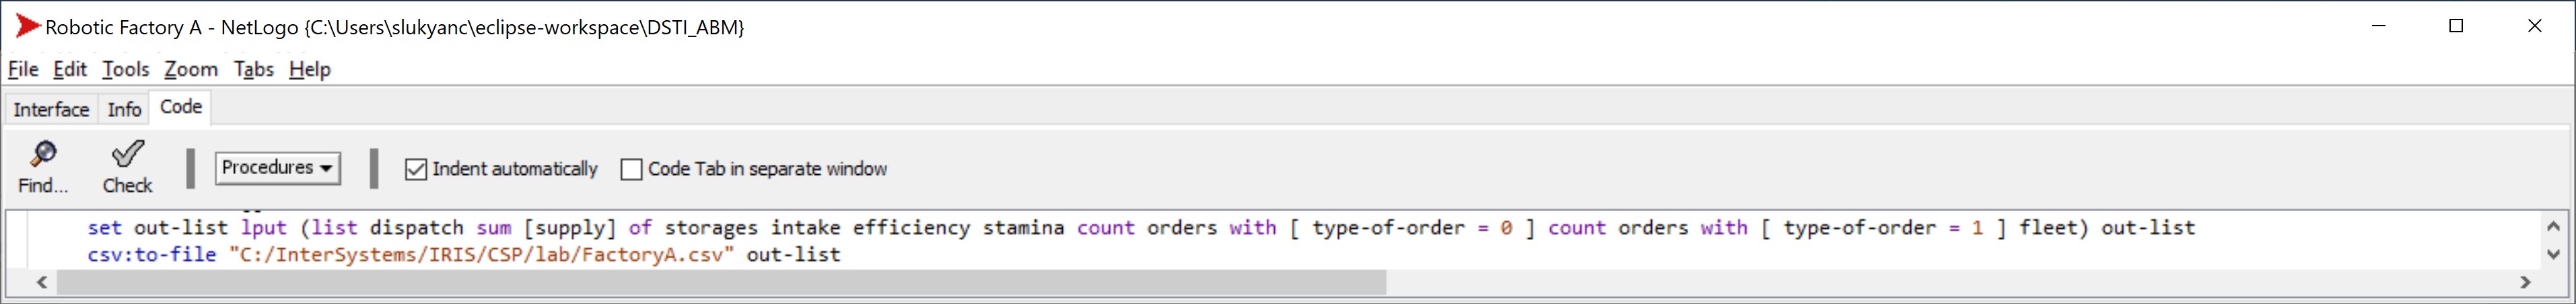 Figure 27: Exporting metrics from a Factory A experiment’s cycle to a .csv file
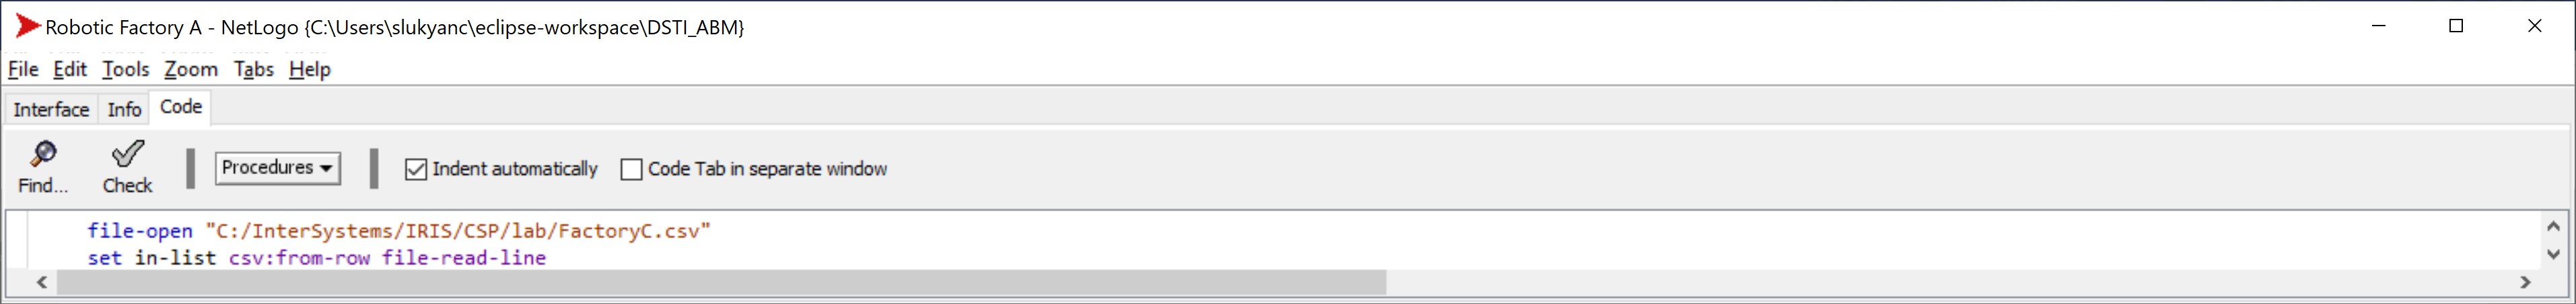 Figure 28: Reading metrics from a Factory C experiment’s cycle via a .csv file into a Factory A experiment’s cycle
 Figure 29: Reading and consolidating factory-level metrics from InterSystems IRIS tables
5. Initialization
The initial states of each of the factory-level models are determined via setup procedures in respective NetLogo models. As we could see from subsection “Collectives” above, agent initial properties are initialized at creation: x- and y-coordinates (influence distances that robots will need to cover), machine classes and statuses (influence the type of output and availability of machines), supply quantities (influence how long a machine or a warehouse will be able to run in the beginning without replenishment), etc.
Global variables get initialized as well as part of setup procedures:
 Figure 30: Initializing factory-level global variables as part of setup procedure
Certain factory-level global variables are re-initialized at each simulation cycle as part of go procedure to guarantee that if due to lock resolution the .csv file of the supplier or consumer factory is not accessible, and the factory model skips a read, the variables that depended on that read get filled with zero values (some of them, e.g., intake and dispatch, may be re-computed to non-zero values in the next cycle regardless of any lock resolution outcome):
 Figure 31: Re-initializing factory-level global variables as part of go procedure
6. Input data
The .csv files (OutputA.csv, OutputB.csv and OutputC.csv) that are available at NETLOGO.CLUSTER InterSystems IRIS process start and that contain initial values of certain factory-level metrics, are the carriers of input data for the factories. Most of the times, we preferred indicating zeroes as initial values in each factory’s .csv file:
 Figure 32: Initial Factory B metric values on its .csv file
Once NETLOGO.FACTORYA/B/C processes (launched by NETLOGO.CLUSTER process), in their turn, launch each its own NetLogo experiment, the .csv files start getting updated with the metric values from a current simulation cycle at each of the factories:
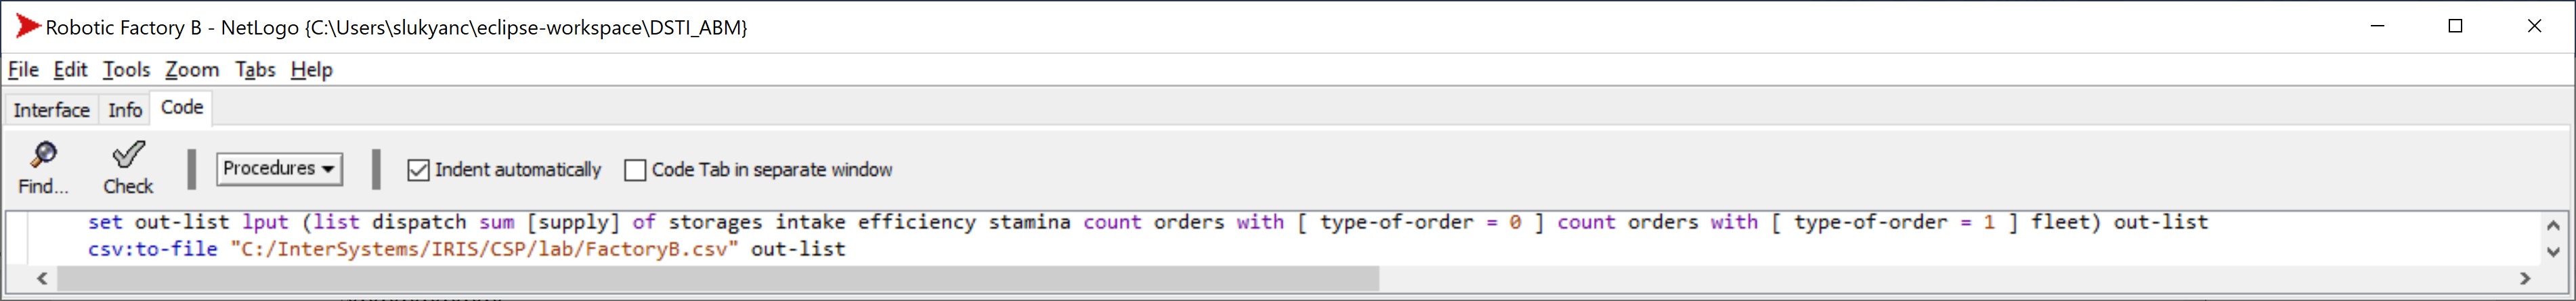 Figure 33: Update of Factory B metric values on its .csv file
Once the metric values get updated, they can be read by other factories from the .csv files:
 Figure 34: Updated Factory B metric values on its .csv file
7. Submodels
As mentioned in the very beginning of this text, the factory-level NetLogo models in our prototype are adaptations of “Robotic Factory” model [1] – we actively encourage the reader to use the link provided in “References” section to read the documentation and go through the code of that original model.
All the most important new/adapted elements in the NetLogo models implemented in our prototype were covered with reasonable detail through this text, and we are convinced that this is the best way to explain them (rather than exposing the reader to a complete NetLogo code in this section).
By the same token, InterSystems IRIS objects (production, processes, operations, tables, cubes, pivots, dashboard, etc.) are all stored as code in the platform, although we have not quoted a single line of their code in this text, again, because we think that the most relevant view here was visual view.
Nevertheless, should the reader be willing to get this prototype’s material (fully or partially) on their hands in order to materialize this or accelerate their own prototype – the author would be happy to share it once contacted via LinkedIn.
Findings
We would like to conclude by formulating the main findings from our prototyping and exploration experience described in this paper:
- The key win from in-platform implementation of agent-based simulations is the end-to-end control and cluster-to-floor transparence of the resulting solution: the specialized functionality available via simulation suites (NetLogo, in our case) gets complemented by the orchestration functionality available via a data platform (InterSystems IRIS), allowing modeling connected factory clusters more efficiently and credibly
- An advantage that analyst audience could consider important, is that the emergence and development of various inventory dynamics patterns (that are usually one of the most studied aspects in operations research) – bullwhips, hoarding, stockouts, etc. – become way easier to predict, detect and visualize graphically across the entire cluster’s supply chain (we could see some examples in this paper visualized in the cockpit dashboard screenshots)
- An advantage that IT-centric audience may find relevant, is that instead of a patchwork of separate solution pieces we obtain a scalable all-embracing DevOps framework, in which specialized ABM suites live in harmony with mathematical modeling suites (like Python, in our case) and with other components of the overall solution – while the data platform (InterSystems IRIS) assures seamless interoperability of all the components plus lifecycle continuity of the resulting solution
References
[1] Martin, K. and Wilensky, U. (2021). NetLogo Robotic Factory model. http://ccl.northwestern.edu/netlogo/models/RoboticFactory. Center for Connected Learning and Computer-Based Modeling, Northwestern University, Evanston, IL
[2] K. Ferdows & C. Carabetta (2006). The effect of inter-factory linkage flexibility on inventories and backlogs in integrated process industries. International Journal of Production Research, 44:2, 237-255, DOI: 10.1080/00207540500268947
[3] A. H.C. Ng, J. Bernedixen, M. Urenda Moris, M. Jägstam (2011). Factory flow design and analysis using internet-enabled simulation-based optimization and automatic model generation. Proceedings of the 2011 Winter Simulation Conference, DOI: 10.1109/WSC.2011.6147930