Can Cache Monitor (^MONMGR) and System Monitor be configured to also send 'OK' messages? With the first bad email, you still wonder if things are still broken, when in-fact normalcy has been restored, some even within some seconds.
I created a task from Management portal Task manager to use the Ens.Util.Tasks.Purge task . Task set up includes email notification setup for Completion email and error email.
This task is giving an error and no email is generated:
I've been trying for a while to come up with a set of tools to monitor the health of a mirror set and email a report nightly on the status of the mirror, or flag issues in real time. Making sure that all the databases are caught up, that all the mirror members are online.
I need to develop a tool to help to get what data is being consumed by a certain process, in order to get all data used to build an automated test scenario.
For example, some user process will pull data from ^GLOBAL(1)="dataString", ^GLOBAL(2)="dataString2", ^GLOBAL1(1)="data1String", ^GLOBAL2(4)="data2String4". Amidst all other data on these Globals, I will ignore everything that was not used in the user process, and get the specific keys used on it.
Previously, I shared with you all a handy operational analytics dashboard you can build to visualize key message processing metrics, such as number of inbound/outbound messages, average processing times, etc.
https://www.youtube.com/embed/XtXzvN3Gqgw [This is an embedded link, but you cannot view embedded content directly on the site because you have declined the cookies necessary to access it. To view embedded content, you would need to accept all cookies in your Cookies Settings]
Join us at the upcoming Developer Roundtable on April 25th at 9 am ET | 3 pm CET. 📍 We will have 2 topics covered by the invited experts and open discussion as always.
Tech Talks: ➡ Practical Usage of Embedded Python - by Stefan Wittmann Product Manager, InterSystems ➡ Monitoring and Alerting Capabilities of InterSystems IRIS - by Mark Bolinsky, Principal Technology Architect, InterSystems
▶ Register via >> this Global Masters challenge << Please note: access to the roundtable requires registration as an attendee.
As per the documentation of QueueCountAlert: Number of messages on this item's queue needed to trigger an Alert message to be sent. Note that no further alerts will be sent unless the number of messages on the queue drops below 80% of this number and then rises again to this number. Note that this alert will be sent even if AlertOnError is False. Zero means no alerts of this type will be sent.
Now, the question is, If QueueCountAlert is set to 10, and the queue size become 11 we will be getting email once.
Whenever the Windows SNMP Service restarts, the snmpdbg log says the following.
13:08:59 :Attempting initial TCP connection(s) with 1 Cache instances ... 13:08:59 :Get connection with ENSEMBLE on port 1972 13:08:59 :Connection refused on port 1972, check if Cache instance ENSEMBLE is started. 13:08:59 :Cache iscsnmp.dll initialized for 1 configs
Ensemble and all productions are running. I've set up Caché SNMP agent on many other servers in our company and those are working fine. However this one server won't budge.
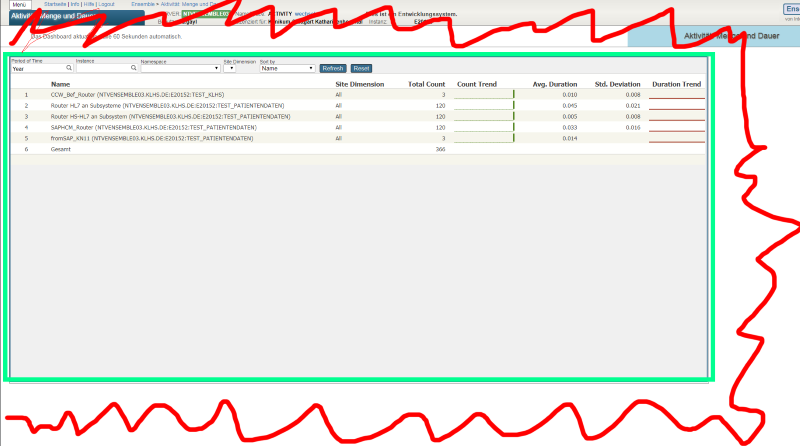
I believe most of you have encounted this problem: a healthconnect/ensemble user get a slow response and ask measurement on how long it takes ensmeble to process this request, the ensemble 'activity data' gives no clue of the delay.
The reason is HealthConnect message measurement was based on ensemble message, which can’t give a correct answer on when ensmeble recevie the request and what time it send back response. when there is delay on inbound/outbound adpter, or csp gateway, there is no way to find out the delay from "activity data" .
UPDATE: It turns out it was just me being a dummy, and the snmpd was correctly telling me there is no value associated with that exact key. I should have used snmpwalk instead of snmpget to display the whole tree.
Original Post follows:
Hello! I'm trying to set up SNMP monitoring on Caché, using documentation and this article
I have a problem on enabling SNMP monitoring on Cache.
I installed on HP UX NET SNMP 5.7.2 package from HP Software Center and enabled agentX protocol in snmpd.cfg.
When I enabled full debugging on Cache and NET SNMP I discovered that sent and received packets on both sides are not the same. Some bytes are different. I think the problem is in default charset for TCP/IP connection which is on our system set to CP1250 instead of default RAW. So result is that Cache notifies are not visibile from snmpwalk etc.
I hope you are all doing well. I am currently facing an issue while trying to set up the SNMP subagent functionality for my InterSystems Cache installation.
I am using InterSystems Cache for Windows (AMD64) version 5.2.4 (Build 809_0_9006U). The SNMP subagent functionality requires the iscsnmp.dll dynamic library, which I have been unable to locate in my installation directory.
Has anyone tried the new Activity Volume Statistics and Monitoring in Ensembel 2016.1? I would love to get some feedback.
If you haven't read about this, there is a dashboard that provides counts and response times for messages sent and received by each configuration item. Alternatively the underlying data is arranged in tables that should make it easy for you to use your favorite SQL reporting tools to generate reports for short term performance monitoring or longer term capacity planning.
Since most of our customers moved to Caché 2015.1, some admins became abused with CPUPct warnings (sometimes alerts) in console log without other signs of lacking CPU power. Documentation states that:
I just watched the recording of Michael Brady's presentation on Ensemble Disk Free Space Monitoring. Is the sample code for the Task definition class still available? How can I obtain a copy?
We are constantly running into issues where there are billions of Orphaned messages in our system that cause problems, and we have to manually run a cleanup to fix performance issues.
As part of our continuous efforts to expand and improve the InterSystems IRIS Data Platform, we’ve set up a brief survey around SQL monitoring. Your feedback will help us in designing and developing the right tools for the job and improve the platform’s overall ease-of-use. Please use the link below to access the survey, which should only take around 5 minutes to complete.
 By likes
.png)
 Open Exchange app