 By views
Hello Community,
I hope you are well.
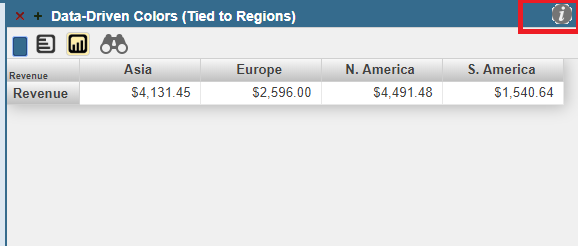
I encounter a problem on IRIS for Unix 2020.1 when I try to create a PDF from a simple Dashboard on Deepsee :
.png)
When I click on this widget , a tab appear and is loading for ~30 seconds, then shows 'error loading the PDF File ' :
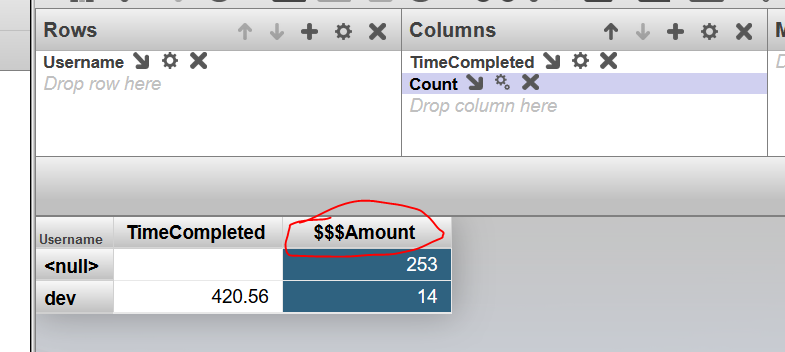
.png)
 Open Exchange app
.png)