What is Selective Build?

Selective Build is a BI feature in InterSystems IRIS (introduced in version 2020.1). Selective Build allows you to build specific elements of your cube while keeping your cube online.

What is special about Selective Build?

Before getting into the details of Selective Build, a brief recap of the different phases during a regular cube build is important. Here are the phases in a regular cube build:
1) Delete existing data in cube
2) Populate cube with full set of data
3) Build all indices in the cube

0 0
0 315

When analyzing data, there is often a need to look at specific indicators more thoroughly and to highlight sections of information of particular interest to a user.

For instance, examining the data dynamics for specific regions or dates can help us uncover some hidden trends and patterns that will allow us to make an informed decision about our project in the future.

1 0
1 268

Hi, Community!

This is the 3rd part of DeepSee Web story - Angular base UI for DeepSee Dashboards, see the beginning here.

By design, DSW provides an implementation for every widget in DeepSee library. But there are some extra features in DSW which make solutions built with DSW dashboards more functional. This article describes it.

2 0
1 794

BridgeWorks is pleased to announce a VDM, v9.1.0.1. This release includes the following updates:

Updates

  • Historical Linking is now based off connection profile name
  • Saved Formatting is now based off connection profile name
  • Tables and Fields column headers no longer hide based on connection type

Bug Fixes

1 0
1 203
Article
· Mar 2, 2020 2m read
SQL -99 error while viewing a listing

This error is sometimes seen while viewing a listing in InterSystems IRIS Business Intelligence:
ERROR #5540: SQLCODE: -99 Message: User <USERNAME> is not privileged for the operation (4)

As the error suggests, this is due to a permission error. To figure out which permissions are missing/needed, we can take a look at the SQL query that is generated. We will use a query from SAMPLES as an example.

1 0
0 808
Article
· Oct 27, 2016 1m read
Ensemble's Workflow Inbox portal

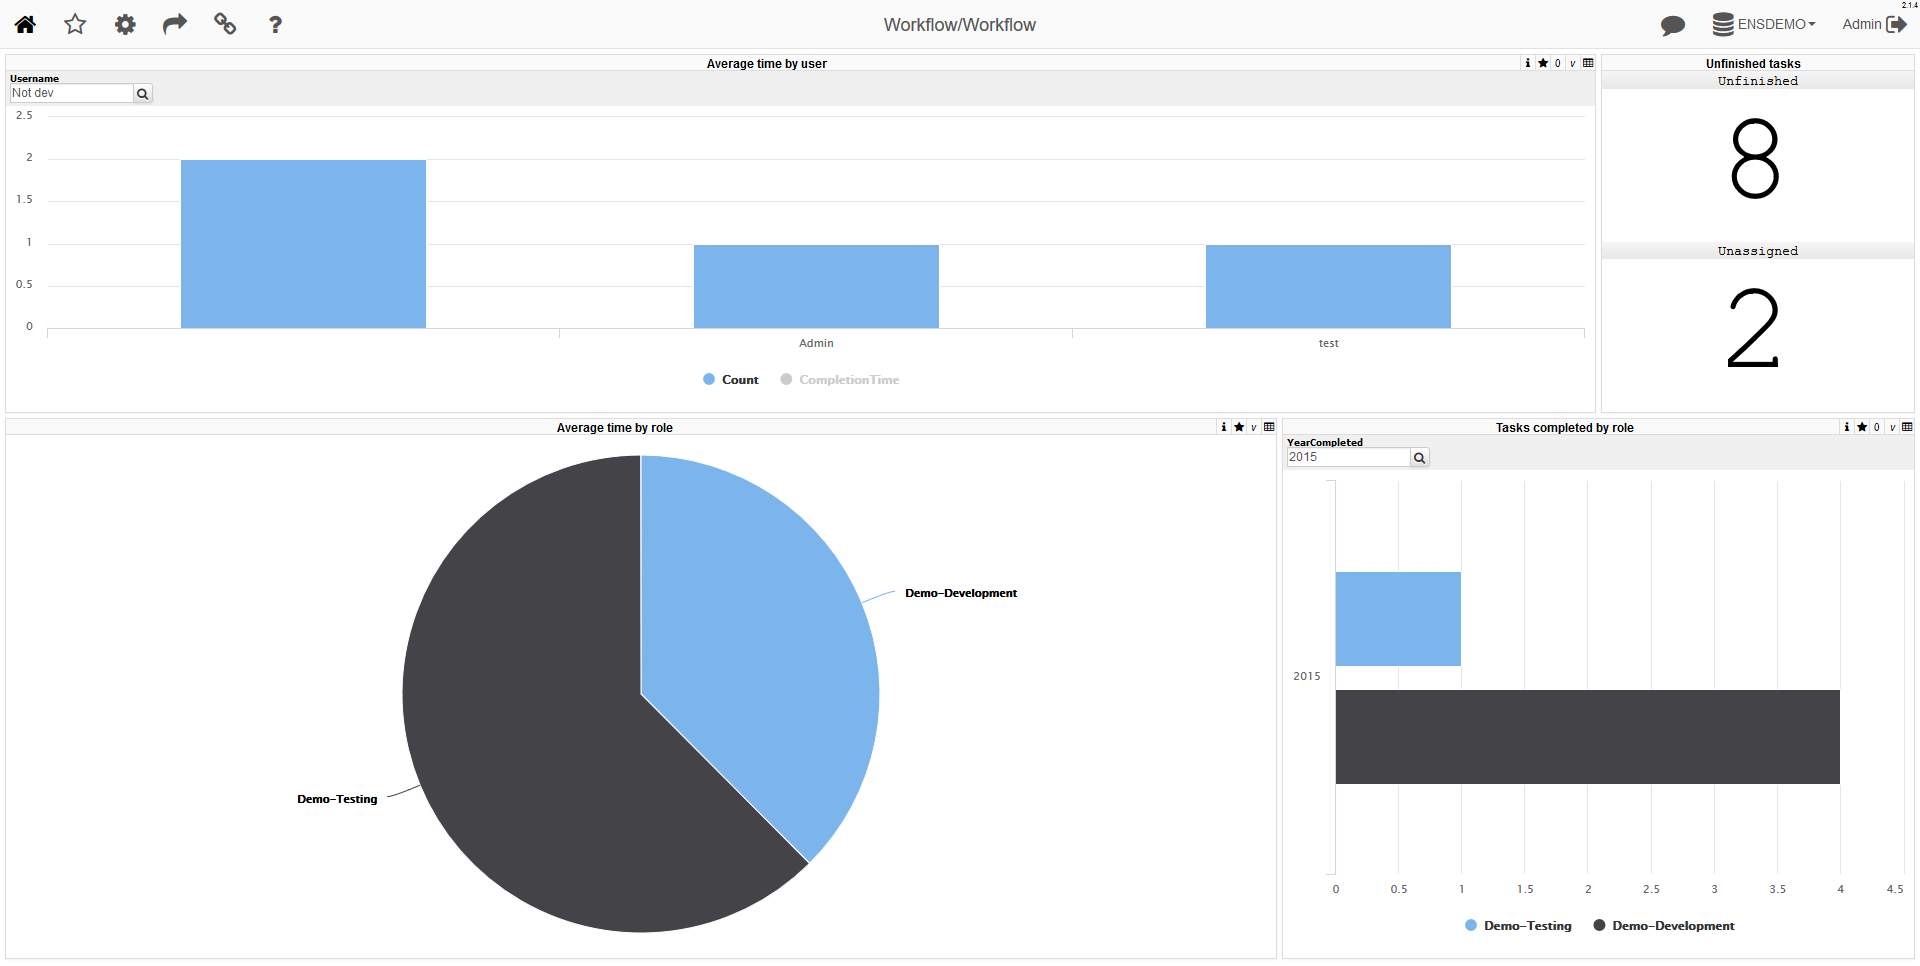
Hi - If you want to embed Ensemble's Workflow Inbox, (that offers workflow task items to workflow users) inside of your application - you can access the URL directly without necessarily giving users access to the Management Portal - but more importantly, you can strip away the Titlebar, Worklists and Borders that make up the page by default.

You do this by using the same URL parameters you would use, if embedding a regular DeepSee dashboard into your application.

For example, adding &EMBED=1 at the end of the URL as depicted below:

0 0
0 371

Introduction

Any election is a highly mysterious process, and when you look at its results, the overall picture is not quite clear. I decided to put them, region by region, on the map of Moscow using InterSystems technologies that offer both storage and data analysis functionality. In this particular case, I used InterSystems Ensemble, a platform for application development and integration, but you can also build this solution using the multi-model InterSystems Caché DBMS, as well as InterSystems’ new product called IRIS Data Platform.

3 0
0 709

Users of analytical applications often need to generate and send out PDF reports comprised of elements of the analytical panel. In the InterSystems stack, this task is solved using the DSW Reports project that is an extension of DeepSeeWeb. In this article, we will explain how to use DSW Reports for generating PDF reports and emailing them.

1 0
1 509

Presenter: André Cerri
Task: Use third-party visualization tools to present your DeepSee data
Approach: Use DeepSee REST services to access DeepSee data from third-party tools

Come see examples of how you can use popular 3rd party data visualization tools to access your DeepSee data.

Content related to this session, including slides, video and additional learning content can be found here.

0 0
0 248

In the previous part of this series, we saw how to define a basic portlet. Now we will look into making this portlet reference a web page that will enhance our dashboard experience.

In this example, we will be embedding a Developer Community article along side a couple of widgets displaying information related to the number of views on the Developer Community articles. This example is not hosted on the Community Analytics server, but if it was we could see the view counts going up as we interacted with the page.

Why use this?

In a real case, perhaps you have an embedded page from an external web site showing the current Emergency Room wait times for Hospitals in your area. This portlet can be used along side widgets from your Emergency Room showing how many people are waiting, how many doctors are active, and how many people are being treated. As other Emergency Room wait times grow, you can possibly expect your volume to increase as well. This can help you make decisions on how to allocate resources.

1 0
0 374

Power BI dashboards provide us with a good way to analyze aggregated information. We can even choose time periods for aggregation (you can find more details regarding it in our article about drill down). However, we might still be interested in a detailed look at specific data points. With the right data filling, we can display detailed data for any column of the chart with all filters applied to that chart.

1 0
0 840

Hi guys!

I'd like to present you my new project: iris-analytics-notebook, a notebook approach to use IRIS analytics capabilities.

Project description

In past few years, notebooks tools like Jupyter are gaining popularity due its natural way to express ideias.

An almost unipresent tool for data scientists, notebook can also help to improve the impact of analytics tools for all sort of users.

2 0
0 208
Article
· Sep 9, 2022 1m read
DC Analytics Open Application

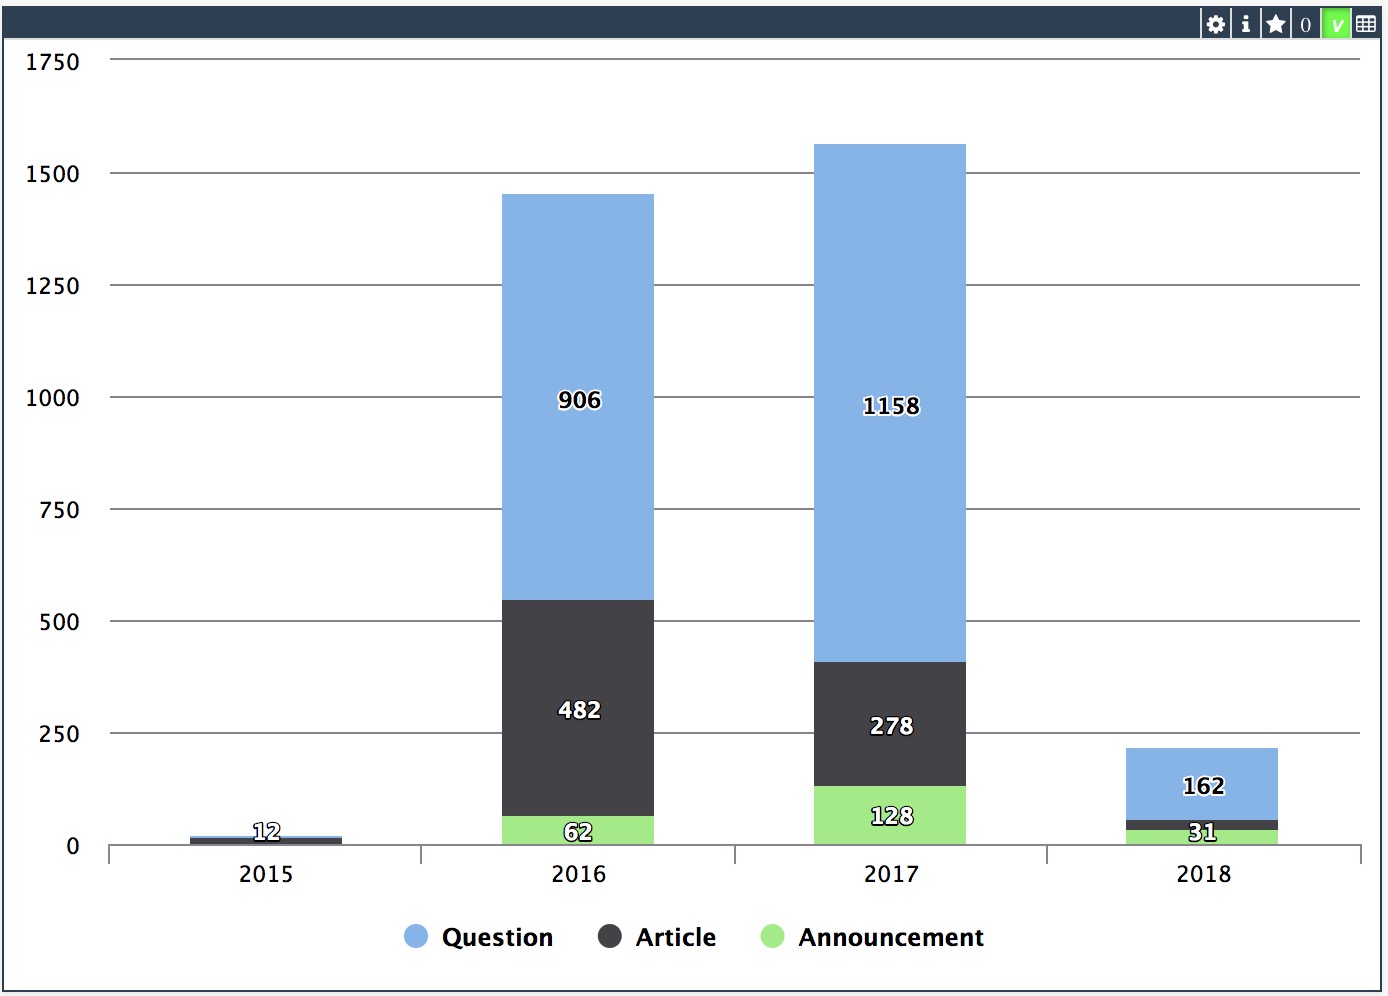
InterSystems Developer Community analytics. Project made with InterSystems IRIS BI (DeepSee), Power BI and Logi Report Designer to visualize and analyze members, articles, questions, answers, views and other pieces of content and activity on InterSystems Developer Community.

You can see your own activity, articles and questions. Track how your contribution changes developer community.

2 0
0 261

Presenter: Barry Cooper
Task: Enable users to perform analytics within an application and take actions based on those analytics
Approach: Provide examples of embedding DeepSee within applications

Analytics is more than just using data to provide insight. Analytics is about taking action on that insight. See examples of how you can embed DeepSee in your applications, allowing you to take action.

Content related to this session, including slides, video and additional learning content can be found here.

0 0
0 160
Article
· Dec 31, 2019 3m read
Portlets that use data from DeepSee


In the previous part of this series, we saw how to reference a web page that will enhance our dashboard experience. Now we will look into referencing data that is already in our cubes.

In this example, we will be referencing the controller object and we will be extracting data from it. This data will then be displayed as text in our Dashboard. In Part 5, we will show how to incorporate this data into other charting libraries.

2 0
0 215

Hi Community,

Play the new video on InterSystems Developers YouTube:

InterSystems IRIS Business Intelligence - Tips & Tricks @ Global Summit 2023

https://www.youtube.com/embed/Ekjzny8zj98
[This is an embedded link, but you cannot view embedded content directly on the site because you have declined the cookies necessary to access it. To view embedded content, you would need to accept all cookies in your Cookies Settings]

1 0
0 125