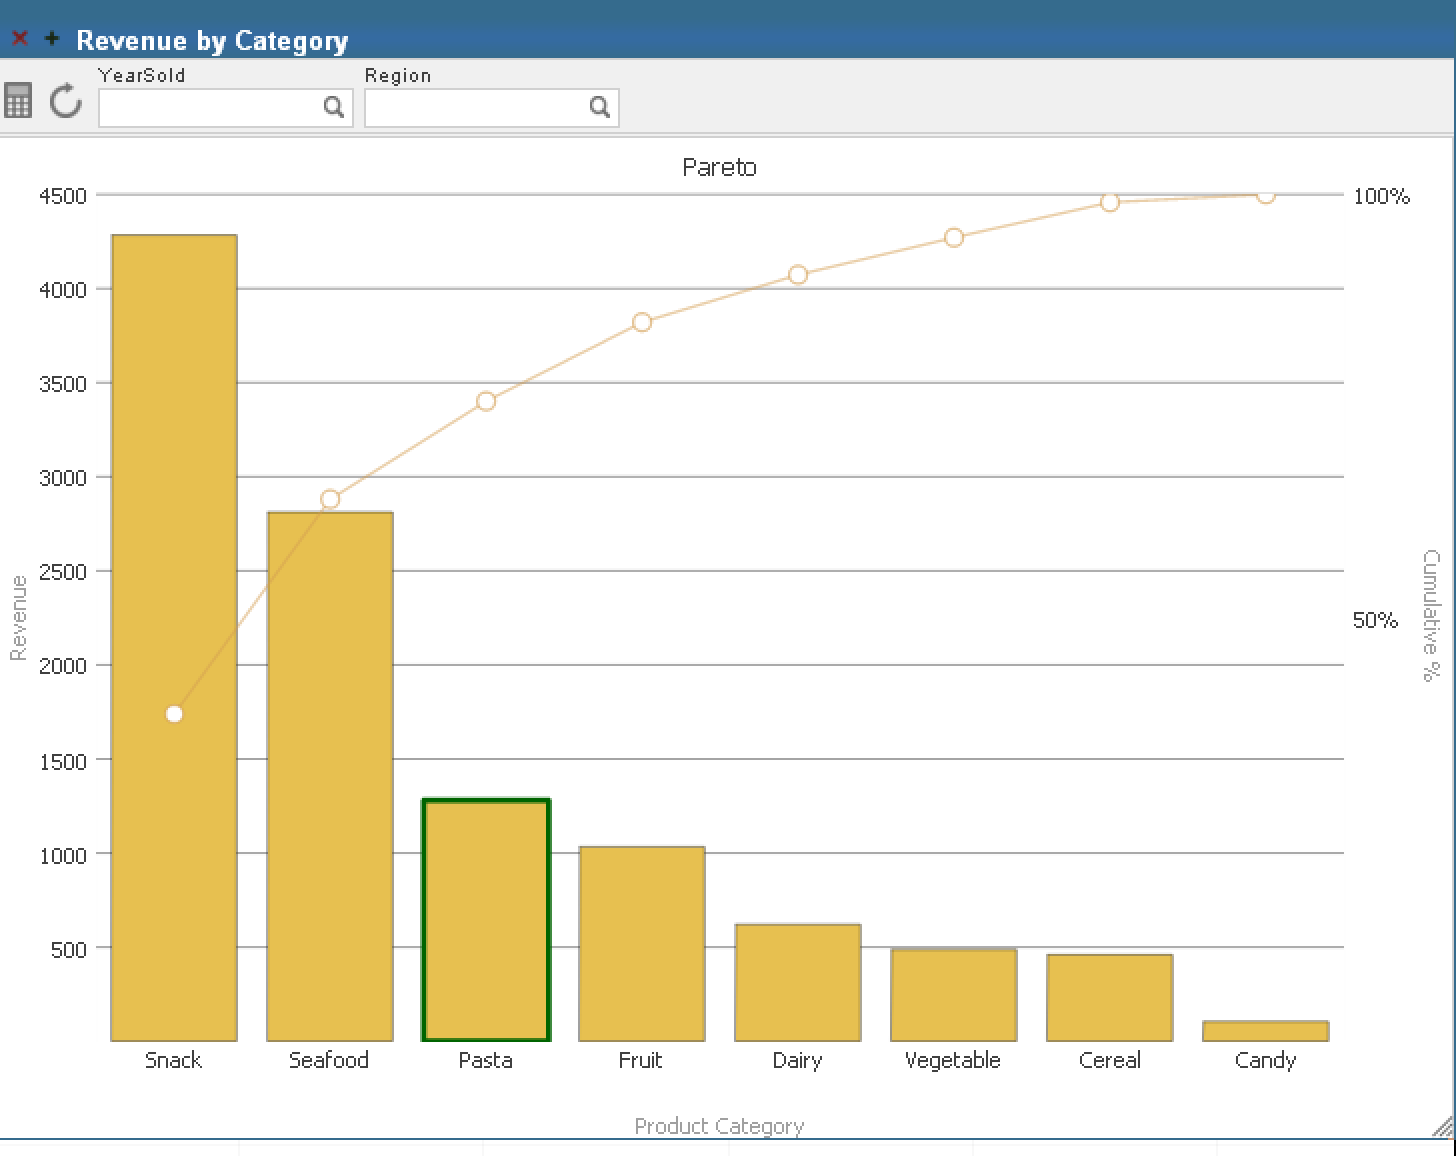
I am trying to create a query that returns the best and worst performing products for a given customer, based on this year's net sales versus last year's net sales, weighted by the total net sales for all of the products sold to this customer in the last two years.

I have created Last Year Net Sales (up to the last month end): AGGREGATE(PERIODSTODATE([Invoice Date].[H1].[YEAR],[Invoice Date].[H1].[Month].[NOW-13]),measures.[Net Sales])

0 3
0 327
Question
· Aug 1, 2019
DeepSee security issue

Hey Guys,

Have enabled DeepSee on my cache db via

Do EnableDeepSee^%SYS.cspServer(0)

I have created user with access to a profile with all the %Deep_See options (%DeepSee_Admin, %DeepSee_Analyzer etc etc) as well as %All. I have also added %All to unknownuser

When click the DeepSee page and choose a namespace Architect, Analyzer, Reporting Data Definition and Reporting Builder are all greyed out with 'you do not have privilege to view this page

0 3
0 215
Question
· Aug 3, 2017
DeepSee time series - season

Hello,

I have a series of data organized by time (year and month) so I can use a time dimension to drill down data. So far so good.

However, I need to display the data not by calendar years and months but rather by seasons. The season has 12 calendar months but starts in September. So I'd like to see the data from September / Year N to August / Year N+1 using the same hierarchy as normal time dimension.

Has anyone done something similar?

Obviously, the season can start by any month, not only September :)

TIA!

1 3
0 259

Hello, I've completed this tutorial: https://community.intersystems.com/post/deepsee-period-date-vs-same-peri...
I've used the "year" level instead of a pivot variable.
I want to calculate something like the following variation: 100 * ([DateOfSale].[PTD] - [DateOfSale].[LYPTD]) / [DateOfSale].[LYPTD]
I create a new calculated member, under the same dimmension with the above expression.

0 3
0 364

Hi,
I cannot edit properties (title etc) of Widgets within Dashboards outside of the ENSDEMO namespace:
I have a namespace "HL7Report" for example;
I have some Pivots created looking into a cube's data;
I click "DeepSee", "User Portal" from the Management Portal;
I click "+", "Add Dashboard", folder/name/title/category all as "new", "OK", new dashboard appears;
I click ">", "Widgets >", "+", and select a pivot to display as a table (chart / anything);

0 3
0 315

After creating a new dashboard the filters and favorites are not displaying on the left side.

The version info is as follows:

Cache for Windows (x86-64) 2017.2.1 (Build 801_3_18358U) Tue Jul 24 2018 16:38:29 EDT [HealthShare Modules:Core:15.032.8680 + Linkage Engine:15.032.8680 + Clinical Viewer:15.032.8680 + Active Analytics:15.032.8680

Thanks,

LG

0 3
0 150

I need to create a KPI similar to the DeepSee.Model.KPIs.DemoTrendLines kpi in Samples. This kpi supports a scorecard widget with a trend line. It shows patient counts by city with a trend line of the count of patients over a decade. What I want is to show the trend line based on the average allergy score ([Measures].[Avg Test Score]). A pivot table query that shows the data I would want to base the trend line on is:

0 3
0 303

Hi community,

When I export the cube and the pivots that I made and import to another environment , the calculated metrics and dimension and also de pivot variable didn´t appear in the other environment. Because of this the pivot that use these metrics show error when you try to open.

I want to know that this behavior is normal or exist a way that you can export everything, independent if you build inside the cube or inside analyzer.

Thanks.

Jaqueline Krieger

0 3
0 370
Article
· May 28, 2016 3m read
DeepSee Listing Groups

This article is about DeepSee Listing Groups, a new DeepSee feature that was introduced in release 2015.2.

DeepSee Listings have always been a part of DeepSee. DeepSee Listing Groups provide increased flexibility by allowing you to create new DeepSee Listings without modifying the cube definition.

3 3
0 269
Question
· Mar 4, 2017
Calculated Fields
  1. How can I create a calculated field to give the previous date. For example, I need to create a pivot table that shows total payments posted for the prior day.

  2. How to create a calculated field to show average daily collections divided by the number of the days passed in a month. So, for today, it would be the average daily collections divided by 4days.

Thanks!

0 3
0 439

Hi, folks!

When you deploy DeepSee solutions you often do not want grant a User %All Role to work with a particular Dashboard.

Consider a Dashboard 'Dash' with a few widgets where listings are being used.

If you manage a Role to get access to the Dash you need to grant access to %DB_DBNAME resource to have a database access, grant access to a Dashboard resource (if any) and ... grant SELECT accesses to all the tables involved in SQL queries being used in all the listings of widgets.

1 3
0 417

Hi Developers!

Often solutions with InterSystems IRIS BI can turn into a quite big solution with dozens of pivots and dashboards.

With every new IRIS BI solution release we can add changes that could influence the behavior of existing pivots or dashboards so they stop working. For example if we change the dimension or measure name, forget deploying some cubes or subject areas, conduct refactoring via mass renaming of cubes and its elements etc some widgets could stop functioning.

6 3
1 237

Hi everyone! My company has a Zen ERP application with CSP delegated authentication. Now, we're developing a separated BI application, using Angular, which consumes DeepSee REST API services. Both applications access the same Caché database.

How to implement single sign-on strategy in order to allow an already authenticated ERP user to access DeepSee REST services? Has anyone already implemented something like that?

Thanks in advanced.

0 3
0 536

In addition to charts on a dashboard we have a request to have a crosstab which would be populated by some entries queried out of an error log. It's basically a detail query with mostly text data. I have tried making a pivot widget for this using both a cube and kpi source, and while succeeding with the KPI, it leaves a lot to be desired.

0 3
0 158

Hi, Community!

You know, that when we build hierarchies in DeepSee dimension all the members of lower level should be the part of one member of the higher level.

If not you'll get some empty results in MDX queries with this hierarchy.

With Time dimensions the obvious valid hierarchy is Year->Month->Day, cause every Month consists of one Year and every day consists of one month.

2 3
0 396

To deploy a DeepSee solution, the docs recommend that you define a namespace on the reporting (mirror) server, and "define mappings to access the application data, application code, DeepSee cube definitions, and DeepSee data on this server". (http://docs.intersystems.com/ens20152/csp/docbook/DocBook.UI.Page.cls?KEY=D2IMP_ch_overview#D2IMP_overview_architecture)

1 3
0 291