Article
· Aug 31, 2016 1m read
DeepSee cubes building troubleshooting

Hi!

Sometimes you see that call to DeepSee cube building method:

w ##class(%DeepSee.Utils).%BuildCube("CubeName")

does nothing.

Here are my 2 cents on possible reasons.

1. Run DeepSee Reset method in certain Namespace:

NAMESPACE> w ##class(%DeepSee.Utils).%Reset()

and try again.

2. Make sure, that all the indices in your base class for the cube are rebuilt, rebuild them and run it again:

1 2
0 371

The source class of a DeepSee cube has a property referencing a different class:

Class ClassA Extends %Persistent {
     Property P1 As ClassB;
}

When records in class B change, the ^OBJ.DSTIME global for Class A will not be automatically updated. This means that synchronization of cubes based on source class A will not reflect the changes occurred to property P1.
This post will help you determine the best way to achieve synchronization of properties referencing a different class

4 2
2 428

In this article, we will explore the use of parameters, formulas and labels in Logi Report Designer (formerly Logi JReport Designer). What are they for and how to create them?

Using the basic functionality of InterSystems Reports Designer, parameters, formulas and labels, you can significantly improve the detail and information content of the generated report. In addition, these tools allow you to automate some of the processes, which greatly speeds up and facilitates the creation of reports.

Let's analyze each tool separately now.

4 2
0 251

Creating information dashboards, pivot tables, and widgets is an important step in analysis that provides valuable sources of information for informed decision-making. The IRIS BI platform offers many opportunities to create and customize these elements. In this article, we will take a closer look at the basic techniques for developing them and the importance of using them.

6 1
0 330

Hi, Community!

I’m sure you are using Developer Community analytics built with InterSystems Analytics technology DeepSee:

You can find DC analytics n InterSystems->Analytics menu.

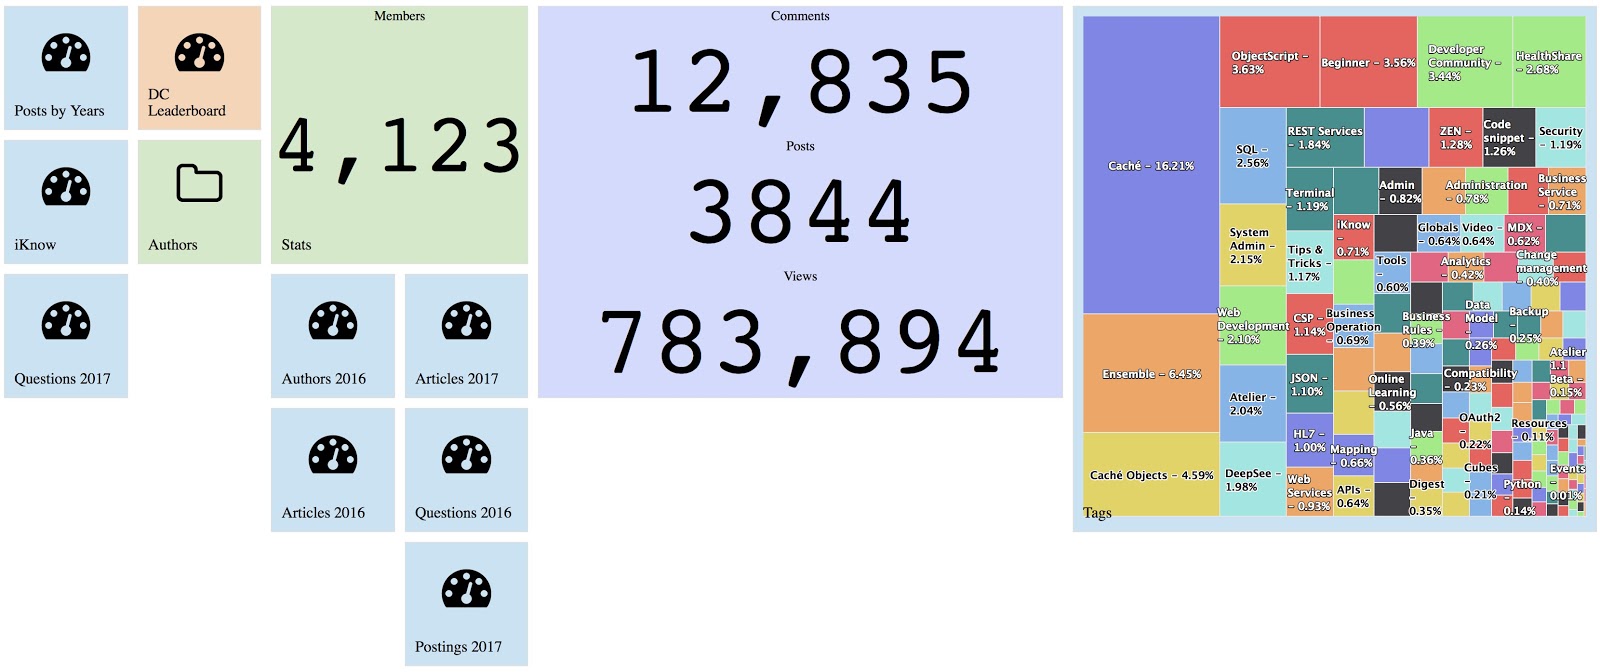
DC Analytics shows interactive dashboards on key figures of DC entities: Posts, Comments, and Members.

Since the last week, this analytics project is available for everyone with source code and data on DC Github!

2 1
1 538

I was approached recently by and end use who wanted to perform analysis of their databases and see how they could save some space by picking data good for deletion without harming the application. As part of investigation, they wanted to know sizes of globals within datasets. This can be achieved by various means but all of them provide data in text form only.

I thought I might be a good tool for database administrators in general - to see global sizes in a graphical way.

2 1
0 345
Article
· Nov 26, 2019 3m read
Designing valid hierarchies in DeepSee

When designing a hierarchy in DeepSee, a child member must have only one parent member. In the case where a child corresponds to two parents, the results can become unreliable. In the case where two similar members exist, their keys must be changed so that they are unique. We will take a look at two examples to see when this happens and how to prevent it.

5 1
0 670

When we are at the starting stage of BI project development, we must remember that it is crucial to select the right tool for its implementation. Today we want to show you how one of the principal functionality of dashboards is implemented in different BI systems. Let's talk about drill down from both points of view: the dashboard development, and the convenience and clarity for the end user. We will touch on the applications of this technology in IRIS BI, Power BI and Tableau.

3 1
0 553
Article
· Dec 12, 2019 2m read
Creating Portlets in DeepSee

What is a portlet?

The simple answer is: a custom widget. A portlet can exist by itself on a DeepSee dashboard, it can be used along side standard DeepSee widgets, or along side other portlets. The rendering of the custom widget is completely user defined. This means you can embed a web page, create a form to perform any sort of action needed based on the data on your dashboard, use third party charting libraries, or simply display data from outside of a DeepSee cube.

How to get started

6 1
0 440

Presenter: Joe Gallant
Task: Create a good analytical data model
Approach: Discuss what makes a good analytical data model. Provide examples of using DeepSee’s APIs for building custom dimensions, measures, and KPIs

Data models are the foundation of effective analytics. This session focuses on the factors that make good analytics data models.

Content related to this session, including slides, video and additional learning content can be found here.

0 1
0 243

Hi Developers!

Many of you are looking for samples on how to work with InterSystems IRIS Analytics, formerly known as DeepSee.

There is a Samples BI module with Patients and Holefoods examples which is available on Github with source code. The installation steps are clear but take time.

Recently we added the option to run IRIS Community Edition containers with ObjectScript Package Manager (ZPM) on board. This simplifies the installation to the "run-one-command" step for the modules submitted to ZPM Community Registry. And thus we can benefit the Samples BI installation with ZPM.

And here is how you can run it on your laptop. Let's go!

1 1
0 340
Article
· Feb 7, 2023 3m read
IRIS Queue monitoring component

1. Overview

With more and more hospital applications built, business interface data processing may be affected by a variety of factors (network, consumer systems, etc.), there is an excessive accumulation of messages or even cause interface lag, affecting the routine performance of hospital IT systems , so the monitoring of the business interface components queue is increasingly important.

While current Intersystems IRIS platform's built-in queue monitoring only displays real-time queue information for interface components, which is limited in providing the queue data information needed by hospitals. The queue monitoring component program is based on the Intersystems IRIS platform and can monitor all interface components and display component queue information within 24h of the component, as well as query component historical queue data by setting a time period to better meet the needs of current in-hospital applications.

4 1
0 226

The following post outlines a more flexible architectural design for DeepSee. As in the previous example, this implementation includes separate databases for storing the DeepSee cache, DeepSee implementation and settings, and synchronization globals. This example introduces one new databases to store the DeepSee indices. We will redefine the global mappings so that the DeepSee indices are not mapped together with the fact and dimension tables.

2 1
0 543

Whether you are accessing DeepSee for the first time ever or you are configuring DeepSee on a new instance, there are two common issues that are encountered after clicking on the “DeepSee” option in the System Management Portal.

Issue #1: Architect/Analyzer is grayed out!

Issue #2: DeepSee must be enabled before use.

Issue #1: Architect/Analyzer is grayed out!

There are two common causes for this problem.

5 1
0 1.5K

This post provides further detail on the suggestions from the DeepSee Troubleshooting Guide about what to do if a user is not able to view a listing in a DeepSee cube, but instead sees errors like this:

ERROR #5540: SQLCODE: -99 Message: User <username> is not privileged for the operation [zfindStatement+118^%SQL.DynamicStatement.1:<namespace>] (8)

1 1
0 809

InterSystems IRIS Business Intelligence allows you to keep your cubes up to date in multiple ways. This article will cover building vs synchronizing. There are also ways to manually keep cubes up to date, but these are very special cases and almost always cubes are kept current by building or synchronizing.

2 1
0 552
Article
· Sep 11, 2021 5m read
iris-analytics-for-money

I regret getting a late start in the InterSystems Analytics contest. I had tried a couple of times before to use Analytics, but I had not gotten too far. I have been recording financial transactions in Excel workbook ever since I had to retire Microsoft Money. Since my iris-for-money was not fully functional, I created a worksheet per account I was tracking. I had developed a CSP page in iris-for-money to import transactions by reading a CSV file.

8 1
0 230

The DeepSee TroubleShooting Guide helps you track down and fix problems occurring in your DeepSee project. A common problem is finding less records than expected in a DeepSee Cube or a related Subject Area. The DeepSee TroubleShooting Guide suggests starting your investigation by checking the following:

Check cube for build restrictions

Check if maxFacts is used

Check if Build Errors are occurring

2 0
0 392

Introduction

Any election is a highly mysterious process, and when you look at its results, the overall picture is not quite clear. I decided to put them, region by region, on the map of Moscow using InterSystems technologies that offer both storage and data analysis functionality. In this particular case, I used InterSystems Ensemble, a platform for application development and integration, but you can also build this solution using the multi-model InterSystems Caché DBMS, as well as InterSystems’ new product called IRIS Data Platform.

3 0
0 705

When analyzing data, there is often a need to look at specific indicators more thoroughly and to highlight sections of information of particular interest to a user.

For instance, examining the data dynamics for specific regions or dates can help us uncover some hidden trends and patterns that will allow us to make an informed decision about our project in the future.

1 0
1 261

Hi, Community!

This is the 3rd part of DeepSee Web story - Angular base UI for DeepSee Dashboards, see the beginning here.

By design, DSW provides an implementation for every widget in DeepSee library. But there are some extra features in DSW which make solutions built with DSW dashboards more functional. This article describes it.

2 0
1 791

Hi Devs!

Last weekend I had been testing the newborn csvgen module and was looking for a CSV file to test - thus I came across an interesting datafile on Data.World with Game of Throne episodes statistics. Death statistics. These folks documented all the murders through all the 8 seasons and noted where, who, from what clan with what weapon had killed another one.

So I imported it and made an IRIS Analytics dashboard.

You Know Nothing, Jon Snow | You Know Nothing, Jon Snow | Know ...

Don't worry, Jon, with this dashboard we can figure out something ). See the details below.

6 0
2 566

What is Selective Build?

Selective Build is a BI feature in InterSystems IRIS (introduced in version 2020.1). Selective Build allows you to build specific elements of your cube while keeping your cube online.

What is special about Selective Build?

Before getting into the details of Selective Build, a brief recap of the different phases during a regular cube build is important. Here are the phases in a regular cube build:
1) Delete existing data in cube
2) Populate cube with full set of data
3) Build all indices in the cube

0 0
0 311